Introduction
Caterpillar, Inc. (CAT) is a huge firm with an international footprint with 68% of the total sales coming from other countries apart from U.S; this makes it a leading company in the industry (Caterpillar 2012). The firm produces earthmoving equipment used in activities such as logging, general construction, road building, petroleum, agriculture, and mining that it supplies to the international market (Wilcox 2011). The firm also manufactures lift trucks and the inner combustion engines (Wilcox 2011; Bern 2012). The firm was established in 1925 and it’s headquartered in Peoria, Illinois (Bern 2012; Finance.yahoo.com 2012a).
The economy of U.S. is recovering from financial crisis while the rest of the world is experiencing either slow growth or recession. As a result the demand for CAT’s product seems to have dipped across the globe.
Therefore, this paper will discuss the fundamental and technical factors that make Caterpillar’s stock potentially profitable for investment. It will also include the valuation of the firm using various methods such as NAV, P/E multiple and Discounted Cash Flow. Finally, this paper will give recommendation to any investor considering acquisition of CAT’s stock.
Fundamental analysis
CAT shareholders have recently enjoyed concrete return fundamentals. For the purpose of this analysis, I will consider margins, EPS growth, and dividends among others to determine the firm’s performance.
Margins matter
Caterpillar is in a position to keep the bulk of what it earns from sales, and the more cash it keeps the more it has to fund growth, finance strategic plans and distribute to the owners as dividends and share repurchases. Over the last twelve months the firm’s gross, operating and net margins have been 26.2%, 11.9%, and 8.2% respectively (Jayson 2012).
A firm with low gross margins, which have a downward trend, is frequently failing to benefit from available opportunities, and perhaps trying to lower the prices. Therefore, if it is unable to minimize costs its share will have a distinctly bleak position (Jayson 2012; Knight 2012).
The economic shocks recently experienced worldwide may significantly affect a firm’s profitability, which implies that a five-year analysis of the firm’s margins is worth looking at. An investor cannot reach a solid conclusion on the firm’s health, but one can better comprehend what to anticipate and what to look out for (Jayson 2012; Knight 2012).
Because of business seasonality, the TTM (Trailing Twelve Months) figures in the year 2011 cannot be compared with full year figures preceding them. To make a comparison between prior-year levels and quarterly margins, consult Chart 2.
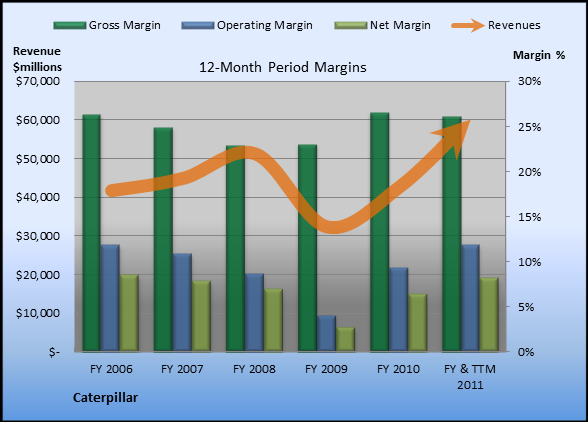
For the five-year period, gross margin, operating margin and net margin were high at 26.5%, 11.9% and 8.2% respectively and had an average of 24.7%, 9.0% and 6.4% respectively. The gross margin, operating margin, and net margin for the TTMs were 26.2%, 11.9%, and 8.2% respectively with basis points that were better than five-year period average of 150, 290 and 180 basis points respectively.
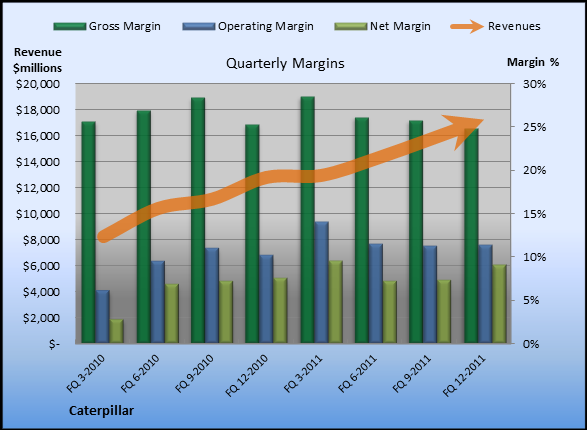
The firm registered a TTM return-on-equity (ROE) of 38% and return-on-assets (ROA) of 6%. ROE was higher than the industry average. A return-on-capital Employed of 13.5% supports the efficient utilization of the capital (Merola 2012).
Earnings per Share (EPS) have increased considerably over the years. The EPS for instance, has increased by 254.07% to $7.40 in the year 2011 compared with the 2009 EPS of $2.09. The management announced an average EPS guidance of $9.25 for every share in the year 2012. In the meantime, sales have practically doubled in the period. In 2009, the sales were $32 million and increased to $60 million last year (2011). The firm predicts that it will make $70 million as revenue for year 2012 (Merola 2012). Analyst firms like Morgan Stanley, Morningstar, Citigroup, and Barclays Capital among others, covering Caterpillar have projected the firm’s EPS for the next four years. The projection is determined by the First Call according to earnings predicted by the analysts (Caterpillar 2012) as shown by Table 1.
Table 1: EPS estimates
On June 2011, CAT announced an increase of the quarterly dividends by 5% to $0.46 for every share. The dividends increase was to enable the firm’s stock to provide a 1.9% as yield. Over the years the CAT’s dividend yield declined considerably because its stock increased by 73% over a twelve-month period since June 2010 to June 2011 (eDividendStocks.com 2011).
Since 1933, CAT has been paying regular dividends to owners and it has increased the dividends for 18 years in a row. In 2010, the firm increased its dividend by 5% as shown by Chart 3. The 2011 dividend increase of 20% was significantly little compared to 47% dividend increase from its objective in 2010 (eDividendStocks.com 2011).
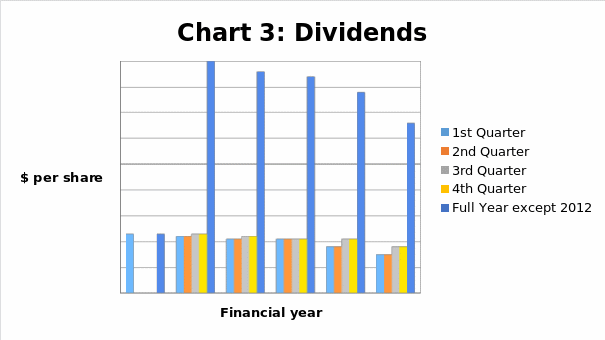
Increase of the firm’s dividend is another way of indicating how CAT is committed to increasing shareholders value. Currently, it is facilitating considerable investment that will prepare CAT for upcoming improvement in business cycle as well as in attainment of its long-range financial goals (eDividendStocks.com 2011).
The growth of the dividend has several inconsistent spots. In the latest financial crisis, CAT omitted one year of growth in dividend, and paid the quarterly dividends to the shareholders at $0.42 for every share for a total of eight quarters. Similarly, the same took place in 2002 recession (Dividend Monk 2011). The firm has a payout ratio of about 30%; thus, the long-range dividend prospects are secure in that view, even though dividend might be held stagnant in periods of improbability and low profits. The debt/equity ratio is at a high of 2.6 while the interest cover is below 5. The statement of financial position weakness is just not a short-range problem but it presents risk to dividend in the long-term.
Apart from dividend payments, investors are also rewarded in form of share repurchases. In 2011, the firm endorsed the expansion of firm’s present repurchase program. This program was formerly adopted in 2007 and it was supposed to conclude at the end of the year 2011. About $3,750 million of the authorized amount of $7,500 million under the repurchase program is still available for use in the future. Currently, the firm does not plan to undertake any stock buybacks under this program. The current program will end at the end of the year 2015 or once the buyback is completed (FNNO Staff 2011).
CAT’s outstanding customer network as well as scale gives it equally outstanding control of cost to steer any type of macro-environment. Investment in China was overblown because of high competition and currently there is no indication of any investment capacity in that country. Due to this the firm is likely to go to Indiana, which normally has high margins because of non-unionized operations. Similarly, CAT is penetrating the international markets that currently constitute “three-fifths of machine and engine sales market” (Takeover analyst 2012, p.1). But CAT is faced with more risks like commodity volatility because of Bucyrus acquisition (Takeover analyst 2012).
Behind these figures is a dedicated management team, which has demonstrated the discipline of making wise investments and decisions. Throughout the prior business up-cycle that took place in mid-2000s, the firm’s management remained strong. Recently, CAT has performed better than the market, ten times the past twelve quarters. In reality, management has offered strong guidance of the company over the years amid political and economic challenges that have affected CAT Company (Merola 2012). As a result, the management continues to be bullish on the firm’s future prospects (Merola 2012). Of late, CAT’s CEO, Ed Rapp has offered his outlook that “CAT is only two years into what is typically a six or seven year cycle” (Merola 2012, p.1). In addition, “tail winds” emerging from ultimate economic recoveries of Europe and North America will boost the firm in out-years (Merola 2012).
Market Value Added (MVA)
MVA indicates the variance between shareholders’ capital and firm’s market value; this in summary is the “capital claims that the shareholders and bondholders hold against the firm plus equity and debt market value” (Value Based Management.net 2011). A high MVA is better because it shows that the firm has added significant wealth to the owners. Conversely, a low MVA implies that the significance of investments and management’s actions are not more than firm’s capital as measured by capital market, or it may mean that the firm’s value and wealth have been ruined (Value Based Management.net 2011). MVA is determined as follows:
- MVA = Market Value of Equity – Book Value of Equity
Where:
- Market value of Equity = share price x share issued
Table 2: MVA
The firm’s MVA has been positive throughout the five years, with the highest increase being in 2010 at 73.73%, which was $65,499 million. In 2011, the value added by the firm reduced by 6.95% to $60,946. This implies that CAT has added significant wealth to the owners and that the firm will be able to add even more value to owners in the future based on stock market valuation.
Technical analysis
After exploring the firm’s earnings, dividends and management, it is vital to look at charts to establish whether the stock is good for investment. The price of CAT’s stock returned 1.6%, the highest figure in 52-week; this may show that the stock price will have to decrease before increasing, thus any type of investment must wait (Knight 2012). Nevertheless, it seems that CAT’s stock price has reached its ceiling just below $117. This is vital because once the ceiling is broken; the $117 level will be the price floor. Also if it is broken, the investors will possibly see the stock price go another range of 8% to 12% above $117 before any other weakness is experienced. Thus, in both long-term and short-term, CAT will be able to cultivate enough revenues for shareholders (Knight 2012).
CAT’s chart has shown an upward trend for the last two years. That is to say, since fourth quarter of 2010 and first quarter of 2011employees efforts resulted to the trend seen in the share price. The present trend also shows that the company is in the upward trend. This trend may be due to fact that CAT’s share price fell roughly by 42% all through the short-lived mini-bear market during the mid-2011. Some firms’ stocks have volatile stocks in times of weakness, which is vital for the long-range investors since equity markets repeatedly cycle between bulls and bear markets. This means it is advisable for investors to have stocks that are less volatile like CAT, during times of weakness (Knight 2012).
Additionally, CAT is presently in a superior growth stage and this makes it good for long-range investment. Thus, the firm’s stock price will keep on increasing each and every quarter as well as each and every year. A contrarian may not invest in CAT as it has a low probability of being below the 52-week high in the bull market. Since the firm’s stock will have to fight with the $117 level possibly for a long time or entire week. But with combination of its dividend history, high growth, increasing sales and net profit margins, lower volatility, as well as a rise in demand and supply, make CAT’s stock a wonderful long-range addition to the investor’s portfolio (Knight 2012).
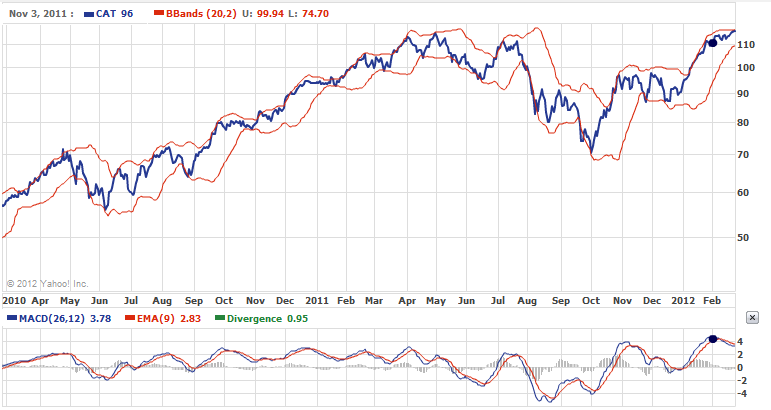
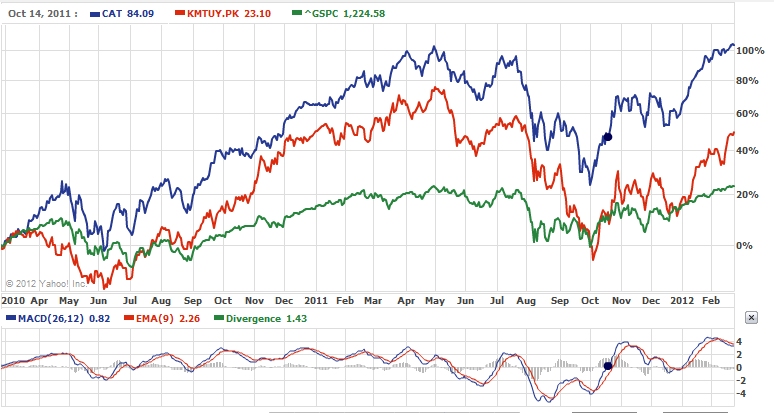
For the last two years CAT’s stock had a higher share price than competitors, mainly the Komatsu Ltd (KMTUY.PK), and the industry in general as measured by S&P 500 (GSPC). CAT’s stock shows the same trend as the market, meaning it moved in the same direction as the market, this shows that there may be a strong correlation between the market and CAT’s stock as shown by Chart 5.
Valuation
Valuation of businesses has turned out to be an intrinsic component of a corporate landscape which has experienced dynamic changes over the past few years; it encompasses “corporate restructurings, share repurchases and merger and acquisition which are taking place in big numbers all over the world” (Secondventure.com 2011). At the centre of these activities stands several perception of valuation. Valuation techniques are not just used in accounting but they are used to provide cue to the investors, corporate acquirers, and venture capitalists to identify the real value of the firm’s assets. These valuation techniques may include, Discounted Cash Flow, Net Asset Value and Price/Earnings (P/E) multiple or ratio (Secondventure.com 2011).
Net Asset Value
In finance, any items owned by a firm or entity and individual are assets with financial value that can be converted to cash. The firm may owe creditors some money, which it has to pay. NAV is the value obtained after deducting liabilities from assets. If the firm has more assets than liabilities it is deemed to be solvent as its NAV is positive, while the one with more liabilities than the assets is deemed to be insolvent (Sify Finance 2008).
Firm’s NAV also termed as Shareholders’ value, does not essentially equate to sales price. NAV considers both tangible and non intangible assets such as goodwill that will influence the firm’s future earnings. If a firm holds a patent that promises revenue increase considerably, it will validate sales price higher than firm’s book value. In case the products’ demand is decreasing in the market, the firm may sell the products at a lower price than NAV (Sify Finance 2008).
NAV is calculated as follows:
NAV = Total Assets – Total liabilities
NAV per share = $13,402 million / 814,894,624
= $16.45 per share
Table 3: NAV
Currently the CAT’s stock is trading at $116 compared with NAV of $16.45 we can say that the NAV and the share price are not the same. In general, the stock is selling at a higher price than NAV, which is termed as premium amounting to $99.45 ($116 – $16.45 = $99.45). We can also say that market capitalization ($75.11 billion) of the firm is higher than the NAV, this may be due to the fact that assets and liabilities uses historical prices and the investors believe that the firm is worth more and are thus prepared to part with more cash than its NAV. Since the share price is higher than the NAV one can conclude that CAT has high value and it is selling at a premium. Thus, the firm is profitable as a going concern and it will continue to function as such by improving the owners’ value through more cash flows from operations.
Price/Earnings (P/E) Multiple
P/E is a valuation technique that offers a benchmark for business valuation. It is possibly the most broadly used technique as well as the most widely misused investing metric. The multiple is very easy to determine and that explains why it is popular. It can be determined as follows:
P/E ratio = Share price / EPS or P/E = market capitalization / net income
P/E ratio can be multiplied by net income to determine the business value. The EPS is normally the trailing EPS for twelve months (TTM) and any P/E determined using TTM is frequently termed, as current P/E. P/E can also be a forward P/E that can be determined using analyst predicted earnings instead of the historical earnings. On January 31, 2012 the firm’s stock closed the day at $109.12 and its EPS (TTM) was $7.40. The management announced an average EPS guidance of $9.25 while the analysts as shown by Table 1 predicted that the firm’s EPS for the year 2012 will be $9.51. We can make use of the average between the two EPS estimates of $9.38 ($9.25 + $9.51 = $9.38) in order to determine forward P/E.
Current P/E (on January 31) = $109.12/ $7.40 = x14.75
Current P/E (on February 24) = $116/ $7.40 = x15.68
To determine the forward P/E we need to estimate share price after one year.
Share price = P/E x EPS (forward)
CNBC (2012) predicts that forward P/E will be x12.1 and analyst Merola (2012) predicts that forward P/E will be x12 thus the average of the two is x12.05
Share price = 12.05 x $9.25 = $111.46
Forward P/E (2012) = $111.46/ $9.38 = x11.88
Projected net income = $9.25 x 814.89 = $7,537.73 million
Firm’s value = $7,537.73 million x 11.88 = $89,548.23 million
Value per share = $89,548.23 million / 814.89
=$109.89 per share
Based on the calculated value of P/E multiple it can be noted that the current P/E on January 31 and February 24 are 14.75 and 15.68 respectively. This implies that the investors or the market was to part with 14.75 and 15.68 times firm’s 2011 earnings on those particular days. It also implies that the investors on January 31 and February 24 will take 14.75 and 15.68 years respectively to recover their earnings from firm’s 2011 earnings. The Forward P/E multiple of 11.88 means that the investors will take 11.88 years to recover their initial investment based on the estimated earnings of the year 2012. Also the investor will be expected to part with approximately $109.89 per share for firm’s earnings after one year. The Forward P/E is lower than the current P/E because the EPS is expected to increase from its current figure of $7.40 by approximately 26.76%. The firm’s value after one year will be $109.89.
Discounted Cash Flow
DCF uses Free Cash Flow (FCF) to determine the present value of cash flow by discounting them using discount rate. It is deemed as a strong measure because it focuses on generation of cash by the firm. DCF is vital when making a comparison or evaluating businesses. Ceteris Paribus, the investment or action with high DCF is the best investment to undertake (Macabacus 2012).
The discounting rate used to discount the cash flow is the shareholders’ required return, which can be determined using Gordon Growth Model also known as Dividend Growth Model (Macabacus 2012). The cost of equity or required rate is determined as follows:
k = D1 / MV + g
Where:
- k = cost of equity
- D1 = dividend to be paid next year
- MV = stock’s market value
- g = growth rate of dividends (6.06%)
- k = $1.909 / 109.12 + 6.06% = 7.81%
In 2012, CAT plans to use $4 billion as Capital Expenditure. The capital expenditure will be subtracted from operating cash flows in order to determine FCF. It also expects to earn revenue of $70 billion and return to investors approximately $9.25 for every share invested in the firm. Thus, the cash flow for 2012 will be calculated as follows:
Table 4: Free Cash Flow
Since the firm is a going concern, this means that it will continue to perpetuity, and to determine a perpetual value of the firm, the FCF is dividend by cost of equity as follows,
Value of the firm = FCF / Cost of equity
= $6,204.73 million / 7.81%
= $79,445.97 million
Value per share = $79,445.97 million / 814.89 million
= $97.49 per share
Based on DCF value the firm’s stock is overpriced compared with February 24 and January 31 share price of $116 and $109.12 respectively.
Gordon (Dividend) Growth model
This model values the firm’s stock using dividend yield. It uses the current dividend and dividend growth pattern to determine the stock value, thus making it a fundamental analysis technique. However, the model presumes that dividends have a constant growth (perpetuity) which is not the case (Wang 2009).
P = D1 / (k – g)
Where:
- P = share value
- k= 7.81% and g = 6.06%
- P = 1.909 / (7.81% – 6.06%)
= $109.09 per share
Therefore, the firm’s stock is overpriced when compared with its current price of $116 as at February 24 and when compared with $109.12 as at January 31, 2012.
Reconciliation
The valuation techniques display different values of the firm’s share. This means that in order to determine an approximate value of the firm we may need to reconcile these figures. This can be done by using weights, for instant the one that is more realistic is given more weight while the one, which seems to be unrealistic is allocated less weight. Take for instance NAV uses historical information to report liabilities and assets compared with the rest of the measures, P/E ratio, DCF and Gordon Growth Model, which are forward looking. Therefore, for the purpose of this evaluation NAV will not be considered since it is a past performance measure. Therefore, we are only going to consider DCF, Forward P/E multiple and Gordon Growth and assume equal weighting.
Combined value Vc = (Forward P/E ratio x 33.33%) + (DCF x 33.33%) + (Gordon Model x 33.33%)
Vc = $109.89 x 33.33% + $97.49 x 33.33% + $109.09 x 33.33%
= $105.48 per share
Therefore, combined value shows that the firm’s stock is overpriced at $116 and $109.12 per share on February 24 and January 31, 2012 respectively.
Market competition from John Deer & Company
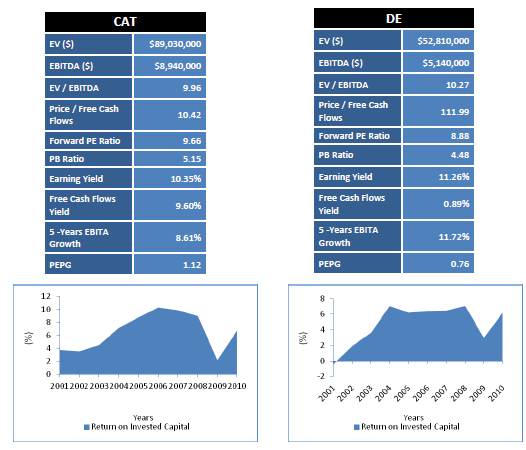
CAT has several competitors in almost all the business segments it operates. Its main competitor across the entire zones includes mainly the John Deer & Company, CNH Global N.V, Komatsu ltd, and AB Volvo Construction Company. These companies deal with specialities offered by the principal rival CAT. Thought CAT has been dominating this industry for over a century now, this is the entire period of 175 year since John Deer inception. In fact, competitors have been lagging behind in almost all facets of their business sectors. However, John Deer Company is currently in hot pursuit, the company is restructuring its services by formulation of ways to help it attract more investors who will be expected to drive it into higher heights. This posse a real threat to CAT because other companies are also finding ways of controlling the market share in agriculture and forestry equipments, when these forces are combined the aftermath would be too strong for CAT to bear despite its current take in market share that largely depends on its historical perception and investments. John Deer Company has strong ties in the business most developing industries are using their building products are loyal to their brand items, which they have continued to cherish to-date. This is the main strength and driving force for its competitiveness. Competition within the industry has made these two adopt new novel scientific approaches to expand their market share and even gain advantage against their competitors. Some of the issues that make the brand competitive include durability of their products with easily available spares across the globe at an affordable price. This has given the company an upper hand in taking a competitive lead in the market share close to CAT (Alpha 2011). However, John Deer has a strong mechanism of maximizing the shareholders value; this is partly attributed to its resourceful human resource. This gives it a competitive advantage that translates into creation of superior values. However, their main strength lies with their ability to maintain debts levels, which they consider a prudent approach based on their cash flow, interest coverage ratios, and percent of debt to capital. John Deer uses debt financial information in lowering its capital cost. This has a positive effect of increasing their returns on shareowners’ equity. The aftermath is an exposure of the company to adverse rates of interest change. Replication of these approaches across its entire operating zones has seen it acquire more wealth and attract more investors year-in year-out.
Net asset value evaluation
Evaluation of its Net Asset Value (NAV) gives a more inferior value than what is available in the CAT. The current Value per share = $467 million earns every shareholder up to $ 1.52 per share this is an increase from $ 1.16 for the 2010 financial year. Though this is far less than the scenario in the CAT the entire figure translates to a more net gain when compounded together with values from other competitors (Sify finance 2008).
The firm’s market capitalization stands at a range of $30.3 to $35.4 billion. When this is compared with NAV of $76 Billion for CAT, the NAV is lower than the market capitalization by $ 20 billion, this is as a result the present value of assets which is different from figures in the balance sheet for determining the NAV, these also depends on historical perception. This NAV shows Deer current liabilities and assets position. This trend is similar to the situation at CAT where an investor may deem that the firm has a sound progressive growth potential, this paves the road for these clients to be in a position of injecting more cash than for its NAV. Since both the market capitalization and NAV is higher in CAT than Deer, then CAT is more profitable and can be able to survive in the future. This does not rule out the progressive nature of Deer as shown above from the past ten years financial data (Alpha 2011; Sify finance 2008).
Market debt equity:
- Debts to equity ratio (DER)
- Debt to equity = Long term (LT) debts + Current portion of the (LT) debt / Total Shareholder Equity.
- DER = leverage ratio that indicates proportions of shareholders equity as well as debts that the firm used in financing its assets.
- DER = (52,980,000 + 53,673,112)/102,702,301
= 1.038
- Maximum DER ratio for the past 10 years = 1.7753
- Minimum DER ratio for the past 10 years = 0.8025
Analysis of the past 10 years DER shows that shareholders did not claim the assets of the company and this is the reason why the ratio of debts to equity is has gone up. This means that the Company is aggressively financing its growth from debts, which brings about volatile returns to its shareholders currently standing at $ 1.52 per shares. The company acquires less assets, the shareholding dragged their feet in making big money investments because annual selling of shares ensures the ratio to be high (Alpha 2011). Contrary, when this ratio is low then it means that the firm is using its resources to pay debts and therefore little returns to shareholders. In the past 12 months, the scenario is not very different even though the current figure is the highest. This does not mean there any change in its front (Wang 2009).
- Price/earnings ratio
- P/E ratio = Share price per share/ Earnings per share (EPS)
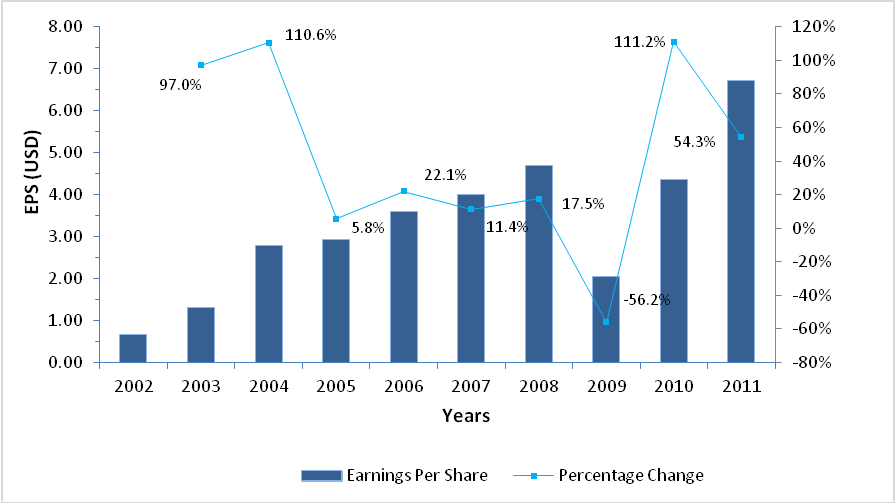
In this context EPS ratio indicates the amount shareholders expect to generate as earnings for every share invested in the Deer Company. From this it would be possible to assess the profitability of the company on a per share basis (Finance yahoo, DE 2012). The Deer has been having unpredicted growth for the past 10 years as shown in the figure below. Prediction is that the firm EPS will grow by 15.2%, for this case let us take the average growth of 50% which is a likely phenomenon with Deer 50 % [(15.2% + 34.8%)/2 = 50%]. Thus, the firm’s EPS for the 2012 beyond March will be $0.44 ($1.52 x 30.2%=$10.11). This means that for every share invested in the Deer Company, will generate $10.11 of the firm’s earnings. Also based on CNBC (2012) the forward looking P/E is x 6.7 this means that the share price after one year most probably in March, will be around $67.74 (10.11 x 6.7 = $67.74). This shows a positive trend of Deer in its shareholding business (Finance yahoo, DE 2012).
Forward P/E ratio = $67.74 / $1.52
= x6.70
While using trailing EPS of $3.49 and share price as at March 18th 2012 of $1.52, the trailing P/E ratio will be 18.96 times ($1.52/$3.49= 0.4355).
The firm’s trailing P/E multiple indicates that Deer company stock, at a share price of $48.95, was dealing at 0.4355 times the firm’s net EPS of $3.49. While the forward P/E multiple indicates that at a price of about $67.74 the firm will be dealing at x6.7 the company’s net EPS of $1.52. This implies that an investor would be parting with $ 0.4355 or $6.7 for each dollar on John Deer earnings.
When these two rival companies are compared with their competitors in forestry and agricultural segment with market capitalization of more than $40 billion it is true that both Deer and CAT has a high P/E ratio. A share with superior P/E ratio proposes to the investors that they should anticipating superior returns growth compared with the general market, this is the reason most investors put their cash for today’s returns in expectation of an increase in future earnings. CAT Company tends to attract more investors than the Deer because it has strong mechanisms of evaluating risks for their assets in the market. Therefore, these shares are referred to as growth stocks. On the other hand, a share having low P/E proposes that the investors have reserved anticipations for returns increase in future compared with the general market. Therefore, both CAT and Deer can be classified as growth stock and can only attract growth investors who view such a stock as an attractive buy (Wang 2009).
Discounted Cash Flow (DCF)
John Deer value has been on an upward trend for the past decade as shown by the PE figure above. Financial records show that the net profit value stands at figures that give more confident to the investors because their values keep gaining momentum with time, although the company have once or twice experienced volatile returns. Analysis of the unlevered free cash for the past 10 years gives a maximum of $459 million, while the terminal value at current financial year is $312 million. The discount rate is 1.9%, this shows a clear indication of the firm expected growth in the financial year 2012 in which its operating profit will increase by (6-12)% from $257 million to $890 million. If we assume the increase is by 12%, then the company can still increase its investments from savings from the production segments. Forecast of the past financial years cash flows is best attained by consideration of their changing trends and critical evaluation of factors attributed to these. Analysis of the cash flow to the firm shows that the capital expenditure, working capital, and D & A influence the business in a projected dimension. When these values are deducted from the total cash flows to obtain Free Cash Flow (FCF), the FCF is then discounted at the owners’ required return rate to obtain the equity value. Since the company has been on a progressive attempt in perpetuating, the value of equity will be represented as shown below:
- Value of Equity = Free Cash Flow/Discount rate
- Present value (PV) of perpetuity = FCF x 1/discount rate
- PV = 425 million x (1/discount rate)
If we assume the total equity for 2007 was $358 million then the required return of 12% the firm will raise its share repurchase to more than almost 1 billion. This will raise the dividends to $2.17 for every share, which is an increase of 42%.
PV = 425 million x (1/12%)
= $3541 million
Value per share = $3541/1632
= $2.17 per share
The values obtained from the analysis indicate that the firm’s DER is struggling to catch CAT; its attempt in the shareholding is promising, they have mechanisms of helping investors predict any future volatility in their share earnings. This has build confident in investments, which is currently gaining momentum with time.
Conclusion
In general, CAT is in the growth stage, which makes it good for long-term investment. The firm has been performing well year-after-year with an increase in its earnings. The firm rewards its shareholders using dividends which increases every year and share repurchases, but currently it is not buying back any share even though it still has a repurchase program. Therefore, the firm’s share price will keep on increasing each and every time. From the valuation, the firm is overpriced which means that it is selling at a premium; thus, anyone willing to add value to his/her portfolio will not buy more of CAT’s stock rather one should aim to sell instead. On the other hand, an investor seeking a growth stock will go for CAT’s stock as it is promising more growth and an increase in shareholders’ value in the future. Therefore, growth investor may buy this stock for long-term investment expecting more share repurchases and more dividends.
Reference List
Alpha, S., 2011. Head to Head Battle: Caterpillar Inc. vs. Deere & Company. Web.
Bern, M., 2012. Caterpillar still has room to grow. Web.
Caterpillar, 2012. Caterpillar: Stock Information: Dividend History. Web.
CNBC. CNBC: Caterpillar Inc 2012. Web.
Dividend.com, 2012. Dividend.com: Caterpillar Inc. (CAT). Web.
Dividend Monk, 2011. Dividend Monk: The 5 largest dividend holdings of the Gates Foundation. Web.
eDividendStocks.com, 2011. eDividendStocks.com: Caterpillar raises dividend for 18th consecutive year. Web.
Finance.yahoo.com, 2012a. Finance.yahoo.com: Caterpillar, Inc common stock (CAT). Web.
Finance.yahoo.com, 2012b. Finance.yahoo.com; Deere & Company Common Stock (DE). Web.
FNNO Staff, 2011. FNNO Staff: Caterpillar extends current stock buyback program, does not currently plan buys (CAT). Web.
Jayson, S., 2012. Here’s why Caterpillar is earning so much for you. Web.
Knight, S., 2012. Why Caterpillar is a better long-term portfolio choice than Agco Corp. Web.
Macabacus, 2012. Discounted cash flow analysis. Web.
Merola, R., 2012. Caterpillar still has room to run after early 2012 rally. Web.
Morningstar.com, 2012. Morningstar.com: Caterpillar Inc. (CAT). Web.
NASDAQ, 2012. NASDAQ: Caterpillar, Inc. (CAT) Dividend History. Web.
Secondventure.com, 2011. Secondventure.com: Business Valuation methods 2011. Web.
Sify Finance, 2008. Sify Finance: What is Net Asset Value. Web.
Takeover Analyst, 2012. Takeover Analyst: Why I’m still bullish on caterpillar. Web.
Value Based Management.net, 2011. Value Based Management.net: Market Value Added- MVA. Web.
Wang, J., 2009. Dividend Growth Model. Web.
Wilcox, G., 2011. These stocks may be better than their Dow equivalents. Web.