Company background
Smart Buy CO., Inc. is an online retailing company that specializes in selling consumer electronics. As such, its target market is mainly made of online shoppers shopping for everyday use electronic equipments, gadgets and devices e.g. PCs, flat screen TVs, smart phones, camcorders, digital cameras etc. To build an attractive product catalogue the company obtains its merchandise from established consumer electronic manufacturing brands such as Sony, HP, Apple, Dell, Nec, JVC, etc. The various products are posted on the company’s online store where they are viewed by interested online shoppers. If a shopper is interested in a particular product or products, he or she pays for it or them using acceptable payment methods and Smart Buy ships the product to the address the customer gives.
Smart Buy’s business process in general
Smart Buy as mentioned above is a retail company as such its business process is centred on eight key areas. The first area is supply chain management, which ensures that customers receive merchandise at the right time and in the proper condition. The second area is warehouse management, which ensures that the company’s inventory is properly controlled and managed. Proper warehouse management is a major component of a robust supply chain. The third area is order processing, which ensures that orders made to the company are properly serviced. The fourth area is business intelligence, which ensures that the company uses existing raw data to improve its operations and service delivery.
The fifth area is performance management, which ensures that the company’s goals are being achieved in a manner that is effective and efficient. The sixth area is customer relationship management, which ensures that the company’s interaction with its current and future customers is modelled in such a way that it is in synchrony with sales, marketing, technical support and with customer service. The seventh area is business process automation, which ensures that the company’s expenditure and operational costs are reduced through automation of certain manual tasks. The eighth key area is brand management, which ensures that there is brand awareness and recognition for its brand.
In its business operations, there is an outstanding need for Smart Buy to transform the various data it acquires from different sources into reliable and useful information. In place at Smart Buy, is a robust relational database (RD) that drives its online store website.
This RD ensures a seamless flow of data. Business looks promising for Smart Buy, however, competition is getting stiffer by the day as new competitors emerge and as existing competitors up their game. To gain a competitive advantage over its competitors, this paper proposes to Smart Buy that it creates a data warehouse based on its existing RD and infrastructure. The motivation for this proposal is that a data warehouse will enable Smart Buy to optimally exploit the potential of business intelligence (BI) in boosting its sales and on cutting down unnecessary expenditure.
Relational database
The relational database model inherently supports dynamism, which is a fundamental feature in systems that support transformation of data into information. Of the model, Goessl asserts, “establishing a relational database management system is a great way to increase data integrity, efficiency, ask questions, sort and filter data, provide stronger security, and share information (2009, para. 3).
The model achieves this by allowing for the creation of logical relationships among normalized tables. Thomas asserts, “The ability to bring connections within a database to the surface makes the data within even more valuable” (2013, para. 2). The outstanding benefit of RDs is that they enhance data integrity. They achieve this mainly through allowing for data cross-referencing and elimination of duplicate data. As such, not only do well-designed RDs improve the management of business data they additionally facilitate informed and correct decision-making in a business environment (Goeesl, 2009, para. 2 – para. 3).
Data Warehousing
The commonly adopted definition of a data warehouse (DW) is “a subject-oriented, integrated, time-varying, non-volatile collection of data in support of the management’s decision-making process” (Inmon, 2005, p. 32). DWs present enterprises and organizations with a number of benefits. One of these benefits that is of particular interest to this paper is that they enhance BI. The Data Warehouse Institute asserts, “A data warehouse (DW) is the foundation for a successful BI program” (2013, para. 1). Business intelligence refers to software used in analyzing an organization’s raw data in the aim of generating useful information from it.
DWs provide managers and executives in an organization with data from multiple sources. Business intelligence processes analyze these data and generate useful information from it. Therefore, the managers and executives are able to improve their decision-making. In addition to this, the arrangement provides an organization with cost-cutting benefits and an ability to identify new opportunities.
Another benefit of DWs that is of particular interest to this paper is they ability to generate a high ROI. A comparison between companies with and without DWs and their allied BI systems reveals that the former generate more revenue than the latter. An IDC published study on 62 European and American companies with DW sizes ranging from megabytes to over a tetrabyte revealed that the ROI range is between -1857% and +16000 (TechTarget, 2013, para. 15).
Furthermore, the average ROI over a three year period is 401% and the average payback period is 2.3 years (TechTarget, 2013, para. 16 – para, 17). These values illustrate the potential that DWs and their allied BI systems possess. A negative ROI is possible when a DW, first, has an extraordinarily high cost, second, has a greater range of coverage which extends its payback period and third, is under utilized. The general conclusion of the study is that not only do DWs improve the financial performance of a business organization they additionally generate a high ROI (TechTarget, 2013, para. 22).
Another benefit of DWs is that they are time saving and efficient. The holding of data in a single repository makes retrieval of data from a DW fast in comparison with individual retrieval from its multiple sources. This aspect makes them time saving. Another benefit of DW is enhancing the quality and consistency of data. Data standardization is a basic requirement in DW design. The standardization improves the accuracy of the data in a DW and consequently its quality and consistency. Accurate data are essential in better decision-making. Provision of historical intelligence is the other benefit of DWs. In a DW, historical data is stored chronologically or in a time series manner. This attribute enables it to be used in making useful forecasts and predictions of the future. This particular benefit is what makes DWs different and superior to classical TDs.
Database Schema
The database schema for Smart Buy’s RD is shown in appendix A. The schema has 6 relations and 4 views. The relations are Product, Customer, Purchase, Supplier, Supply, and Order. The views are Supplier, Outstanding orders, Units remaining and Purchases&Product category. The Product relation holds the details of the products on sale at Smart Buy’s online store. The Customer relation holds the details of the customers who make purchases.
The Purchase relation holds the details of the purchases made. The Supplier relation holds the details of the different suppliers who supply electronic products to Smart Buy. The Supply relation holds the details of the supplies made to Smart Buy by the various suppliers. The Order relation holds the details of the various orders made to Smart Buy. The Supply view provides a list of the items a supplier supplies to Smart Buy.
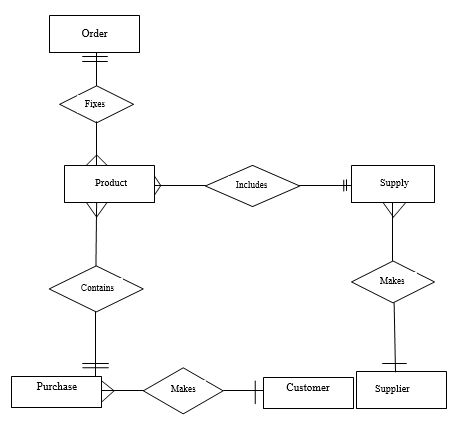
The Outstanding Orders view gives a list of the orders awaiting processing. The Product remaining view gives a list of the units remaining for a particular product. The Purchases&Product category view gives a list of the purchases made for a particular product category in a given period e.g. laptop PC sales for the last month. The relationship between these relations is shown by the level 1 E-R diagram in appendix A.
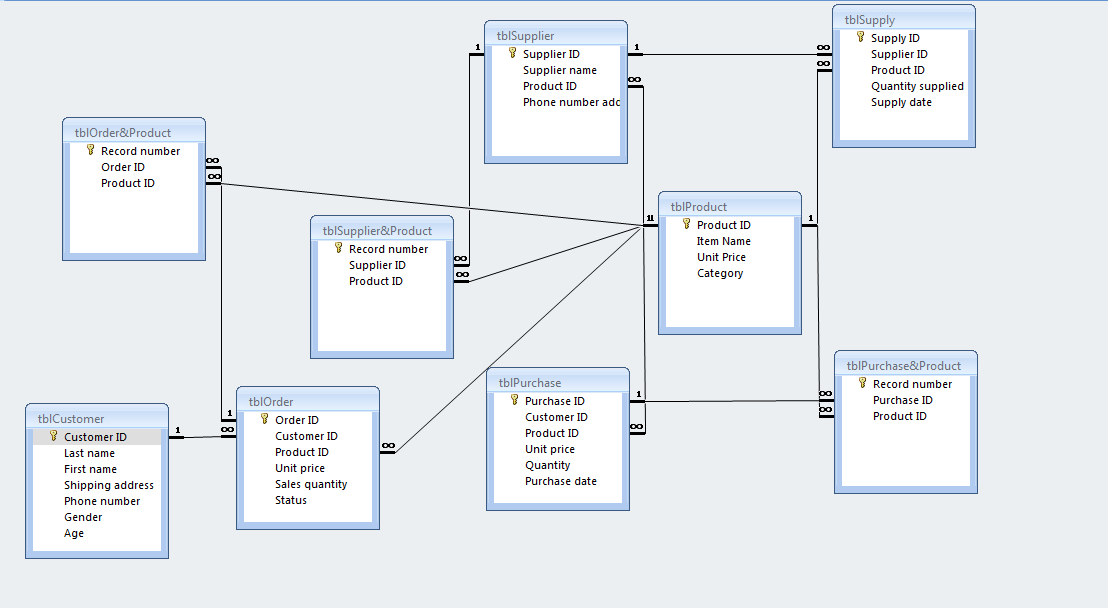
A total of 9 tables are created from the schema in appendix A. They are named according to the LNC naming convention. The tables together with their PKs and FKs are shown in the figure in appendix B. There are three junction tables (JTs) in the database namely, tblProduct&Order, tblSupplier&Products and tblPurchase&Product. The tblProduct&Order junction table breaks the many-to-many relationship that exists between tblProduct and tblOrder.
The tblSupplier&Product junction table breaks the many-to-many relationship that exists between tbl Supplier and tblProduct. The tblPurchase&Product junction table breaks the many-to-many relationship that exists between tblPurchase and tblProduct. Referential integrity is of vital importance to the database. To achieve referential integrity in this database non-null FK values are going to be set to match with existing PK values through the use of a RDBMS.
These 9 tables are normalized to the third normal form thus they do not exhibit repeating groups, functional dependencies and transitive dependencies. The normalization to this extent is done to eliminate three common anomalies associated with poor RD design, namely, modification, insertion and deletion anomaly. The first anomaly results in erroneous data in the relational database due to lack of consistency in modification of the data. The second anomaly results in an inability to enter new and needed data into the RD due to incorrect fields and faulty relationships among the database’s relations. The third anomaly results in the unwanted loss of needed data through deletion due to poorly constructed relations. The normalization additionally guarantees the future growth as well as expansion of the RD.
E-R Diagram
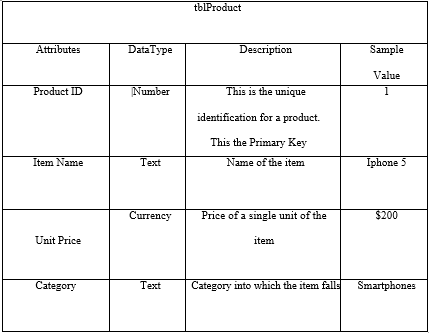
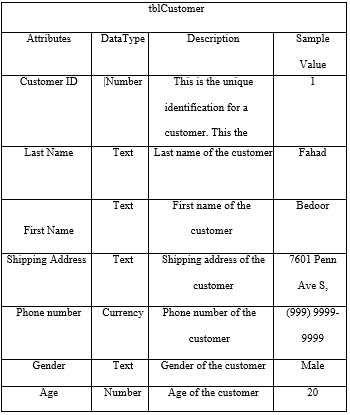
The E-R diagram for the database is shown in appendix B. Due to the three JTs, all the relationships in the E-R diagram are one-to-many. That is, one record in one table relates to many records in its related table The data dictionary in appendix C gives a description of the fields in the tables.
DFD
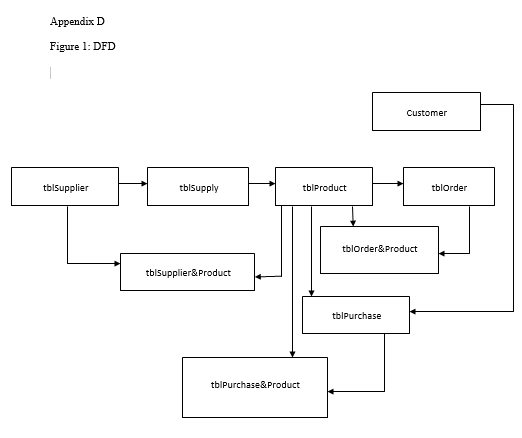
The DFD relating the tables in this database is a physical DFD, which means that it is implementation-dependent. This is true because referential integrity, which dictates the data flow, is effected during the implementation stage of the database through a RDBMS. The DFD is shown in appendix D.
References
Goessl, L. (2009). Business advantages of a relational database. Web.
Inmon, W. (2005). Building the Data Warehouse (4th ed). Indianapolis : Wiley Publishing.
TechTarget. (2013). The IDC data warehousing ROI study: An analysis. Web.
The Data Warehouse Intitute. (2013). Data warehousing. Web.
Thomas, J. (2013). What are the advantages of relational databases. Web.
Appendix
Appendix A
Database schema
Product (product code, item, unit price, category)
Customer (customer identification, customer name, shipping address, phone number, gender, age)
Purchase (purchase code, purchaser, item, unit price, quantity, purchase date)
Supplier (supplier identification, name, item, phone number, address)
Supply (supply code, supplier name, item, quantity supplied, supply date)
Order (order code, item, quantity, unit price, sales quantity, order date, customer name, status)
Supplier (name, item)
Outstanding orders (Customer name, item, sales quantity, phone number address)
Product remaining (item, units remaining)
Purchases&Product category (item, unit price, quantity bought, total price)
List of Abbreviations
- BI…………………. Business intelligence
- E-R……………….. Entity-Relationship
- FK………………… Foreign Key
- JT…………………. Junction Tables
- RD………………… Relational Database
- DFD………………. Data Flow Diagram
- DW……………….. Data Warehouse
- LNC………………. Leszynski Naming Convention
- TD………………… Transactional Database
- PK………………… Primary key
- RDBMS…………… Relational Database Management System
- ROI……………….. Return On Investment
Appendix B
Appendix C
