Research for quantitative research and methodology
Introduction
Understanding the factors that lead to increased or decreased birth rates across the world is key to implementing development agenda. Research demonstrates that a country’s birth rate could have an impact on the future development path of that country. If a country has women with high birth rates, then that the country could have high population that could imply adequate workforce for economic activities.
However, that can only happen provided that children who are born are provided with quality health care. Quality health care could go a long way in ensuring that a country’s population is healthy and active in local and national development activities (Ooi, and Kai 30). On the other hand, a country with low birth rates could imply that the country would face labour challenges in the future. Therefore, countries have always tried to balance their economic developments and birth rates.
Quantitative research methods involve the collection and analysis of data in the form of numbers (Creswell et al. 210). The methods have found much application in social sciences because they are used to test hypotheses in research studies.
The research methods could also be used to do further analysis of data obtained through qualitative research methods (Östlund et al. 380). Empirical methods are being used in the field of international entrepreneurship (IE) as researchers attempt to gain insight into the relatively new field of study (Coviello and Marian 490).
Research also demonstrates that IE researchers need to utilise coherent and thorough methodological approaches to make the field grow sustainably in the future (Yang, Xuehua and Chenting 613). This would call for more rigour and less tendency towards simplicity. Researchers could design their projects with aspects of pluralism that could accommodate methods that capture the dynamic aspects in IE.
Differences between research questions and hypotheses
The project answered the following research question: What is the impact of infant mortality rates, GDP, percentage urbanisation and rates of female unemployment on global birth rates?
The research question was developed to determine whether global birth rates were influenced by GDP, infant mortality rates, percentage urbanisation and rates of female unemployment. The research began with the research process of identifying the above research question. Research questions are formulated when a research gap exists in a particular research area. Research questions are formulated because researchers understand the boundary between what is known and what is not known.
The project adopted one research question because it could be answered through one study and over the period of time available for research. The research question was developed at the initial stage of the project development. The project adopted only one question to reduce the complexities that accompany study designs and use of statistical tools for data analysis.
Studies that use many research questions involve very complex designs and analyses. The above research question contains the population and circumstantial factors that were studied. The global population was studied to understand the dynamics of birth rates in relation to female unemployment, GDP, urbanisation and infant mortality rates.
The dependent variable in this research question is birth rates while the independent variables are infant mortality rate, percentage of urban population, GDP and female unemployment. It would be expected that the dependent variable would be affected by the independent variables either positively or negatively.
For example, if the rate of female unemployment is high it would be expected that the global birth rate would also be high because women would be doing less in formal employment. More females would be married and bearing more children than those females who would be in formal employment.
On the other hand, the research project used the following research hypothesis: There is no relationship between global birth rate and the rate of female unemployment, percentage urbanisation, infant mortality rate and GDP.
The above statement was clear and testable, and it was not worded in a question format like the research question. The study hypothesis was not stated in the form of a question. The project adopted the concise hypothesis statement because it could be easily understood by others.
The hypothesis assumed that birth rates were not influenced by GDP, infant mortality rates, percentages of urbanisation and rates of female unemployment. The hypothesis was stated in the future and was tested through the statistical analysis used in the project. The above research hypothesis was a null hypothesis which the project aimed at testing to determine the statistical differences between predicted relationships.
Difference between a correlation and a relationship
A correlation is more specific (bivariate) than a relationship which is a general association of two or more variables. Correlation is one way of testing relationships between two or more variables. A relationship is an attribute that associates two or more variables in a certain order while a correlation describes the extent to which two variables vary together. Correlations could have positive relationships or negative relationships. In addition, there could be zero correlation when none of the variables changes.
Rationale and hypothesis
The research had the following rationale:
- The study aimed at finding the current birth rate figures across the world.
- The study aimed at associating birth rates with urbanisation, GDP, female unemployment and infant mortality rates.
- The research attempted to understand the global trends in birth rates.
Various countries across the world have different bodies for collecting data on birth rates. The United Nations has an agency for coordinating the collection and analysis of data on birth rates across the world. Various factors have been suggested to influence the birth rates across the world.
Female unemployment, urbanisation, GDP and infant mortality rates are among the factors that have been suggested to have influence on global birth rates. The study hypothesised that there was no relationship between the above factors and global birth rates.
Scope of the project and dataset selection
The concluded research was comparative. The research was conducted to determine the impact of GDP, infant mortality rate, urbanisation and female unemployment on global birth rates in 2010. The research used data from 10 countries randomly selected across the world (n = 50).
The sampling of the countries went a long way in ensuring that the research achieved its goal of getting a cross-sectional view of global birth rates. The fact that only 50 countries out of more than 250 countries were selected implies that the selection of the countries was limited.
There were a number of factors that led to selection of countries. For example, a good number of countries were lacking key data entries that were essential for analysis. Therefore, the research was explorative in nature, and the selection of the countries is too limited to offer a thorough representation of countries across the world. Statistical power of a study is mainly dependent on the sample size used. Big sample sizes for studies lead to more statistical power than studies with small sample sizes.
The study used three data sets obtained from United Nations repository of data, International Monetary Fund (IMF) and statistics and open government data. Birth rate and infant mortality data were obtained from United Nations repository of data.
GDP data were accessed from the International Monetary Fund (IMF) and statistics while the provided crucial data on the dynamics of birth rates across the United Kingdom. Data were accessed from the said websites and entered in a Microsoft Excel file for subsequent statistical analysis.
Data analysis was done using GraphPad Prism statistical software. Results were presented and discussed. The discussion section analysed the implications of the statistical results in the study. The interpretation of the statistical findings went a long way in understanding the relationships between the independent variables and the dependent variable.
The results interpretation in any study is crucial in rejecting or accepting the null hypothesis. The null hypothesis is accepted when the statistical findings show insignificant differences. On the other hand, null hypothesis is rejected when statistical results show significant differences among variables under investigation. In such circumstances, the alternative hypothesis is accepted.
Statistical methodology
The independent variables were GDP, rates of female unemployment, percentages of urbanisation and infant mortality rates while the dependent variable was birth rates. The research study variables were selected following rules and suggestions from previous theories and conceptual models. To ensure that the study variables were consistent with the hypothesis, they were aligned with past studies and feasibility.
From the literature review, female unemployment, GDP, percentages of urbanisation and infant mortality rates were among the factors that were found to have an influence on global birth rates. The study utilised quantitative data which were in the form of numbers. It has been demonstrated that high numbers in quantitative form of data have some statistical importance which is interpreted to explain study findings. The study viewed the independent variables as the study factors assumed to have an influence on the dependent variable.
In the case of this study, the independent variables were not manipulated, but they were recorded because the data were already collected. The dependent variable in this study was presumed to change based on the changes observed in the independent variables. The study variables selection went a long way in ensuring that the study was not biased and that it did not have confounding factors. Studies that have confounding factors and biases cannot be used to infer about the population from which a sample is taken (Malterud 485).
The study hypothesis was developed following suggestions proposed in previous studies. The previous studies which addressed the choice of hypotheses for various studies used and analysed different theories in science (Baxter and Susan 544; Holosko 670; Kochhar and Parthiban 75).
Some of the theories have been tested and verified to be useful in the scientific process of developing hypotheses for studies. On the other hand, some theories on hypothesis development have raised concerns in the scientific community. As a result, the controversial theories are rarely used to develop hypotheses in studies because they could result in biased study findings and conclusion.
Interpretation and conclusion
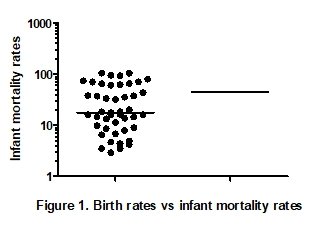
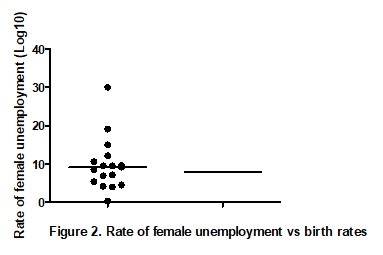
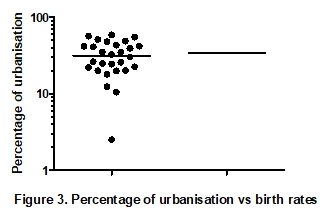
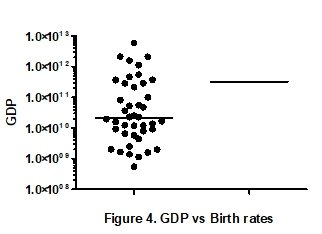
The relationship between the variables in the study was analysed using linear regression tests. Regression analysis tests do not assume that the independent variables are related to the dependent variables in a study (Östlund et al. 370; Bachmann et al. 1128). They yield a line of relation that could be used to formulate a formula for establishing further relationships between variables (Preacher et al. 440). The statistical analysis was performed using GraphPad statistical software. The results are shown in the following figures:


The regression analysis results for comparison between birth rates and infant mortality rates showed that the relationship was significant (R square= 0.8880, P <0.0001, DFn and DFd = 1.000 and 43.000). The results indicated that the slope for the best-fit values was 2.437 (+ or -) 0.1320 while the slope for the confidence interval was 2.171 to 2.704. The number of countries analysed for the relationship was 45 (n= 45).
The linear regression analysis results comparing birth rates and rate of female unemployment showed that the relationship was not statistically significant (R square = 0.8612, P = 0.2430, Sy.x = 6.751, DFn and DFd = 1.000 and 15.00). Slope values for the 95% confidence intervals were 0.7235 to 0.2053. It was shown that a total of 32 values for both the variables were missing.
The relationship between birth rates and the percentages of urbanisation was not significant (P =0.0607, R square = 0.1288, Sy.x = 14.06, and DFn and DFd = 1.000 and 26.00). The slope values for the 95% confidence intervals were -02030 to 0.8562. It was demonstrated that a total of 21 values for the independent variable were missing.
The regression analysis results for the comparison between birth rates and GDP showed that the relationship was not statistically significant (P = 0.3766, R square = 0.0210, Sy.x = 1.039e+012, and DFn and DFd = 1.000 and 39.00). Slope value for the best-fit parameters was -177e+010 (+-) 1.316e+010 while the slope for the 95% confidence interviews were -3.84+010 to 1.486+010. The number of values missing for the GDP variable were 9 (41 values were analysed against values for the dependent variable).
The results obtained were within the 95% confidence intervals. The overall results showed that only one factor could be influencing the outcome variable. The relationship between the infant mortality rates and birth rates was significant. The findings were crucial because they showed that the two variables were significantly related. The results indicated that birth rates were higher in countries which had high cases of infant mortality.
The implication could be that many women were giving birth (per 1000 persons in the population), but many infants were dying. The high rates of death among infants could be attributed to several factors. Countries which have poor health care systems have been shown to have high cases of infant mortality.
Components of the health care system that could be contributing to the high mortality rates could be poor maternal care, inadequate health care facilities, and unqualified health care personnel, among others. The results are important for public health personnel and policymakers because they could be used to reverse the high infant mortality trends (Heron and Betzaida 1).
The other three factors were thought to have influence on global birth rates were shown to have no statistical significance on the dependent variable. The linear regression analysis results obtained for GDP, percentage urbanisation and rates of female unemployment showed that the factors had no significant variability. The variations were assessed by determining whether the slopes obtained were significantly non-zero.
Many values for both the independent variables and dependent variable were found to be outliers. Outliers in statistical analysis could lead to bias in study findings. To avoid biased study findings, the values found to lie outside the normal limits were manipulated to ensure that they were within the limits of statistical analysis. Research also demonstrates that too much manipulation could introduce bias in study findings (Yang et al. 610).
The study was limited because it was demonstrated that there were several values missing for the independent variables and dependent variable. The missing values implied that some countries did not have entries for some factors. The missing values could have contributed bias in the study findings.
Future research studies should aim at using countries with all data values. It could also be recommended that future studies increase the sample size to prevent errors associated with small sample sizes. The study used data from 50 countries (n = 50) from a population of 255 countries across the world. In addition, research studies in the future should use more statistical tests than those used in this study. Many tests will go a long way in ensuring that the studies will be more complex and powerful than the current study.
Works Cited
Bachmann, Lucas M., et al. “Sample sizes of studies on diagnostic accuracy: literature survey.” BMJ 332.7550 (2006): 1127-1129. Print.
Baxter, Pamela, and Susan Jack. “Qualitative case study methodology: Study design and implementation for novice researchers.” The Qualitative Report 13.4 (2008): 544-559. Print.
Coviello, Nicole E., and Marian V. Jones. “Methodological issues in international entrepreneurship research.” Journal of Business Venturing 19.4 (2004): 485-508. Print.
Creswell, John W., et al. “Advanced mixed methods research designs.” Handbook of mixed methods in social and behavioral research 2.1 (2003): 209-240. Print.
Heron, Melonie, and Betzaida Tejada-Vera. “Deaths: leading causes for 2005.” National vital statistics reports: from the Centers for Disease Control and Prevention, National Center for Health Statistics, National Vital Statistics System 58.8 (2009): 1. Print.
Holosko, Michael J. “What Types of Designs are We Using in Social Work Research and Evaluation?.” Research on Social Work Practice 20.6 (2010): 665-673. Print.
Kochhar, Rahul, and Parthiban David. “Institutional investors and firm innovation: A test of competing hypotheses.” Strategic Management Journal 17.1 (1996): 73-84. Print.
Malterud, Kirsti. “Qualitative research: standards, challenges, and guidelines.” The lancet 358.9280 (2001): 483-488. Print.
Ooi, Giok Ling, and Kai Hong Phua. “Urbanization and slum formation.” Journal of Urban Health 84.1 (2007): 27-34. Print.
Östlund, Ulrika, et al. “Combining qualitative and quantitative research within mixed method research designs: A methodological review.” International journal of nursing studies 48.3 (2011): 369-383. Print.
Preacher, Kristopher J., Patrick J. Curran, and Daniel J. Bauer. “Computational tools for probing interactions in multiple linear regression, multilevel modeling, and latent curve analysis.” Journal of Educational and Behavioral Statistics 31.4 (2006): 437-448. Print.
Yang, Zhilin, Xuehua Wang, and Chenting Su. “A review of research methodologies in international business.” International Business Review 15.6 (2006): 601-617. Print.