The analysis for the entry strategy of Domino Pizza is done for the town of Scotsdale, Missouri. The data for the analysis if derived from two sources – American Fact Finder and Bureau of Labor Statistics . We begin with an analysis of the demographic character of Scotsdale.
According to the 2010 census data, the total population of the town of Scotsdale is 222. The age-group wise division of the population shows that most of the population is above 20 and below 50 years and then 27% of the population is above 50 but less than 69 years old.
The median age of the city, is 42.5 years indicating that most of the people tend to be closer to the age 42 years. The male population is higher compared to the female population, as the male to female ratio is 27:28.
Table 1: Age group
The racial composition of the town is almost homogeneous with 99.55 of the population being white and the other 0.5% is American Indians. The total number of households of the town is 81 and 73 out of these are family households. The average household size in the city is 2.74. The median household income is $73,125.
Table 2: Household Income
The household income grouped together in two three categories demonstrate that the maximum number of households in the city belong to the income group of $35000 to $99000. Only 3 percent of the households are found with an income below $34000.
Regression Analysis
A regression analysis is conducted on the producer price index (PPI) of the US for pizza and PPI for soft drinks . The data are considered as the dependent variable for the products, while other variables such as per capital income, population, wages and salaries, and leading index are taken to be the independent variable. A regression analysis is done using MS Excel and the findings are reported below.
Table 3: regression analysis of price of Pizza
This regression analysis actually shows how the price of pizza is dependent on other independent variables such as income, leading index, salaries and wages, population of the area, etc. The analysis shows that the prices of pizzas are positively related to the income and population of the community. However, it shows a negative relation to the leading index and the salaries and wages. The regression equation derived from the analysis is – PPI of pizza = -1083.5 + 0.04 per capital Income + 0.03 Population – 3.76 leading Index – 0.002 salaries and wages.
The analysis shows that the demand for pizzas are directly related to the population size of the community and the per capital income of the community. If these two factors were increasing over time, it would be profitable to open a pizza business.
However, another factor requires attention, that is the demand for soft drinks as the business of pizza, and soft drinks are closely related to each other. This confirms that the price for pizzas are directly related to an increase in income and increase in population of the community, that confirms the demand laws which states that with increase in income demand increases which in turn increases price.
Table 4: Regression analysis of Soft drinks
The regression analysis of the PPI of soft drinks demonstrates that the price of soft drinks is positively related to the income and population of the community. It, like the PPI of pizzas, also has a negative relation with the leading index and the salaries and wages of the community. The regression equation derived from the analysis is PPI of Soft Drinks = -614.64 + 0.02 per capita income + 0.04 population – 1.51 leading index – 0.001 salaries and wages.
The analysis confirms that prices of commodities are positively related to the income of the community. Therefore, greater the income, greater is the chances of the product having higher demand in the area. Further, higher the population in the area, greater will be chances of success of the product.
In case of Scotsdale, Missouri, the only problem that Domino will face is its low population level of just 222 people. Thought the median household income of the city is much higher than the national average, but still low population presence in the city may be an area of concern for the company.
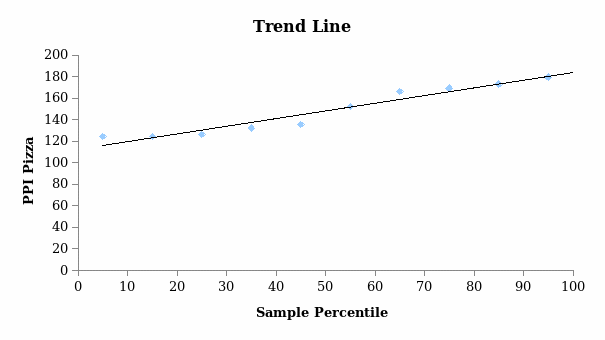
Table 5: Future trend

Table 5 demonstrates the trend line that shows the nature of demand, based on the regression analysis that the product will have in the community for the next 4 periods. Shows that the demand for pizzas are expected to rise, and the community is expected to develop over the years. This shows that the price for pizza is expected to rise, leading to an increase in the demand as this price increases with increasing income.
Based on the above forecast it can be safely deduced that Dominos may establish its outlet in Scotsdale.
References
Bureau of Labor Statistics. (2013). CPI. Retrieved from Bureau of Labor Statistics. Web.
United States Census Bureau. (2013). Scotsdale, Missouri. Web.