Corporate Analysis
Company Overview
Drake and Scull International PSJC (Drake and Scull) is a company established in 1966 in Abu Dhabi and has been working in the UAE’s construction industry since then. However, the company has also extended its operations across the globe and opened offices in Saudi Arabia, Egypt, Algeria, India, Europe, North Africa, and Qatar, etc. Drake and Scull offer construction services that include building, design, and management of commercial and industrial buildings, including water, and power construction facilities.
The company also works on the construction of infrastructure, oil, and gas supply pipelines, and facilities, including building and infrastructure development services for its international clients. Currently, it has more than 21,000 employees working in seven different countries. The competitor company selected for comparative analysis Arabtec Holding PSJC.
Objectives, Vision, & Mission
The principal objectives of Drake & Scull are as follows.
- To improve operational performances.
- To right-size its business by focusing on new clients.
- To complete its pending capital restructuring programs.
- To optimize the company’s value in the global market.
Other objectives of the company also include merging and integrating core functions and reduce bottom-line performance. The long-term strategic goal of Drake & Scull is to bridge the gap between design and construction management.
The vision of Drake & Scull is to become a market leader by capitalizing upon its brand values and traditions. The primary mission of Drake & Scull is to provide an integrated design in general contracting, deliver world-class projects, oil, and gas, infrastructure and rail, wastewater treatment, and supply of water through its inherent values. The three values of the company are innovation, people, and passion.
Business Environment
The PESTLE Analysis is used to identify the impact of different elements of the construction industry.
- Political. Since the formation of its alliance of seven states in 1971, the UAE enjoys an exceptional form of political stability. The government of the UAE invests a lot of money in the development of its infrastructure that gives a massive boost to the construction industry’s economy. Furthermore, the government’s “Strategic Plan 2015” has further enhanced the construction industry in the UAE as DH80 billion will be spent on infrastructure development.
- Economics. The economic situation of the UAE’s construction industry consistently fluctuates. For instance, the country’s financial growth rate dropped from 11% in 2006 to 5.2% in 2007. However, its recent Strategic Plan 2015 and Dubai Expo 2020 has again increased the economic growth of the country.
- Social. Socially, people are very satisfied with the UAE’s construction business. Society admires the infrastructure of the country. Both residents and non-residents are investing their money in buying newly constructed houses. Additionally, a zero-crime rate has further enhanced the value of infrastructure development in the UAE.
- Technology. The construction companies in the UAE construction industry have adopted new technologies and machinery. Many machine contractors are operating in the country. The companies are also using new designs and technologies in construction.
- Legal. The construction industry in the UAE faces several restrictive legal concerns. The companies working in the construction industry have to comply with governmental policies and rules by ensuring that they are constructing high-quality infrastructure. The government of the UAE can confiscate the license of a company if a construction firm fails to fulfill its legal requirements.
- Environment. The pollution level in the country is high due to significant infrastructure development. Initially, the government of the UAE was not interested in making policies to reduce pollution. However, the current government has urged construction firms to use green, environmentally friendly technology in construction. Many construction firms in the country are planning to design sustainable buildings to preserve the environment.
Porter’s Five Forces Model is implemented in the following to determine factors affecting the construction business.
- Bargaining power of buyers – moderate. The buying power of buyers is currently moderate due to the higher rates of real estate. The increase in housing prices and a decrease in the public’s income has increased the bargaining power of buyers. Additionally, buyers have an extensive range of options as there are many buildings available. Hence, construction firms have to fulfill the buyer’s power of bargaining.
- Bargaining power of supplier – low. There are innumerable suppliers of raw materials in the UAE. Hence, suppliers are not in a position to bargain. They have to offer raw materials on the rates demanded by constructors in the UAE. Furthermore, many Chinese firms/ suppliers have also entered the construction industry. Chinese suppliers are offering similar products and services at a much lower rate. As a result, the bargaining power of the supplier in the UAE has been considerably reduced.
- Threats of new entrants – low. Threats of new entrants are moderate as several new construction firms are entering the UAE due to a higher rate of profits. However, it is not easy for new entrants to do business in the construction industry as there are many well-known and highly reputed construction firms operating in the country. Furthermore, legal compliance, rules, and strategies in the UAE are severe. New firms can’t comply with these regulations. Moreover, a construction business in the UAE requires massive investment. Hence, a new firm cannot invest billions in the initial phase of business. For this reason, the threats of the new entrant are low in the entire region.
- Threats of substitutes – low. At present, there are no substitutes available in the region for real-estate business. People are obliged to buy properties for personal and professional use. They do not have any other option in the UAE. Therefore, there are no threats of substitutes in the UAE’s construction industry.
- The intensity of rivalry – high. The intensity of rivalry in the construction business of the UAE is high due to the reason that numerous companies are operating in the industry. Most importantly, each of these firms is determined to develop unique designs of buildings and mass transportation systems. In such a situation, it becomes multifaceted for established companies like Drake & Scull to maintain its value and prestige in the construction industry.
SWOT Analysis
Table 1: SWOT Analysis.
Six Sigma Analysis
The six-sigma analysis for Drake & Scull is provided below.
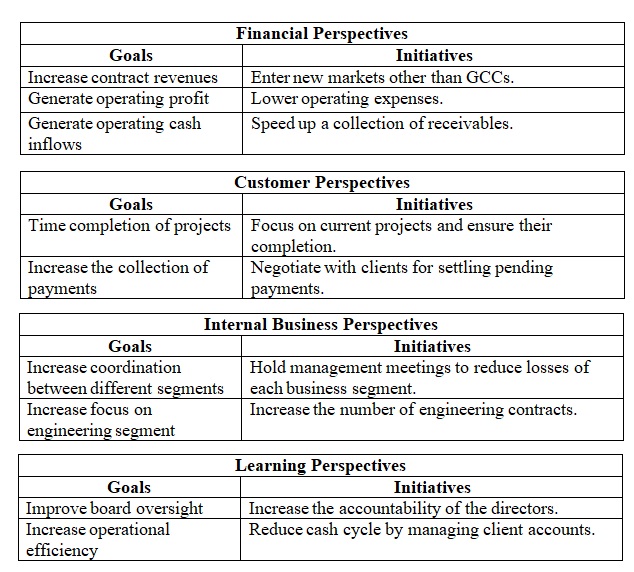
- Define. The goal of Drake & Scull is to diversify its project portfolio outside the UAE. The measures it has taken to achieve its objective are client retention, excellent delivery of services, and operational efficiency. The company also depends on its restructuring plan and remains consistent in its growth trajectory.
- Measure. The company measures its success through operational assessment tools that include cost analysis, market analysis, and financial performance reviews. Drake & Scull also focuses on MEP service providers in different target markets.
- Analyze. Drake & Skull remain active in looking for new opportunities in the global market to achieve its goal of universal expansion. The strategy of the company remains consistent, which is to analyze and shift its investments to obtain high profits.
- Improvement in liquidity. The short-term strategy of Drake & Skull is to improve its liquidity and working capital. The company also aims to reduce its debt level to improve its financial position. Furthermore, it contracts with financial advisors to analyze its liquidity and solvency positions and suggest improvements that may be required. The company also takes strategic initiatives to overcome external challenges.
- Control. The executive team of Drake and Scull make efforts to prove its global track record by determining the diverse knowledge and understanding of global corporate governance. The company has implemented several measures to strengthen its excellence and accountability to become efficient and linear.
Competitive Advantage
The construction business in the United Arab Emirates (UAE) is gaining a competitive advantage due to higher demand for a substantial investment. Many well-known firms started their business in this region. In this concern, Porter Five Forces analysis will help in identifying the strength of the construction business in the UAE by analyzing the significant threats of entrants and substitutes.

Financial Analysis
Horizontal Analysis
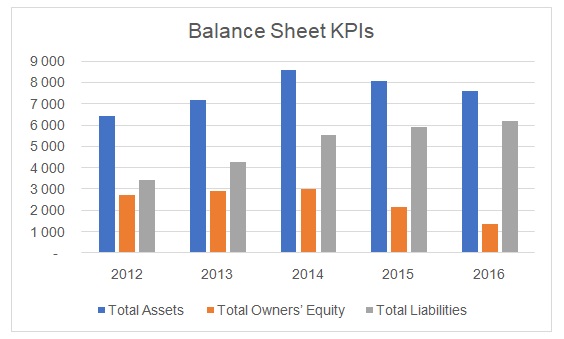
The horizontal analysis of the company’s consolidated balance sheet and income is attached to this report in Appendix A. The analysis indicates that the company’s book value declined in 2016 as its total assets were reduced. Major reductions were reported in the company’s cash and cash equivalent, short-term investments, property, plant and equipment, and intangible assets.
On the other hand, the company’s liabilities both short-term and long-term increased significantly in 2016. There was also a significant decline in the company’s retained earnings, which was due to the company’s net loss position in the last two years. The company faced challenging market conditions accompanied by the slowdown in the construction industry that affected its business in different markets.
Moreover, the company faced operational problems and capital structure. The management identified these problems in the annual report, and it plans to restructure the company’s organizational setup and capital structure to improve business efficiency and reduce its dependence on external debt.
Trend Analysis
Table 3 provided in the following indicates that the trends in the values of Key Performance Indicators (KPIs) during 2012-2016.
Table 3: Trend Analysis.
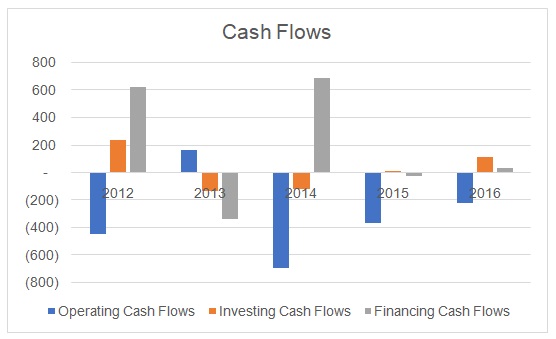
It could be noted that the company’s total assets, liabilities, and equity increased until 2014, and after that only liabilities continued to grow (See Figure 1). It implied that the company’s problems started in 2014, which resulted in the net loss in 2015 and 2016. There is a serious concern regarding the company’s inability to generate positive operating cash flows (See Figure 2). Moreover, a recent payment by Saudi ARAMCO was reported by the company that has been viewed with suspicion by analysts as it was delayed by almost two years.


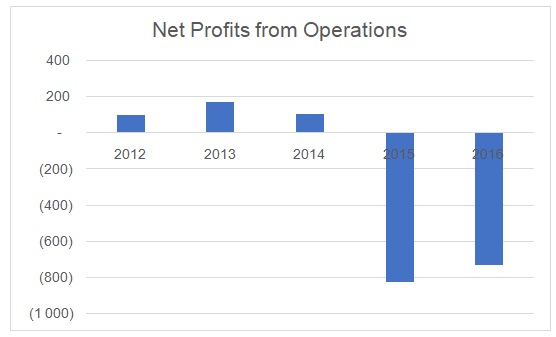
Furthermore, the management is attempting to inject new equity in the company by restructuring its capital structure that could affect its current shareholders, However, there are serious operational issues as there were delays in payment collection and the company was unable to secure new construction projects. The company’s market capitalization deteriorated in 2015 as its stock price hit the lowest level in the last five years (See Figure 3). Furthermore, the company reported a huge net loss in 2015 and 2016 (See Figure 4), which resulted in negative ROE and ROA values (See Figure 5).


Vertical Analysis
The vertical analysis of the company’s consolidated balance sheet and income is attached to this report in Appendix B. The analysis confirms that the company’s receivables were a significant proportion of total assets. It implied a poor collection of funds that resulted in negative operating cash flows. On the other hand, it could be indicated that the company depended heavily on external borrowing to finance its operations. The company could face a major liquidity problem as most of its debt is short-term and it has to settle its accounts in 2017.
Credit Analysis
Liquidity ratios. Table 4 indicates the values of the current ratio and quick ratio, which indicate that the company’s liquidity position was comparatively strong. However, the analysis of the balance sheet showed that the company’s current assets are mainly comprised of receivables, which are due from its customers. It is reported that the company was facing major delays in collection and bad debts could further affect its ability to generate a profit.
Table 4: Liquidity Ratios.
Solvency ratios. The company’s credit analysis indicates that its total debt was AED 2,628 million and AED 2,424 million in 2016 and 2015 respectively. Table 5 provides values of solvency indicators including debt to equity ratio and times interest earned.
Table 5: Solvency Ratios.
It could be noted that the company debt position worsened in 2016 as it was unable to generate a profit from operations. Furthermore, the company’s retained earnings were negative, which implied that the company did not have funds to finance its operations. Since, the company made an operating loss in both years, times interest earned was negative. A similar situation is noted in the case of the competitor firm, i.e., Arabtec Holding PJSC.
Profitability ratios. Table 6 indicates that all profitability measures had negative values in the last two years. However, a common trend could be noted as Arabtec Holding also reported a net loss in 2015 and 2016.
Table 6: Profitability.
Sustainable Earnings Analysis
The earnings analysis indicates that the company generates an operating loss in the last two years. The company’s contract revenue declined in 2016, which implied that the company does not a sustainable source of revenue and income. Furthermore, its other income also reduced by almost 50%. Note 22 indicates that the company also generates other income from the sale of scrap and rental properties. The company also incurred a comprehensive loss due to foreign currency transactions. The unusual item reported in 2015 indicated that the company incurred a loss from investment in joint venture and associate.
However, no such entry was made in the income statement of 2016. The company follows IFRS 8: Segmental Reporting to provide a breakdown of its revenue. It could be noted that the company’s engineering services generate the highest revenue. On the other hand, the highest segmental loss was related to its civil services.
Cash Flow Analysis
Table 7 provides the values of net cash flow from operating, investing, and financing activities.
Table 7: Cash Flows.
It could be indicated that the company had negative operating cash flows in the last three years. Although the company undertook various construction projects, it was not able to receive payments from its clients. It also sold its non-profit generating assets to compensate for its poor cash position. However, it could be noted that the company failed to generate earnings and depended on debt.
Activity Analysis
The efficiency analysis includes various performance ratios, which are provided in Table 8.
Table 8: Asset Utilization Ratios.
The results indicate that the company’s asset management efficiency weakened in 2016. The company’s cash cycle extended by almost 34 days. It implies that the company faced delays in realizing cash for its sales.
Financial Stability and Flexibility
The management report of Drake & Scull indicates that its principal activities including construction, designing, engineering, and contracting. The company’s business is focused on the development and improvement of water and power projects. The lack of diversification in business activities has caused problems for the company. The poor market conditions along with weak management and the high cost of finance have forced the company to experience a backlog in the completion of its projects. The analysis suggests that the company is lacking financial stability and flexibility to generate funds from sources other than banks.
Equity Analysis
The company’s equity declined in 2016 as it could be noted from Table that the retained earnings of Drake & Scull were negative in the last two years. The company failed to generate project sufficient sales to cover its operating expenses, which resulted in an operating loss and subsequently, net loss attributable to the company’s shareholders.
Table 9: Equity Analysis.
The company has initiated its capital restructuring plan in which it aims to buy back its shares from the equity market and inject fresh equity of AED 500 million from Tabarak Investment.
A business needs to generate a positive return on invested capital (ROIC). Shareholders expect financial stability, and it is the responsibility of the management to take steps to ensure that equity investments are secured. However, in the case of Drake & Scull, it could be noted that the company generated a negative return on invested capital, which implied that the management was inefficient to safeguard shareholders’ interest. It is the reason that the company changed its management team in the last year.
Table 10: Return on Invested Capital.
The DuPont Analysis is carried out in this section to determine the value of Return on Equity (ROE).
Table 11: DuPont Analysis.
Table 11 indicates that the company generated a net loss in both years. Its asset efficiency also reduced as it had fewer sales in 2016. Moreover, the value of the equity multiplier increased significantly that implied that the company had less equity to finance its assets. Therefore, it could be stated that the company had poor sustainability of earnings.
The two valuation methods that are implemented in this report are the Price-Earnings ratio (P/E) and Enterprise Value (EV). The P/E ratio values were negative in the last two years, which means that the company’s share price is likely to fall despite the new capital being generated by the management. The enterprise value of the company is calculated in Table 11 that is used for calculating the valuation ratio EV/EBITDA. The negative value of this ratio implies that the share price is unlikely to hold its current value.
Table 12: EV/EBITDA.
Sustainable Growth Analysis and Management
The company failed to achieve sustainable growth, which reflected poor management. In the last few years, the construction industry faced exceptional weak demand that caused property prices to decline in the UAE and other Middle Eastern markets. The company failed to predict the changing trend and it invested significant amounts in new projects, which are still not completed or sold.
Market Risk
The price to book ratio (P/B) value increased in 2016, which implies that the company’s stock price was more than the book value. The higher value of P/B means that there is a possibility of price correction. i.e., a decline in the stock price is expected. The shareholders can lose the value of their holding in the company’s shares. Therefore, they need to have a cautious approach regarding their investment.
Table 13: Price-Book Ratio.
Operating Risk, Corporate Governance, and Corporate Social Responsibility
The company’s annual report indicates that it faced major operational risks resulting from poor management decisions. The company’s business is concentrated in the GCC region, which is presently experiencing a major slowdown in the construction industry. In this way, the company’s projects portfolio is considered weak. Moreover, the market conditions have toughened due to the increased competition in the industry. The company has implemented a risk management system at the operational level to identify, evaluate, and manage risks associated with its projects. It has adequate compliance measures to ensure that projects with minimal risks are accepted.
The company’s corporate governance practices are monitored and assessed by the Audit Committee and the Nomination & Remuneration Committee. The company has drafted its Corporate Social Responsibility (CSR) policy and contributes to the development of new technology and promoting education and health and safety to its employees and communities. The company invests in many initiatives to promote talent and develop new leaders.
Conclusions and Recommendations
The analysis concludes that Drake & Scull is facing difficult business and market conditions. The construction industry has slowed down in the last three years, which has resulted in the delayed completion of projects and payments for them. The company has its main business activities in the GCC countries that share similar market conditions and trends. The financial analysis of the company indicates that the company failed to generate a profit in the last two years. The most serious concern is that it had negative operating cash flows. The high value of receivables could create liquidity issues for the company. Its over-borrowing situation could undermine its ability to undertake any new projects. Therefore, it could be suggested that the company’s financial problems are likely to continue in the coming periods.
Based on the findings of this report, it is recommended that shareholders must sell their shares to avoid any further capital loss. They should adopt a risk-averse approach and withdraw their investments from the company’s stocks.