Introduction
Strategic managers will be efficient if they understand and respond to operational standards. This paper compares a local stock exchange (Dubai Stock Exchange) with global stock exchange (New York Stock Exchange). Strategic theories help business organizations to strategize efficiently for effective performance. Both NYSE and DFM apply the resource-based theory of strategic management because they both focus on the importance of knowledge via information technology systems. Companies that apply the resource-based theory consider the organization as a bunch of resources and skills, Comprising of people, monetary, tangible, and intangible resources. The basis for this theory is that resources are non-consistent and are limited in elasticity, thus organizations may convert the resources and skills to strategic advantages.
The Dubai Financial Market is based in the UAE and was established on March 26, 2000. It currently lists sixty companies, most of which are located in the UAE, with a few others located in other Middle Eastern countries. Although DFM share prices were high in 2004 and 2005, they slumped by the end of 2005, and in 2006, the market had lost more than 60% of its value (Dubai Financial Market Annual Report 2012).
The New York Stock Exchange (NYSE) is the largest stock exchange in the world in terms of market capitalization And is currently owned by Intercontinental Exchange. Dubai’s Financial Market can learn tremendously from the New York Stock Exchange. This research highlights the different approaches and characteristics of both markets and provides recommendations based on the differences between the two stock markets.
Comparative Analysis of NYSE vs. Dubai’s Financial Market
The comparative analysis in this paper is based on the EGSOP (Environ, Governance, Strategy, Organization, and Performance) analytical method. The subsequent sub-sections compare NYSE’s and DFM’s EGSOP features. NYSE is a bigger exchange company than DFM, and DFM must respond to opportunities for change to attain its full potential. Thus, the analysis places more emphasis on DFM since there is a need to get a detailed understanding of its operations and performance, to provide effective recommendations for change.
Environ
Environ analyses focus on the impact the environment has on the performance of both stock exchange platforms. Economic variables in the environment where a stock platform operates will affect the performance of the stock platform (Kieso, Jerry & Warfield, 2007, p. 738). Since NYSE lists companies located in the US and Europe, European and American economic environments will affect NYSE’s performance.
For example, there have been important changes in NYSE’s governing environment. Specifically, President Obama endorsed the Dodd-Frank Act in 2010, and most of its stipulations necessitate the implementation of ambiguous rules and may negatively affect NYSE’s business or lead to higher costs for the disbursement of important resources. Structural reforms in Europe’s regulatory system may also adversely affect NYSE.
Although the NYSE has not recorded a decline in its capacity to borrow, borrowers have indicated concern for potential marketplace liquidity by reducing advance rates for some security forms, increasing interest rates, and implementing more strict collateral requirements (Edmonston, 2006). Consistency in these trends will result in an increase in the costs of NYSE’s business and may limit its performance.
NYSE forecasts that these factors will continuously influence its operations and all possible improvement in the world market may be affected by shareholder uncertainty due to instability in the cost of goods, unemployment issues, pollution issues regarding the sovereign debt problems experienced by Eurozone countries, and the overall condition of the global economy. NYSE seeks to avoid these risks through cost reduction and by expanding and broadening its revenue streams.
Governance
Governance is a group of laws that stipulate the behavior of an organized body (Bevir 2013, p. 38) by stating the permissible actions, these organizations may engage in. The NYSE is governed by the Securities and Exchange Commission (SEC), while the DFM is governed by the Securities and Commodities Authority. The SEC’s primary responsibility is to enforce securities laws and regulate all securities activities in US (Seligman, 2003, p. 47).
SEC activities are aimed to protect the investors, ensure an equal and organized market, and enable capital creation (Seligman, 2003, p. 45). Congress permits the SEC to take civil action NYSE if it is found to have engaged in fraud, misinformed its stakeholders, or violated federal securities laws. To accomplish its objective, the SEC requires the NYSE to provide quarterly and yearly reports, stating all accounting activities, as well as a “Management Discussion and Analysis” provided by the NYSE’s executive board. The Management Discussion and Analysis summarizes will provide a summary of NYSE’s performance and highlights prospective activities for the following year.
Through its Electronic Data Gathering, Analysis, and Retrieval (EDGAR) structure, the SEC provides all trading information to the public. The SEC is centralized and provides online information about companies and stock platforms, in real-time, to aid the investment and listing decisions of individuals and public companies, respectively.
DFM is governed by the Securities and Commodities Authority (SCA). Governance roles of the SCA are comparable to those of the SEC; however, there are two significant variations in the governance activities of the two bodies. Unlike the SEC, where all reports are published online for the public, the SCA requires that DFM reports all trading activities to the finance minister, who reviews the report before it is released to the public.
Another significant difference is that, unlike the SEC, the SCA may establish offices or branches to delegate the activities of monitoring and supervising the markets. SCA’s objective is to protect investors and improve the ideals of informed and legal procedures, and to enhance the effectiveness of UAE capital markets by building the required legislations, improving supervisory regulations, and ensuring investment and legal responsiveness.
The slight difference between the SEC and the SCA may place the efficiency of the SEC over that the SCA. While DFM has not reported any corporate governance issues, the NYSE has faced several legal issues. For example, the SEC fined the NYSE more than $4 million for failing in its responsibilities. SEC’s reported that NYSE served as a block trading organization between 2008 and 2012 and failed to conform to its own rules when it disclosed closing order information to its flow brokers before time (Protess, 2013).
This fine came when the NYSE was already involved in a controversy with a book that exposed rigging in the market (Brown, 2014). NYSE accepted the fine, but neither admitted nor denied. The SEC also instructed NYSE to perform an internal audit and appoint an external auditor to examine its accounts. The strict nature of SEC’s rules will ensure the NYSE conforms to standards, and this will improve its overall performance.
Strategy
The difference in the strategies applied by the NYSE and the DFM will also affect their respective performances. NYSE’s comprehensive data center has always provided it a strategic edge. Unlike DFM, NYSE does not base its operations on third party data centers; rather, it strategically positioned its facility in Mahwah, in proximity to Wall Street. This positions its data center at the center of its operations as it establishes a network of liquidity around the US. NYSE integrates strategic positioning of its facility with real-time data management technology to outperform other trading platforms both locally and internationally.
DFM’s strategically directs its values, mission, vision to ensure growth, as it prepares to face increasing obstacles, and more significantly, showing DFM’s continuous commitment to improving its services to benefit investors. To remain innovative, DFM has focused on directing its investment towards developing its IT structure. Continuous developments have majorly contributed to strengthening DFM’s position as the premium trading platform and the choice destination for local and international investors.
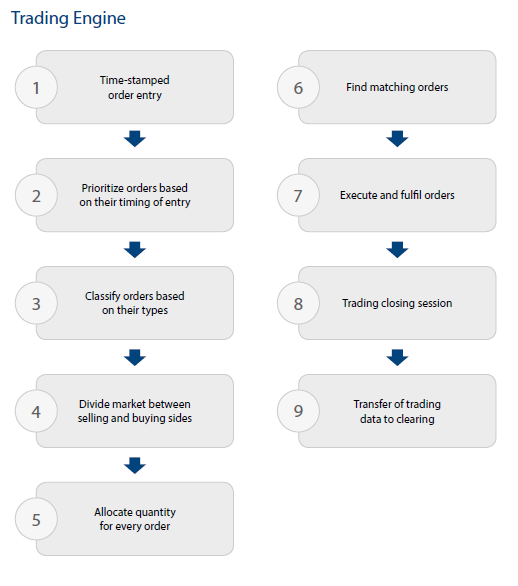
Transparency, technological innovation, efficiency, and confidentiality, are central DFM values that inflicted the rolling out of diverse advanced systems accessible to market participants and investors. DFM’s understanding of the importance of technology is obvious in its early adaptation of the ”X Stream” trading system, one of the most efficient trading systems globally. The figure below illustrates DFM’s is a flowchart illustrating DFM’s automated trading process.
Organization
The organization and operations of exchange platforms will also influence their performance. Borse Dubai, a government-owned company, currently owns 80% of DFM’s shares. The NYSE, on the other hand, is owned by Intercontinental-Exchange Group, Inc. (ICE). ICE is an international group of financial houses that owns and runs 23 regulated exchanges and marketplaces. Its headquarters is located in Atlanta, Georgia. Unlike Borse Dubai, which owns 80% of DFM’s stock, ICE is not government-owned, and this enables it to make decisions that are more logical for business growth. NYSE has a faster decision-making process than DFM since DFM’s decision-making process will be characterized by a bottleneck as is in most government-operated entities.
Performance
The performances of the two exchange entities depend on their characteristics, discussed in the preceding sections of this report. This section summarizes the recent performance of the two exchanges analyzed in this paper.
DFM recorded significant growth in 2012 in spite of unstable global economic circumstances. It is important to note the improvements in the performance of the market since 2008. Dubai Financial Market Annual Report claims that “there was an increase in DFM’s trades value in 2012 to AED48.8 billion, an increase of 52% compared to the preceding year 2011”, which had the following effects on DFM’s financial performance:
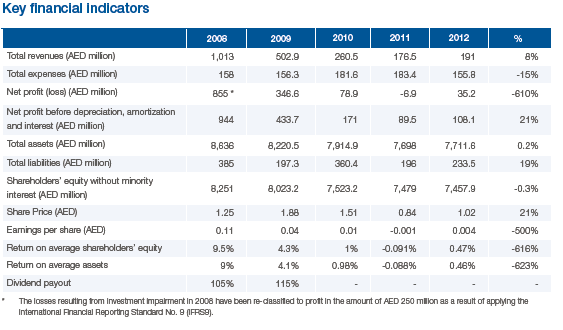
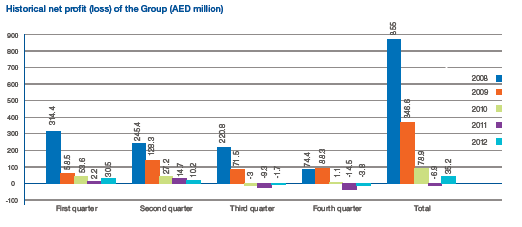
A significant performance measure is a net profit. DFM recorded a net profit of AED 35.2 million in 2012, compared with a 6.9 million in losses 2011. Environmental factors, such as improved trading values, higher revenue streams, and lowers expenses and losses, were responsible for the improvement in DFM’s performance. The blue bar in the chart below illustrates DFM’s performance in 2012. The improvement in all quarters is obvious as the difference between the blue bar and the other bars is glaring.
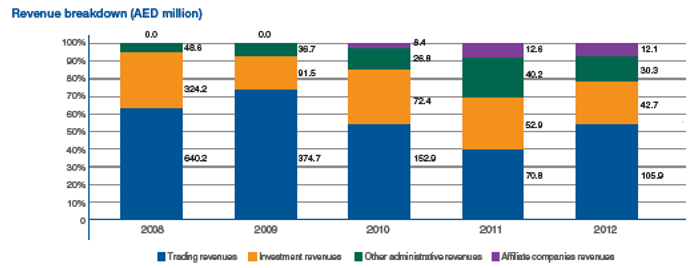
Revenue is another significant measure for analyzing the performance of DFM. In 2012, DFM’s revenue totaled AED 191 million, an 8% increase, compared to the 2011 (Dubai Financial Market Annual Report, 2012). These increases were also influenced by environmental factors such as “rise in the trading revenue and other new revenue streams”.
However, there was a continuous decline in revenue from other sources, especially broker fee revenue, investment revenue, and revenue generated from clearing and settlement, all as a result of broker exit from the market. Trading revenue was responsible for 55.4% of the overall revenue in 2012, and investment was responsible for 22.4%. There was also an increase in the value of new revenue sources for DFM in the absence of subsidiary contributions in 2012. These revenues were a result of listing fees, market statistics, dividend distribution, and safe custody fees. Dubai Financial Market Annual Report Claims that “these revenues accounted for 4% of total revenue compared to 2.8% in 2011, marking a growth rate of 54%”.
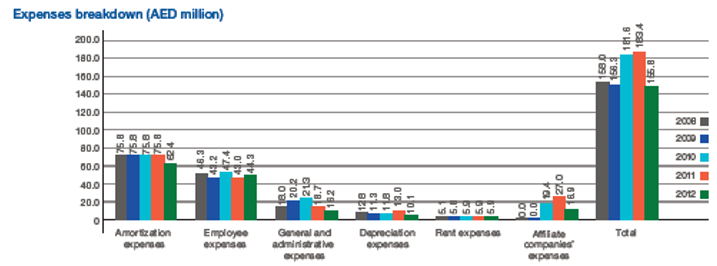
Lower expenses mean higher profitability. DFM’s recorded lower expenses in 2012, and this positively affected its performance. Dubai Financial Market Annual Report “expenses amounted to AED 155.8 million in 2012 including subsidiaries’ expenses in the amount of AED 16.9 million compared to AED 183.4 million in 2011, marking a decrease of 15%”.
The decrease in expenses was due to the strategy adopted by DFM’s management to lower administrative and general spending. The blue bar in the chart below indicates the spending in 2012, and comparing it with the red bar, which represents spending in 2012, shows a decline in the total depending between 2011 and 2013.
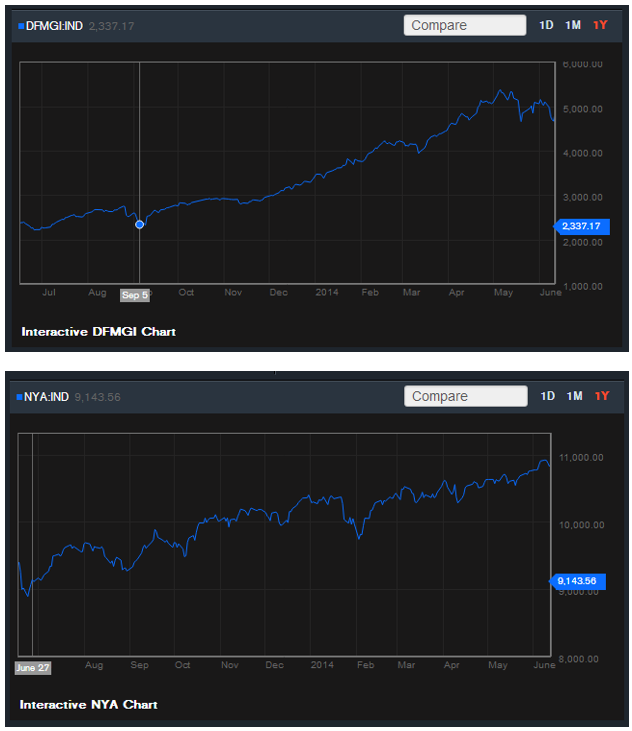
Comparing index trends between the NYSE and DFM will show the growth rate of both exchanges. The two charts below illustrate the index trend for DFM and NYSE, respectively. The growth rate can be observed through the steepness of the two charts presented. The first chart (DFMGI: IND) presents a steeper upward trend line indicating that DFM has a faster growth rate than NYSE. While the second chart (NYA: IND) also shows a positive trend, it is less steep than DFMGI: IND.
Conclusions and Recommendations
This paper compared a local exchange company (Dubai’s Financial Market) with an international exchange company (NYSE). NYSE currently outperforms DFM and DFM can learn tremendously from the New York Stock Exchange. A look at the performance of both companies shows a glaring difference in the performance of the both companies however, DFM shows better growth trends than NYSE. DFM’s value for different performance measures doubled between 2011 and 2012 and its index trend shows potential for continuous growth in the coming years. Nevertheless, DFM must make some changes in preparation for its obvious growth.
The analysis indicates the DFM needs to modify some controllable characteristics to improve its performance. The fact that 69 companies trade on DFM’s exchange platform makes it comparatively inferior to NYSE. Since DFM is owned by a government owned company, government may ease tax laws for listed companies to encourage more companies from trading on DFM’s platform.
The fact that a government owned company possesses most of the shares in DFM eases the possibility for improvement in DFM’s performance. The government should regulate SCA’s liberty to establish subsidiaries or delegate tasks to other companies to monitor DFM’s activities in order to reduce the ambiguity of laws governing DFM operations. A single regulatory body will produce clarity in governance, and encourage non-listed companies to become listed. DFM can become an international exchange company if it goes beyond merely reporting its improved performance, but responds to the opportunity it has.
References
Bevir, M 2013, Governance: a very short introduction, Oxford University Press, Oxford, UK.
Brown, A 2014, SEC fines NYSE $4.5 million for violating its own rules. Web.
Dubai Financial Market Annual Report 2012, Dubai Financial Market, Dubai, UAE.
Edmonston, P 2006, Where Wall Street meets to eat, the last lunch. Web.
Geisst, C 2004, Wall Street: A History – From its beginnings to the fall of Enron, Oxford University Press, London.
Kieso, D, Jerry J. & Warfield, T 2007, Intermediate accounting, John Wiley & Sons, New York.
Ludwig, G & Pemberton, J 2011, ‘A managerial perspective of dynamic capabilities in emerging markets: the case of the Russian steel industry’, Journal of East European Management Studies, vol. 16, no. 3, pp. 215-236.
Porter, M 1980, Competitive Strategy, Free Press, New York, NY.
Porter, M. E. 1985. Competitive Advantage: Creating and Sustaining Superior Performance, Free Press, New York, NY.
Protess, B 2013, S.E.C.’s revolving door hurts its effectiveness, report says. Web.
Seligman, J 2003, The transformation of Wall Street, Aspen, New York, NY.