Abstract
The main aim of this study was to assess whether the e-recruitment process can be implemented in organizations in the Kingdom of Saudi Arabia. To understand these issues, the study deployed the case study of a big organization in Saudi Arabia. Further, it incorporated the existing literature that has discussed employee recruitment and factors that determine such performance in an organization. Data was gathered from a sample of employees of t organization under study. Statistical tools were used for data analysis. The study found out that e-recruitment saves cost and also creates a large pool of employees.
Introduction
Introduction
This chapter contains the background of the e-recruitment process and its impacts on organizational human resources. It also contains the summary definitions and base theory, the background of the host organization, the rationale for the research area, the research objectives, and the research hypothesis. It concludes with the outlined methodology and the plan of the dissertation.
Background to the study
Recruitment is a very significant aspect of Human Resource Management. It involves practices and exercises conducted by organizations with the aim of recognizing and drawing new staff (Handlogten, 2009, p. 16). Recruitment is essential in organizations because it carries out the significant function of attracting the most vital resource, human capital, into the business. Moreover, it has a strategic implication since it focuses on the need to attract highly qualified and competent staff, which can provide a competitive edge over business competitors (Boxall & Purcell, 2003, p. 44; Parry & Tyson, 2008, p. 260).
There are three factors that influence the recruitment process in the current labor market. The first factor is the tight and competitive labor markets. The shortage of skilled and competent candidates makes it extremely difficult to recruit suitable personnel. The second factor is the recruitment techniques. The recruitment process is a very difficult process and, therefore, there is a need to choose suitable means of accessing the labor market (Chartered Institute of Personnel Development, 2007, p. 22). The third and last factor is the increasing number of individuals who have access to the internet. Studies show that nearly a third of the global population has access to the internet. As a result, most companies have embraced the use of ICT in nearly all aspects of their operations (Parry & Tyson, 2008, p. 265).
Job applications through the mail are nowadays becoming very rare. In fact, most multinational corporations discourage applicants from making application mail. For example, companies like Coca-Cola, Dow Chemicals, and Vivo only have an online option for job applications. Online recruitment systems benefit not only job seekers, but also the company (Chartered Institute of Personnel Development, 2007, p. 22). Boxall and Purcell (2003) found that “online recruitment system guarantees transparency, efficiency and independent access by all the stakeholders” (p. 46).
Problem statement
Most organizations have over-relied on pay-for-performance approaches to their strategic human resource management practices. Results from past studies affirm that organizations extensively relied on pay compensation systems in an effort to improve organizational performance by positively influencing their employees’ behavior (Parry & Tyson, 2008, p. 262). Consequently, different recruitment structures have been formulated in an effort to assess the contribution to employee performance. The integration of dispersed pay structures in an organization’s compensation system may culminate in negative effects. Other studies show that “the contribution of dispersed recruitment structures in employee performance might be insignificant” (Parry & Tyson, 2008, p. 262).
While many people have developed the perception that more recruitment can lead to better performance, this issue is more complex than meets the eye since employee performance is a mix of many factors, which do not necessarily end with better payment. In addition, other studies emphasize that despite the fact that the issue of the significance of relative and absolute pay has been extensively researched, numerous gaps remain unexplored (Boxall & Purcell, 2003, p. 44).
Research purpose and rationale
Incorporating the existing literature will lead to a better appreciation of key issues that relate to the subject that the case study will reveal. The rationale for conducting this study has arisen from the need to understand the relationship between pay level and employee recruitment. Currently, organizations increasingly appreciate human capital as a source of sustainable competitive advantage. Thus, the need to develop and retain a strong human capital base has increased considerably. However, it is imperative for organizations’ management teams to appreciate the contribution of their employee recruitment systems to worker performance. Such consideration will provide the organization’s management team with an insight on how to adjust their employee compensation systems.
Research objectives
This paper intends to achieve a number of objectives, which include:
- To evaluate the basis for the implementation of the e-recruitment processes, and
- To assess the factors that make the e-recruitment process a success.
Research question
The above research objectives will be assessed by taking into consideration the following research question.
- What is the impact of the implementation of the e-recruitment processes?
Research Hypothesis
To achieve the research objective, the proposal is based on the following null (H0) and alternate (H1) research hypotheses.
- H0: The e-recruitment process has great benefits for an organization.
- H1: The e-recruitment process has no benefits to an organization.
Literature Review
Introduction
Online recruitment is commonly known as e-recruitment or web-based recruitment. E-recruitment has been described differently by different writers. However, the essence is the same. Handlogten (2009) defines e-recruitment as “the use of the internet to identify and draw potential candidates, which include the use of the own company website and other online platforms” (p. 16). Galanaki (2002), on the other hand, defines e-recruitment as “posting job vacancies online and letting candidates send their curriculum vitae through e-mail or electronically” (p. 33). He adds that e-recruitment can also entail remote interviews, for instance, online aptitude tests. Basically, e-recruitment systems help to match employees and employers. Corporate websites provide applicants with the opportunity to get to know more about the organization, its tradition, job prospects, and employment opportunities (Handlogten, 2009, p. 18).
E-recruitment in Saudi Arabia
Information Communication Technology (ICT) has turned out to be a core business enabler in Saudi Arabia. The “dot.com” recession of 2001, followed by the Great Recession of 2007, saw an increasing demand for information technology systems to maintain a competitive advantage at a low cost. At the same time, Technology and connectivity evolved very fast with the introduction of numerous cloud platforms and high-speed internet. It has transformed how individuals and business entities operate in the country (United Nations, 2012, p. 76).
The continuous evolution of ICT has assisted businesses in Saudi Arabia to automate their systems and discover new products and, therefore, giving them a competitive advantage in their respective industries. A number of studies have shown that the growth of multinational corporations in the country is highly attributed to their capacity to speedily leverage ICT for their own benefit. On the other hand, small and medium-size organizations are increasingly embracing this idea (United Nations, 2012, p. 77).
As a result, companies and institutions in Saudi Arabia are increasingly embracing the use of ICT to recruit new personnel. The majority of them post job vacancies on the World Wide Web (United Nations, 2012, p. 77). The falling cost of internet technology and enhanced accessibility of broadband technology have considerably affected the conventional recruitment methods. As a matter of fact, the conventional frontiers that existed between the traditional media and recruitment agencies are collapsing. In the recent past, recruitment had the highest expenditure with online job advertising leading in terms of spending (United Nations, 2012, p. 78).
The growth of online recruitment methods is attributed to the benefits associated with it both from the applicant and organization’s perspective. For example, increased internet access in Saudi Arabia means applicants can access companies’ websites at any time of the day. In addition, companies are able to reach all the potential candidates quickly both locally and internationally. In addition, e-recruitment is very cost effective compared to the traditional recruitment methods (United Nations, 2012, p. 78). Other benefits include ease of use for applicants and organizations, access to a larger pool of candidates, greater success in finding the right candidates, and competitive advantage in the labor market (United Nations, 2012, p. 79).
The use of online recruitment methods has also been embraced by the Saudi Government. According to the latest United Nation’s report, Saudi Arabia is ranked number 58 globally and 4th in the Middle East for e-governance. The United Arab Emirates is ranked first, followed by Bahrain and Oman respectively. Nearly all the government jobs are available in an e-government portal and they can be applied via the internet (United Nations, 2012, p. 81).
E-recruitment has helped companies in Saud Arabia to generate a pool of applicants as a result of jobs posted through their websites and other online job boards. Even though they are forced to pay a fee in order to establish a direct link to their websites, the cost is considerably lower than the conventional recruitment methods (Fawzi & Almarshed, 2013). In fact, e-recruitment has given the Saudi organizations the most vibrant solution for enhancing their relationship with job applicants. It has also improved information flow and accelerated the recruitment process (Fawzi & Almarshed, 2013).
With a touch of a computer mouse, employers in Saudi Arabia are currently able to classify vacant positions, post them on the internet, gather CVs and list qualified applicants just as simple as that. In addition, most recruitment agencies in Saudi Arabia have a safe, interlinked database and state of the art workflow system, which is often used to notify organizations about the available job seekers. This gives organizations more power over the recruitment process since they can define search parameters and prospective decisions (Fawzi & Almarshed, 2013).
Human capital is one of the major challenges for companies based in the Saudi Arabia. The labor laws limit the number of expatriates that can be hired. In addition, the country produces a relatively low number of skilled and competent. Moreover, their expertise does not match the requirements of the industry. Therefore, many of them have resorted to hiring expatriates, regardless of numerous challenges associated with hiring foreigners (Alhamad, 2014).
The cost of hiring skilled labor in Saudi Arabia is also very expensive. The high cost of skilled labor is attributed to high demand for labor in the country and scarcity of skilled and competent domestic labor. The high demand for skilled labor has also led to the escalation in wages. Companies have been forced to introduce higher remunerative packages to attract highly skilled and competent workers. In addition, the rising wages are also attributed to the increasing cost of housing and the cost of living.
For these reasons, most companies in Saudi Arabia have resorted to cost-cutting measures to reduce their wage bill and cost of staffing. The measures include hiring fresh graduates. Other measures include hiring expatriates from less developed economies who have less wage demand. Therefore, e-recruitment is like a miracle to these companies because they had to rely on foreign agents to access a pool of desired personnel (Alhamad, 2014).
Nonetheless, many employees often fail to realize their HR objectives, even though they possess the requisite technology and material resources. This mainly attributed to the existing culture in Saudi Arabia. Saudi Arabia is among the most tribal countries in the world and, therefore, nepotism (Wasta) plays a key role in the recruitment process. A number of organizations have realized that nepotism imposes itself when advertising vacant positions in the traditional media. As a result, these organizations have partnered with recruitment agencies to acquire the best candidates for the vacant positions. Most of these agencies operate through the World Wide Web. The partnership has helped these companies, especial banks to acquire crème de la crème in the labor market, both within and outside the country (Fawzi & Almarshed, 2013, p. 3).
In a nutshell, companies in Saudi Arabia pay a lot of attention to the role of a strategic partner. The emphasis on strategic HRM supports the idea that current organizations cannot attain competitive advantage without exploring HR strategies and trends. These strategies create a foundation for further growth and development. They also encourage companies to be more proactive that reactive in shaping their destiny. In addition, the role of a change agent is very important. HR managers are very important in enforcing the change in the organization. This is due to the fact that they are the principal custodians of organizational values and culture, which are the main strategic elements determining companies’ potential.
E-recruitment phases
Normally, the recruitment process starts with identifying available positions. Thereafter, the recruiter is authorized to fill the vacant position. However, the position must be cautiously examined. The analysis involves the determination of the required knowledge and skills. After the identification and analysis, the position can be advertised in the media (Handlogten, 2009, p. 16). E-recruitment is different from the customary recruitment process in the sense that it uses web and technology to bolster the process. Vacant positions can be published on the company’s website or career sites. Job applications can be made through the internet. In addition, further communication between company and applicants extensively relies on the internet (Parry & Tyson, 2008, p. 265).
Cappelli (2001) defines the online recruitment procedure in three phases; “the first phases involve attracting potential candidates” (p. 140). The applicants can be attracted by the company’s status, image, online tools and other ways that can attract as many candidates as possible to the company’s website. The company can also strengthen their HR image by providing information regarding various job positions within the company and employment conditions. The second phase involves sorting candidates based on their online test scores and qualifications. The third phase involves managing applicants’ contacts, which should be done on time. Most companies often use automated hiring systems to contact qualified applicants very fast before they are taken by other organizations (Cappelli, 2001, p. 141).
Pin, Laorden, and Sáenz-Diez (2001) also described the e-recruitment stages. They stress that “the e-recruitment process only differs from the conventional recruitment process because of the use of e-enabled technology” (p. 33).
According to Pin et al. (2001), the e-recruitment process takes after a methodological HR planning process, which involves strategic analysis and planning of manpower getting into and out of the organization. However, the e-recruitment process neglects a fourth phase that is considered very crucial in the Human Resource Management process. This is concerned with the human aspect of the process, which involve making a telephone call, arranging for a meeting and exchanging handshakes. Pine et al. (2001) argues that the e-recruitment process is increasingly neglecting the human touch.
Elements and success indices of e-recruitment implementation
Implementation is a broadly researched topic and in every research implementation is defined differently (Krishnan & Singh, 2006; Parry, 2006, p. 4). Handlogten (2009) defines the implementation as “the execution of strategy or plan to actualize change” (p. 21). He sees IT implementation as a step between the adoption stage and the actualization stage. IT implementation involves the formation of strategy, project definition and introduction of new technology into the organization. However, Krishnan and Singh (2006) found that “the implementation phase is a stage after selection HR information system” (p. 33). He explains that the IT implementation involves all the operations from the adoption of new technology to the actual use of the technology.
Some writers view that IT implementation is considered complete after the realization of change, whereas others believe that implementation is complete after the realization of its benefits (Cappelli, 2001, p. 145). Ruta (2005) on the other hand, argue that “the success of e-recruitment implementation depends on whether the system is effectively executed and has a positive impact on the organization” (p. 38). He is among those who subscribe to the idea that e-recruitment implementation is complete when the anticipated benefits are realized. For this study, the anticipated benefits are referred to as results of e-recruitment implementation. Therefore, e-recruitment implementation is successful when the anticipated results are realized.
Ruta (2005) emphasizes “the significance of a system in the successful implementation of e-recruitment” (p. 40). In this case, the system includes technology and members of the organization. Members of the organization are expected to use the technology directly or support its use. In addition, the technology must fit with the values of the targeted users to guarantee successful implementation. Last but not least, the technology has to be used frequently, consistently and diligently so as to realize its full benefits.
Handlogten (2009) found that, “successful implementation of e-recruitment also calls for proper management” (p. 22). He states that “it does not matter how much preparation has been carried out, nor how talented is the task group, the critical factor is excellent management”. He adds that in most cases the e-recruitment process does not achieve the expected results due to poor implementation. As a result, good management is a critical aspect of e-recruitment implementation. In a nutshell, the project team must engage both the technological and organizational aspect of e-recruitment implantation.
This means e-recruitment implementation is more than just substituting the medium like in the conventional recruitment process. The application of the system requires more than a change in technology (Panayotopoulou, Vakola & Galanaki, 2005, p. 288). Krishnan and Singh (2006) confirmed that “the e-HRM is very much regarded as an information technology implementation by organizations” (p. 30). Yet, when really carrying out the implementations, organizations recognized that e-HRM implementation also calls for a change in organizations. Therefore, e-recruitment implementation requires total support from the management.
From a technical perspective, the important factors to be considered during e-recruitment implementation include system features or strength, and the application of the system. Proper utilization of the system is significant because e-recruitment implementation can be considered as a failure when the system is used less habitually, less consistently or less steadily than required. This is regarded as the system’s strength (Parry & Tyson, 2008, p. 269).
Facilitators of the e-recruitment implementation
In order to identify the facilitators of e-recruitment implementation, the concept of e-recruitment features and system’s strength must be considered (Handlogten, 2009, p. 25). There are three significant models that have always been used to identify technology enablers, namely: D&M IS success model, the Technology Acceptance Model, and the End-User Computing Satisfaction model (Handlogten, 2009, p. 26). The most noticeable contrast between the three models is their viewpoint on IT implementation success. The D&M IS success model assesses the net benefit of the implementation process (DeLone & McLean, 2003, p. 12).
The Technology Acceptance Model, on the other hand, looks at the rate in which the technology is embraced and used in the organization. Lastly, the End-User Computing Satisfaction Model assesses the end-users’ satisfaction level. Satisfaction is defined as the attitude towards the new technology or system (Handlogten, 2009, p. 27).
To determine e-recruitment success, the Technology Acceptance Model tries to envisage individual approval of e-HRM by gauging their intent and capacity to describe their intent. Anchored in longitudinal research, the model measures the efficacy and ease of use by the end-users in terms of mindset and individual norms (Handlogten, 2009, p. 26). The model has been tested in many studies. According to these studies, the supposed efficacy appears to have more weight than ease of use (Krishnan & Singh, 2006, p. 54).
The model has received a great deal of support, but that does mean it has not been criticized. Some of its challengers argue that the Technology Acceptance Model has been derived from self-reports. In addition, most of the empirical studies on the model involve students instead of the corporate world. Lastly, studies on the model have always put a lot of focus on system development applications (Handlogten, 2009, p. 27).
A tool has been developed to measure the end-user satisfaction. It merges convenience and information product items to assess the clients’ level of satisfaction (Krishnan & Singh, 2006, p. 54). Etezadi-Amoli and Farhoomand (1996) proposed 12 items, which were used to assess the component of client satisfaction. The five components are content, precision, configuration, usability and timeliness. Etezadi-Amoli and Farhoomand (1996) also discovered a considerable variation in end-user performance, which is described six attitudinal variables pertaining to end user satisfaction. Yet, they claim that additional hypothetical foundation is missing and, therefore, the results must be treated with care.
D&M IS success model gauges the success of new innovations. It is based on five significant concepts. The first two include information and system quality. They have a considerable impact on users’ intent and satisfaction, which consequently affects the performance of a person and an organization (DeLone & McLean, 2003, p. 14). Many studies have found the model to be valid. This is because there is empirical evidence showing that the model is portrayed by logical force and, therefore, explains the information system’s success. Handlogten (2009) asserts that “the inclusion of the supposed usefulness to substitute use was very important, given that use is basically an action and do not reflect achievement in circumstances where usage is compulsory” (p. 27).
Looking at the three models, it is evident that the Technology Acceptance Model and the End-User Computing Satisfaction model tend to be characterized by sentiments, for example, the level of satisfaction and approval. Even though D&M IS success model also incorporates user satisfaction like the other two models, it centers on ultimate advantages. Therefore, the D&M IS success model is taking further strides when taking into account ultimate benefits. The net benefits include quantitative measures, like enhanced process duration, diminished expenses, or better returns. The model provides an all-encompassing measure, and not just a sentimental measure of IT viability and achievement (DeLone & McLean, 2003, p. 15; Handlogten, 2009, p. 29).
Last but not least, among the three models, D&M IS success model is the only model that incorporates system’s service quality. Service quality was included in the model due to the fact information and system quality only assesses the system on its own (DeLone & McLean, 2003, p. 15). Service quality is always undermined, yet it is very significant in information system’s success. For this reason, the inclusion of service quality in the D&M IS success model offered a more comprehensive overview.
Innovation and service quality as a facilitator of e-recruitment system efficiency
After expounding on different information technology implementation efficiency assessment models, it is important to take a look at information technology implementation taking into account e-recruitment implementation. It is also vital to incorporate the qualities of information technology in e-recruitment implementation. In order to achieve this, a construct is required to gauge the quality of the technology itself. As a result, the study will incorporate the quality of innovation as a construct for the implementation of e-recruitment. This alludes to the nature of e-recruitment technology and the information derived from it. Therefore, the inclusion of this construct will make sure that the technology itself is assessed.
However, another construct is needed to strengthen the general assessment of IT efficiency. This is linked to the service offered by the technology. As already been mentioned, this element has been undermined and sometimes totally ignored by many models. DeLone and McLean (2003) define service quality as “the general support offered by the service provider” (p. 20). It is applicable regardless of whether the support is offered by a department within the organization or outsourced. Krishnan and Singh (2006) found that, “service quality is an old concept and it has always been ignored due to too much emphasis on the IT product and the technology itself” (p. 56).
Nonetheless, service quality is not easy to assess compared to product quality. This is attributed to the fact that service quality has numerous attributes that are unlike the product quality, for example, immaterialness, varied content and intertwined state (Handlogten, 2009, p. 29).
Mostly taking into account its immaterialness, service quality is harder to gauge. This is attributed to the absence of substantial evidence. The technology suppliers may find it difficult to comprehend clients’ perception of their service and service quality. When the suppliers know how a service is perceived by its clients, they will have the capacity to enhance the service while the clients will have the capacity to influence the measurements accordingly. This ideology is founded on the disinformation model, which states that the client’s satisfaction level is linked to the extent and bearing of the disinformation experience. Disinformation is associated with the individual’s earlier expectation (Handlogten, 2009, p. 30).
By concentrating just on the product characteristic of the technology, its achievement may be miscalculated (Ruta, 2005, p. 42). In order to capture this, service quality must be incorporated in the study as a construct to assess e-recruitment implementation success. Service quality is very crucial for poor service may cause massive loss of clients and revenue. This is attributed to the fact that IT increasingly becoming a determinant of the nature of the relationship that exists between companies and their clients (Ruta, 2005, p. 43).
A specific instrument was developed to measure service quality. The instrument is known as SERVQUAL or RATER. This is basically a quality management framework developed in the mid-80s by Parasuraman and his colleagues (Handlogten, 2009, p. 30). With the rise of e-business, organizations are increasingly collaborating with their clients via ICT channels. For this reason, the above instrument was developed to measure service quality delivered by ICT channels, as perceived by clients (Ruta, 2005, p. 43).
Earlier studies have shown that service quality increases client satisfaction and retention, and subsequently business performance (Handlogten, 2009, p. 31). Therefore, applying this concept to e-recruitment will be very crucial in motivating clients. In this case, the clients refer to the end-users of the e-recruitment system (DeLone & McLean, 2003, p. 21). Poor service quality can result in loss of clients since they may not be able to utilize the system or may decline to work with it. As a result, this could result of the lack of competitive advantage in the labor market or inefficient recruitment process. In summary, the technological strength of e-recruitment implementation relies on product quality and service quality.
E-recruitment management as a facilitator of e-recruitment implementation
As already been mentioned, management’s support is a crucial factor for e-recruitment implementation (Krishnan & Singh, 2006, p. 56). This subsection explores the role of management support in e-recruitment implementation. The implementation of new technology involves the formation of strategy, project definition and operational activities. All these require massive support from the management.
The project manager plays a very crucial role during the implementation process. A project manager who does not have the capacity to successfully manage the implementation process risk not meeting the target. This includes finishing the project on time and within the stipulated budget (Newton, 2006, p. 6). Project manager always acts as a team leader. Team members are also required to have the requisite knowledge and skills because they also have a significant impact on the implementation process. Lack of requisite knowledge and skills on the part of the team members could lead to the inability to carry out the task at hand. In addition, project implementation requires an utmost commitment from the team members, which include the project manager. In case they are not, they may not deliver the promised scope (Newton, 2006, p. 7).
The success of the e-recruitment implementation also relies on meticulous planning (Handlogten, 2009, p. 31). Newton (2006) describes a project plan as “an expansive account of all the crucial activities that are required to conclude a project” (p. 18). Project planning includes collecting vital information relating to project duration, required resources, project team and their responsibilities and the implementation process. Project planning is part of the strategic management process, which involves the management, project team and experts.
Strategic management entails three major processes, namely: strategy formation, strategy implementation and reformulation of strategy. Strategy formation is further subdivided into three phases, that is, the creation of a strategic identity, execution of strategy analysis and formulation of strategy. The creation of a strategic identity is a cyclic process, which involves a continuous exchange of information from the different life cycle (Boxall & Purcell, 2003, p. 23).
The creation of a strategic identity and strategy analysis is regarded by many as the most difficult phase of e-recruitment implementation process. The creation of a strategic identity involves putting together a mission, vision and strategic intent. The vision and mission must be consistent with organizational values. It also involves the identification of the core competencies and capabilities of an organization (Parry & Tyson, 2008, p. 160; Boxall & Purcell, 2003, p. 24). Strategy analysis entails analysis of internal and external environmental factors (industry foresight), identification of the existing concepts and capabilities, and identification of the requisite concepts (Boxall & Purcell, 2003, p. 25).
On the other hand, strategy implementation is subdivided into significant phases. They include articulation and codifying of strategy, evaluation of strategies, elaboration of the strategies, and promotion of the strategies and the execution of the strategies (Boxall & Purcell, 2003, p. 25). Strategy articulation refers to the externalization of the strategy and its implementation in an overt manner. Codification, on the other hand, refers to the translation of strategies into tangible and measurable objectives. The evaluation process looks for consistency, consonance, competitive advantage and viability of the strategy. Strategy elaboration encompasses the transformation of strategy into executable and outfitted (Boxall & Purcell, 2003, p. 26).
Strategy promotion refers to far-reaching and calculated campaign to the acknowledgment of the novel strategy among the stakeholders. Last but not least, strategy execution entails strategy discharge and incessant control of strategic performance. Owing to constant changes in the internal and external environment, strategic re-evaluation, and re-formulation is very important. The revaluation process may be elicited by regular reassessment process, unproductive results, and a disparity between the expected and actual results and changes in the top management. It should be noted that an excellent strategy does not need continuous reformulation (Boxall & Purcell, 2003, p. 26).
Information Technology and Personnel Management
Because of the significance of human capital in the implementation of corporate strategy, a rational role of HR is to be part of the development and carrying out of the strategic process. Therefore, the HR department should act as a strategic partner to the organization and not a mere administrative service provider as being experienced in many organizations presently. Corporate strategy is described as the company’s targets and how they are to be achieved, and it is the latter part that the HR department should put emphasis on. The HR department ensures that the company has enough capabilities to effectively carry out its strategies. However, this calls for the reorganization of the company than the reorganization of the HR as an administrative function. The reorganization involves embracing new technologies in the HR processes.
Panayotopoulou et al. (2005) carried out a study to establish the relationship between information technology and Human Resource Management (HRM). They established that “the collaboration between information technology and HRM is crucial in the adoption of e-HRM” (p. 280). For that reason, the collaboration between IT and HRM guarantees inclusion of e-recruitment into the HR process (Krishnan & Singh, 2006, p. 54). Panayotopoulou et al. (2005) found that, “the right collaboration between the two is a response for the ever-increasing demand for quality service” (p. 280). Taking this into consideration, needs assessment is crucial in the collaboration between IT and HRM so as to identify what is required of the system. Proper need assessment will guarantee delivery of correct needs (Panayotopoulou et al., 2005, p. 280).
Studies on e-HRM show that the HR division did not have a chance to choose the package they would prefer to implement as per their needs. As a result, there was a lack of congruence between system needs and capacity, which made it impossible to integrate the system into the HR processes. Subsequently, this led to poor service quality (Handlogten, 2009, p. 31). Increased training transformed the conventional HR set-up into e-HR. Enhanced knowledge and skills led to the optimal utilization of the system features (Panayotopoulou et al., 2005, p. 280).
Numerous studies, particularly management and marketing studies have been carried out on the inter-business relationship between online recruitment agencies and businesses across the globe. Inter-business outsourcing relationship was derived from the concept of outsourcing and partnering. They define inter-business outsourcing relationship as a linkage between service providers and clients arising from the contractual agreement. The contractual agreement highlights the benefits to be attained by each party. The relationship/partnership between IT outsourcing firms and their clients helps in minimizing risks, increases predictability and, therefore, reduces uncertainty. Therefore, the outsourcing relationship has a significant impact on the outcome of the e-recruitment process.
Research Methodology
Introduction
The methodology is the process of instructing the ways to do the research. It is, therefore, convenient for conducting the research and for analyzing the research questions. The process of methodology insists that much care should be given to the kinds and nature of procedures to be adhered to in accomplishing a given set of procedures or an objective (Blanchard & Cathy, 2002). The purpose of this research proposal is to create a room for further research that will assess the relationship between the employees’ pay and their level of performance. Consequently, the research study is exploratory. Exploratory research studies provide researchers an opportunity to assess areas that have not been extensively researched (Saunders, Thornhill, & Lewis, 2009).
Therefore, engaging in exploratory studies contributes to the development of additional knowledge on the issue or phenomenon under investigation. This goal will be achieved by testing the stipulated hypotheses. To undertake the research study, a comprehensive research methodology will be integrated. This part includes the research design, the sample and the methods that were used in gathering information. It also contains the data analysis methods, validity and reliability of data and the limitation of the study.
Research Design
There are three types of research design: exploratory research, descriptive research and causal research (Blanchard & Cathy, 2002). Exploratory research mainly explores the nature of the problem in order to draw inferences. In this scenario, the researcher is in a good position to understand the problem under investigation. The flow of exploratory research involves identifying the problem and seeking to find the appropriate solutions and new ideas. Exploratory research is mostly applicable in circumstances where the structure of the research problem is not definite. The interview is a good example of the methods that will be used to gather information in this kind of research.
On the other hand, descriptive research is mostly applicable in circumstances where the structure of the research problem is explicit. This kind of research is used when the researcher expects to distinguish the various observed facts in a sample or a population. In addition, descriptive research is normally used by the researcher when the researcher has a prior understanding of the problem under investigation. Causal research is the kind of research whereby there is a clear structure of the research problem. In this case, the researcher is interested to explore on the cause-effect relationship. The causes are identified, analyzed and the extent of the effects is reviewed (Blanchard & Cathy, 2002).
Considering the exploratory nature of the research study, the research will adopt the mixed research design. The study will take into account the qualitative and quantitative research designs. The choice of the mixed research design has arisen from the need to improve the quality of the research study. First, the integration of the qualitative research design will aid in the generation of adequate data from the field to support the study. Moreover, the research will have an opportunity to collect data from the natural setting, hence improving the relevance of the research study. In the course of implementing the qualitative research design, the study will take into account the grounded theory.
Strang (2015) found out that “the grounded theory entails the discoveries from facts that are systematically obtained from social research with the objective of developing a theory” (p. 449). Subsequently, incorporation of the grounded theory in the qualitative research design will enable the research to elucidate the issue under investigation. For example, the research study will contribute to a further understanding on the importance of adopting a multi-dimensional approach in formulating the employee compensation policies. Conversely, the quantitative research design will aid in improving the effectiveness with which the research data are analyzed and interpreted by the target research audience such as organizations human resource managers.
Case Study Approach
The case study is an approach of methodology that is applied when a comprehensive research or investigation is required. The case study is widely applied in sociological studies, but of late it is commonly applied in research institutions. Case study approach has procedures to be followed; hence, the researcher is required to stick to the guiding rules and principles so as to produce the best results. Through a case study approach, the researcher has access to a wide range of data sources; as a result of this, case study results are always very comprehensive and in-depth.
The case study research does not entail sampling; hence it is beneficial to select the cases in a relevant manner in order to maximize on what should be learnt. Through a case study approach, relevant issues that form the basis of the study are thoroughly exploited. In addition, issues that appear to be more complex are brought to light through the use of case study as a research approach. The basic steps to be followed when structuring a case study approach are: the research questions should be clearly stated and defined, choose the cases and the data collection and analysis techniques, arrange to gather data, process and analyze the collected data, and make a report with regard to the analyzed data.
Population and Sampling
There are two popularly used procedures for sampling. The sampling procedures include prospect sampling and non-prospect sampling. In a probability sampling procedure, the samples are representative of the population. This is because all the entries have a chance of being selected. On the other hand, items in the non-probability sampling do not have an equal chance. In this scenario, all the items in the population do not have equal chances of being selected. The data for the study was collected among the employees of the organization under study. The employees were used because their profiles fit the context of this study. Therefore, the employees were an excellent choice due to the fact that many of them have had the organization experience. Due to the fact that all the employees could not be accessible, a non-probability sampling procedure was employed in this study.
A pilot test was conducted in order to ensure that the questionnaires were reliable and valid. After the pre-test, the questionnaire was edited by removing and changing some words. A pre-test was done again to ten additional respondents just to be sure that the questionnaire was now very reliable and very valid. The study targeted employees who work with an organization in Saudi Arabia. The organization preferred to remain anonymous, thus, for the sake of this study the organization will be known as ‘Organization A’ as the study population. Considering the fact that Organization A is a big entity, the research intended to evaluate the application of pay on employee performance.
The choice of Organization A has arisen from the fact that it has integrated high pay as one of its employee motivation strategies. Conducting a study on the entire population is not manageable due to the high cost and the amount of time that has to be spent. Consequently, the research study will take into account the sampling technique. To make the study manageable scholars found that “the research will integrate the simple random sampling technique in constructing the research sample” (Scott, 2011, p. 90).
This technique will ensure that bias in conducting the study is eliminated. A sample of 169 respondents who will be selected from Organization A will be developed. The study will take into account both males and females in constructing the research sample. The study assumes that the selected research sample will be representative of the workforce perception of the relationship between pay and performance. The choice of these regions has arisen from the need to understand the impact of social and cultural diversity on the employee perception and hence performance.
Data Collection and Instrumentation
In any research that is conducted, there are basic stages that are involved in regards to the shaping of the research. These stages include: understanding the research problem, the conceptual framework of the research, data collection, data analysis and interpretations, and drawing inferences and making recommendations. In this study, quantitative research method was used to test the hypotheses that were formulated. The quantitative research method is very instrumental in harnessing mathematical models that are enshrined to natural facts. This type of research can be measured and the researcher is able to construct a conceptual framework using the existing theories.
The adoption of primary sources played a fundamental role in improving the relevance of the research findings. To collect data from the field, the interviewing technique was integrated. Consequently, a set of questionnaires was developed. The questionnaires acted as a guide in conducting the interview. The questionnaires were mainly composed of open-ended questionnaires to provide the respondents an opportunity to answer the required issues based on their opinion. The questionnaires were administered to the respondents directly through online media. Thus, the data collection method entailed an online survey. Adopting this method of administration is informed by the need to minimize the cost of the study considering the fact that respondents are geographically dispersed.
Data Analysis and Presentation
The collected data will be analyzed quantitatively. This goal will be achieved by incorporating quantitative data analysis tools such as tabulation, use of graphs, percentages, and charts. Considering the fact that the research study has integrated the qualitative research design, the data analysis and presentation method will entail the adoption of the textual presentation technique. This technique will be implemented by using statements that comprise numerals.
One of the textual presentation tools that will be adopted in analyzing the research data entails the Likert scale. By using this tool, the research will be in a position to evaluate the qualitative data using point scales such as the 5-point Likert scale. In addition to the above technique, the research will integrate the Microsoft Excel data analysis technique. The adoption of this technology will play a fundamental role in improving the effectiveness and efficiency with which the collected data will be analyzed using tables, charts, and graphs. Moreover, incorporation of the Microsoft technique will play a fundamental role in improving the ease with which the research data will be interpreted.
Limitations of the study
There have been a considerable measure of concerns on extra-budgetary costs of gathering of the information, paying little mind to whether the accumulated information is truly genuine or not and whether there may be an unequivocal conclusion when translating and breaking down the information. What’s more, a few representatives were hesitant to offer some data that was private and perilous in the hands of their rivals. This represented an extraordinary test in the examination as the specialist needed to take a more drawn out time to discover workers why should willingly give out sufficient data.
Findings, Data Analysis and Interpretation
Introduction
This section covers the analysis of the data, presentation and interpretation. The results were analyzed using SPPS, ANOVA, regression and correlation analysis.
Characteristics of the sample
In order to understand the demographic information about the participants, the distribution of gender, age, education level, income, and time period employed in the Organization A are summarized in the following sections.
Gender
Table 4.1 Gender distribution
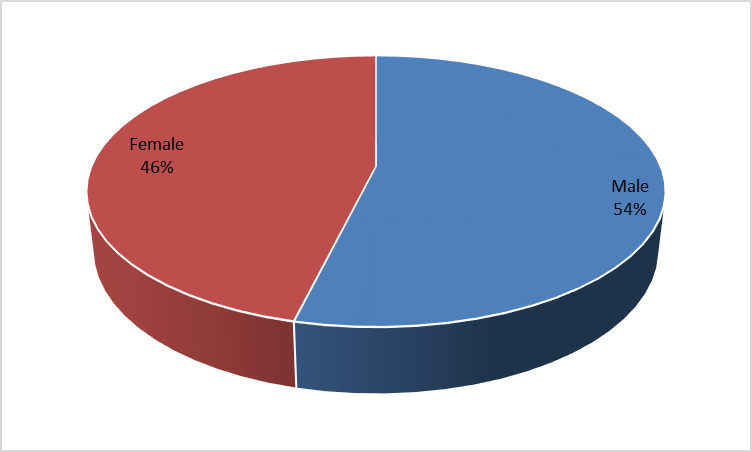
The distribution of gender is summarized in Table 4.1 and Figure 4.1, according to the results; there are 78 females and 91 males, composed 46.2% and 53.8% of the sample respectively.
Age
Table 4.2 Age distribution
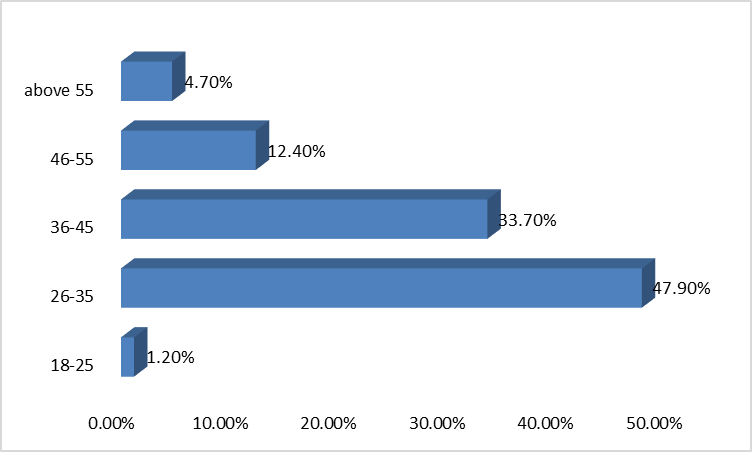
The distribution of age is summarized in Table 4.2 and Figure 4.2 above. According to the results, there are 47.9% of the participants aged between 26 and 35, which is the largest proportion, followed by participants aged between 36 and 45, composed 33.7% of the sample, and participants aged between 46 and 55, accounted 12.4% of the sample. Finally, participants aged above 55 or between 18 and 25 composed 4.7% and 1.2% of the sample respectively.
Education level
Table 4.3 Education distribution
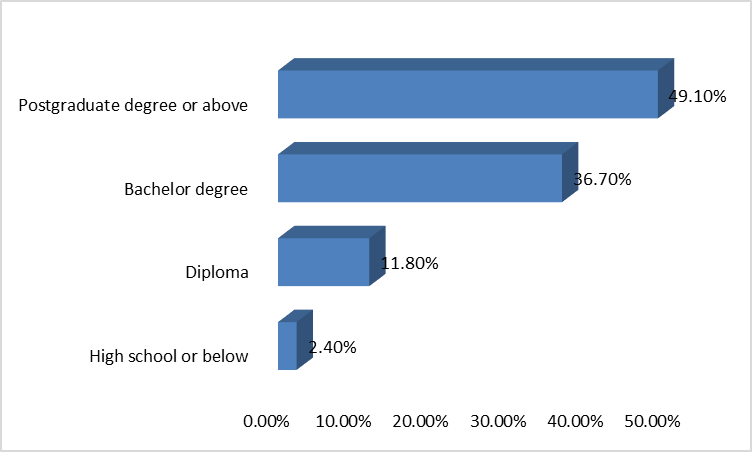
In terms of the education level, nearly half of the participants (49.1%) have a postgraduate degree or above, which is the largest proportion, followed by participants who have a bachelor degree, composed 36.7% of the sample, and participants who have a diploma, composed 11.8% of the sample. There are only 2.5% of the participants have high school or below degree.
Income
Table 4.4 Income distribution
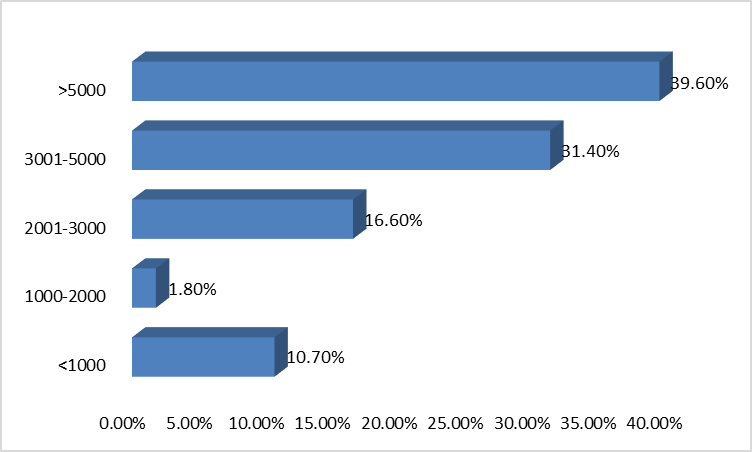
Regarding the income of the participants, 39.6% of the participants indicate that they have income above 5000, which is the largest proportion, followed by participants who have income between 3001 and 5000, composed 31.4% of the sample, and participants who have income between 2001 and 3000, composed 16.6% of the sample. There are 10.7% of the participants have income below 1000 and 1.8% of the participants have income between 1000 and 2000.
Time period employed in the Organization A
Table 4.5 Time period employed in the organization
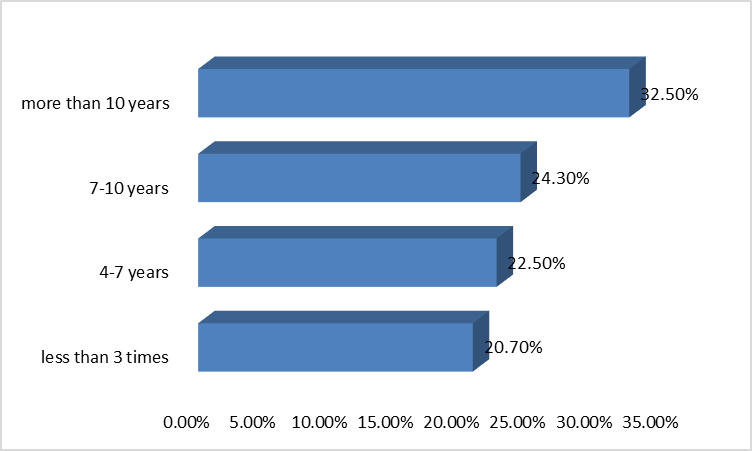
Table 4.5 and Figure 4.5 above summarized the time period the participants have been employed in the Organization A. According to the results, 32.5% of the participants have stayed more than 10 years, which is the largest proportion, followed by participants who have stayed between 7 and 10 years, composed 24.3% of the sample, and participants who have stayed between 4 and 7 years, composed 22.5% of the sample. In addition, there are 35 participants have stayed Organization A less than 3 years, comprised 20.7% of the sample.
Reliability Analysis
Reliability analysis is often used to evaluate whether the multiple instrument items are measuring the same variable or concept (Blanchard & Cathy, 2002). In SPSS, the Cronbach’s Alpha value is normally used to measure the reliability of the various variables. The minimum requirement for the value of Cronbach’s Alpha is 0.7 to ensure that the items are internally consistent and reliable. In the exploratory study, the Cronbach’s Alpha value of 0.6 can also be accepted. In this study, the various measurement items are adopted from previous studies, thus, the minimum value is set at 0.7. The corrected-item total correlation (CITC) is also included to evaluate the reliability of the individual item.
If the CICT is below 0.5, then the item cannot reliably measure the corresponding variable and should be excluded from further analysis (Blanchard & Cathy, 2002). The Cronbach’s Alpha if item deleted indicate whether the Cronbach’s Alpha value is decreased or increased after excluded this item. Thus, if this value is above the Cronbach’ Alpha value for the variable, the item should then be excluded from further analysis. Table 4.6 summarizes the results.
Table 4.6 Reliability Analysis for Variables
According to the results, the Cronbach’s alpha value of the Organization A knowledge, environmental concern, cost-saving, quality recruitment, quicker recruitment process, subjective norms, and success in finding the candidate are 0.836, 0.817, 0.761, 0.739, 0.898, 0.833, and 0.837, which are all above the minimum requirement of 0.7. In addition, the CICT for individual items are all above the minimum requirement of 0.5 and the Cronbach’s Alpha if deleted for individual items are all below the Cronbach’s Alpha value. These results demonstrate that these items are internally consistent and reliable, and can be used for further analysis.
Frequency analysis
Organization A’s knowledge frequency analysis
Table 4.7 The Organization A’s knowledge frequency analysis
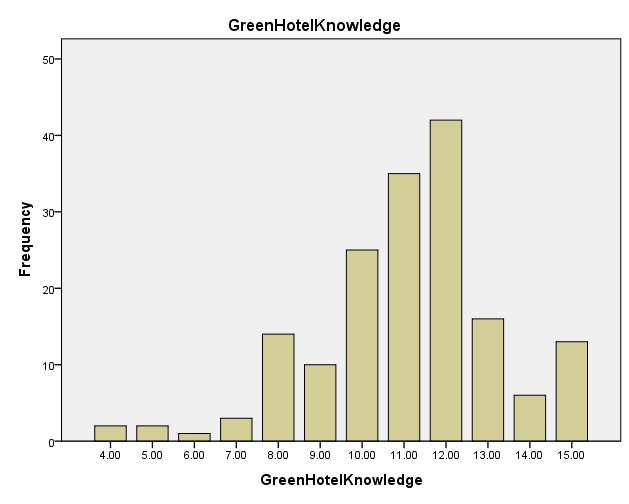
Figure 4.7: Organization knowledge.As can be seen from Table 4.7 and Figure 4.7, more than half of the participants are familiar with the Organization A knowledge. There are 52.1% of the participants indicate that “Compared to the average person, I am familiar with the organization’s human resources policies” and 46.2% of the participants indicate that “Compared to my friends, I am familiar with the organization’s compensation programs”. From the total score of these 3 items measuring Organization A’s knowledge, a large group of participants have a score of 11 or 12. To gain a clearer picture of the participants’ Organization A’s knowledge, the items measuring Organization A’s knowledge were aggregated. The aggregated mean value was 3.69, suggesting that participants have medium level knowledge of the Organization A.
Environmental concern frequency analysis
Table 4.8 Environmental concern frequency analysis
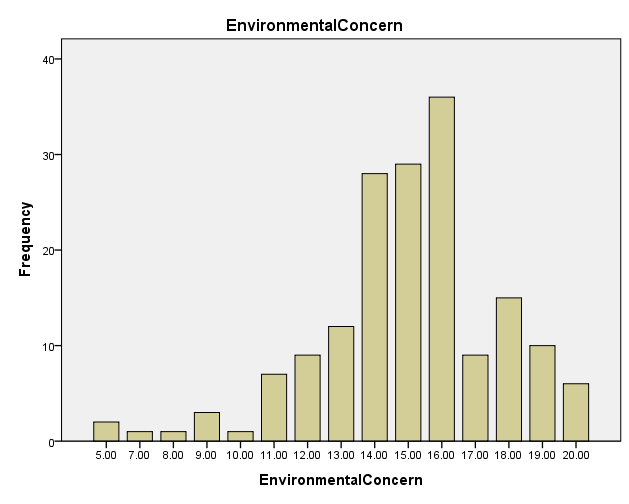
Table 4.8 shows the overall responses to the environmental concern among participants. According to the results, the mean value of all measurement items was between 3 and 4. Thus, the participants’ attitude, concern was at a medium level. By analysing the frequency, it can be seen that more than half of the participants have expressed their concern regarding the recruitment’s environmental problem. In order to gain a more detailed picture of the level of environmental concern, the aggregate mean score was classified into three levels: low (below 2), medium (2-4), and high (4-5). The aggregate mean score was 3.76, suggesting a medium level of environmental concern. The overall scores of the items measuring environmental concern were summarized, and it is found that the range was 16, with scores ranging from 5 to 20. The majority of the participants have an overall score between 14 and 16.
Cost-saving frequency analysis
Table 4.9 Cost-saving frequency analysis

Table 4.9 summarized the frequency analysis for items measuring cost-saving. According to the results, the majority of the participants agree or strongly agree that “This Organization A offers a good service that is worth its recruitment costs”, “The recruitment costs are acceptable”, and “Compared to the recruitment costs of other organizations, this Organization A incurs fair costs”. The aggregated mean value of cost-saving is 3.98, nearly 4, suggesting that participants have a positive attitude towards the cost-saving of the Organization A. Figure 4.9 summarized the score of the items measuring cost-saving. As can be seen from the results, the majority of the score ranged between 10 and 15, indicating a relatively higher level positive attitude towards cost-saving.
Quality recruitment frequency analysis
Table 4.10 Quality recruitment frequency analysis
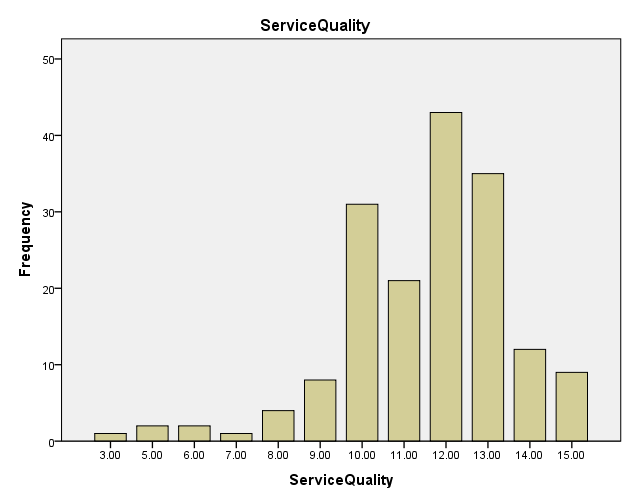
Table 4.10 summarized the frequency analysis for items measuring quality recruitment. According to the results, more than half of the participants agree or strongly agree that “The e-recruitment processes are reliable and helpful”, “The e-recruitment processes are professional”, and “The e-recruitment processes respond to inquiries quickly”. The aggregated mean value of cost-saving is 3.85, suggesting that quality recruitment is at medium to high level. Figure 4.10 summarized the score of the items measuring quality recruitment. As can be seen from the results, the majority of the score ranged between 10 and 13, which also indicate a medium to high level quality recruitment perception.
Quicker recruitment process frequency analysis
Table 4.11 Quicker recruitment process frequency analysis
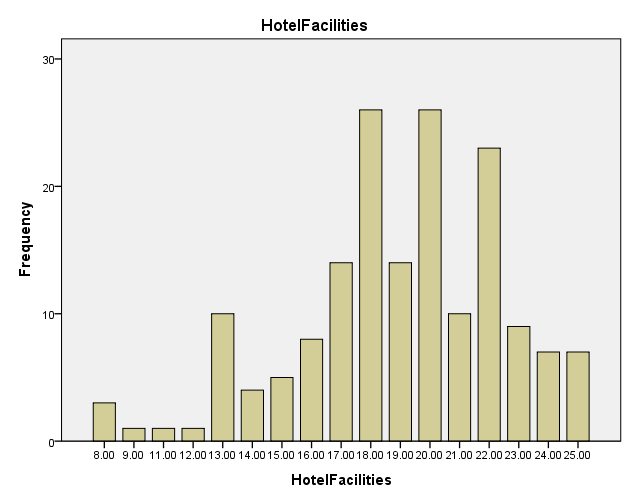
Quicker recruitment
Table 4.11 summarized the frequency analysis for items measuring quicker recruitment process. According to the results, more than half of the participants agree or strongly agree that “The e-recruitment processes is comfortable”, “The e-recruitment processes is efficient”, “The e-recruitment processes is flexible”, “The e-recruitment processes is appropriate”, “The e-recruitment processes is better”. The aggregated mean value of cost-saving is 3.79, suggesting that the quicker recruitment process is at medium to high level. Figure 4.11 summarized the score of the items measuring organization facility. As can be seen from the results, the majority of the score ranged between 18 and 22, which also indicate a medium to high level organization facility perception.
Subjective norms frequency analysis
Table 4.12 Subjective norms frequency analysis
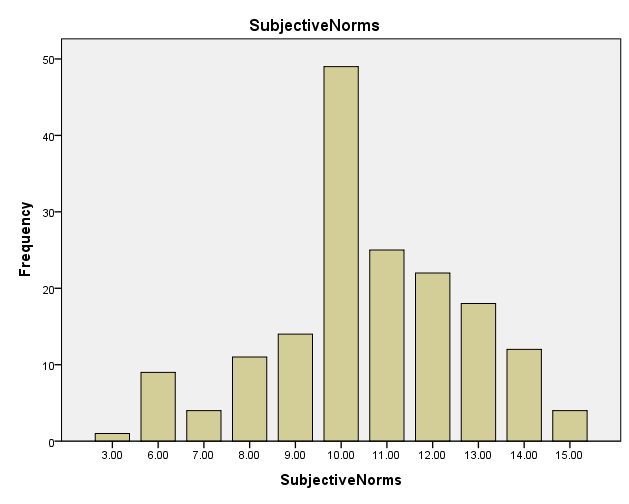
Table 4.12 summarized the frequency analysis for items measuring subjective norms. According to the results, less than half of the participants agree or strongly agree that “Most stakeholders who are important to the organization think the organization should implement e-recruitment”, “Most stakeholders who are important to the organization would want the organization to continue using e-recruitment”, “Stakeholders whose opinions the organization values would prefer that the organization should only use e-recruitment”. The aggregated mean value of cost-saving is 3.53, suggesting that the subjective norms are at medium level. Figure 4.12 summarized the score of the items measuring subjective norms. As can be seen from the results, the majority of the score ranged between 10 and 11, which also indicate medium level subjective norms.
Success in finding the candidate frequency analysis
Table 4.13 Success in finding the candidate frequency analysis
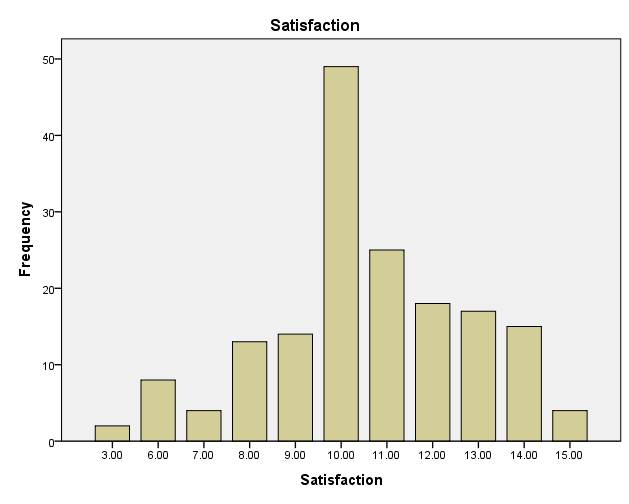
Table 4.13 summarized the frequency analysis for items measuring success in finding the candidate. According to the results, nearly half of the participants agree or strongly agree that “Overall, I am satisfied with the e-recruitment process in this Organization A”, “I am glad to use the e-recruitment process in the Organization A”. The aggregated mean value of cost-saving is 3.52, suggesting that the subjective norms are at medium level. Figure 4.13 summarized the score of the items measuring success in finding the candidate. As can be seen from the results, the majority of the score ranged between 10 and 11, which also indicate a medium level success in finding the candidate.
Correlation analysis
Correlation between Organization A knowledge and Success in finding the candidate
In order to check the correlation between Organization A knowledge and success in finding the candidate, a scatter plot was first created in order to ensure that there was not a violation of the assumptions of normality, linearity and homoscedasticity among the data. As seen in Figure 14 below, there is a strong, positive correlation between the variables of Organization A knowledge and success in finding the candidate and the data is normally distributed.
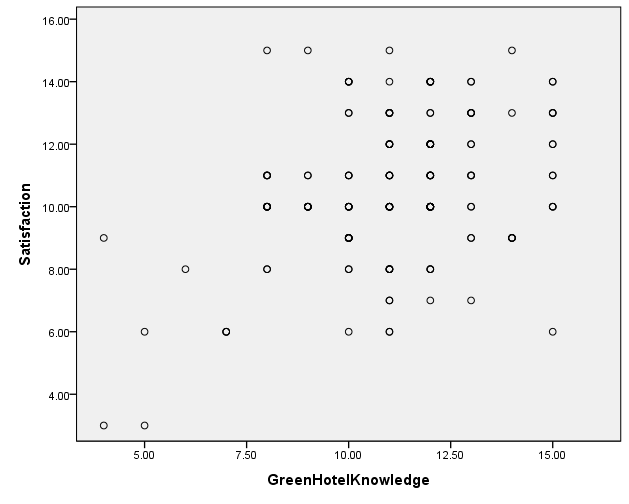
After inspecting a positive correlation between Organization A knowledge and success in finding the candidate, a Pearson product-moment correlation coefficient was carried out to analyze the relationship between Organization A knowledge and customer success in finding the candidate. The results are shown in table 4.14 above. The correlation value below 0.3 indicates low level correlation; the correlation value between 0.3 and 0.6 indicates medium level correlation, while the correlation value above 0.6 indicates higher level correlation. As can be seen in Table 4.14, there was a medium positive correlation between Organization A knowledge and success in finding the candidate, with a correlation value of 0.373, which is significant at 0.01 levels, indicating that higher levels of Organization A knowledge is associated with higher levels of customer success in finding the candidate.
Table 4.14 Correlation between Organization A knowledge and Success in finding the candidate
The correlation between Environmental Concern and Success in finding the candidate
In order to check the correlation between Organization A knowledge and success in finding the candidate, a scatter plot was created. As seen in Figure 4.15 below, there is a strong, positive correlation between the variables of environmental concern and success in finding the candidate and the data is normally distributed.
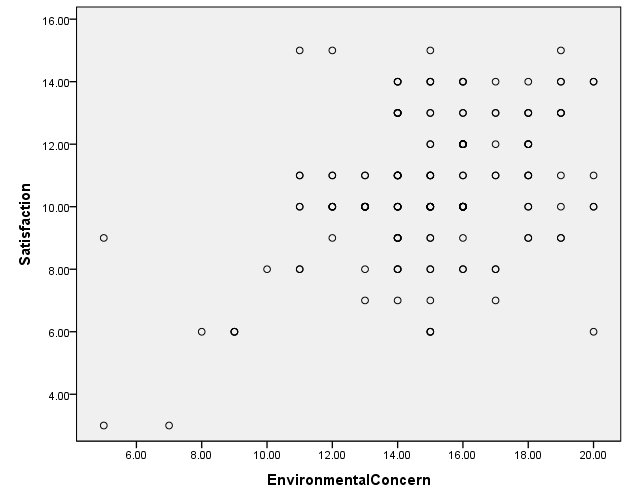
After inspecting a positive correlation between environmental concern and success in finding the candidate, a Pearson product-moment correlation coefficient was carried out to analyze the relationship between environmental concern and customer success in finding the candidate. The results are shown in table 15 below. As can be seen in Table 15, there was a medium positive correlation between environmental concern and success in finding the candidate, with a correlation value of 0.313, which is significant at 0.01 level, indicating that higher levels of environmental concern is associated with higher levels of customer success in finding the candidate.
Table 4.15 The correlation between Environmental Concern and Success in finding the candidate
The correlation between Cost-saving and Success in finding the candidate
In order to check the correlation between a fair wage and success in finding the candidate, a scatter plot was created. As seen in Figure 16 below, there is a strong, positive correlation between the variables of cost-saving and success in finding the candidate and the data are normally distributed.
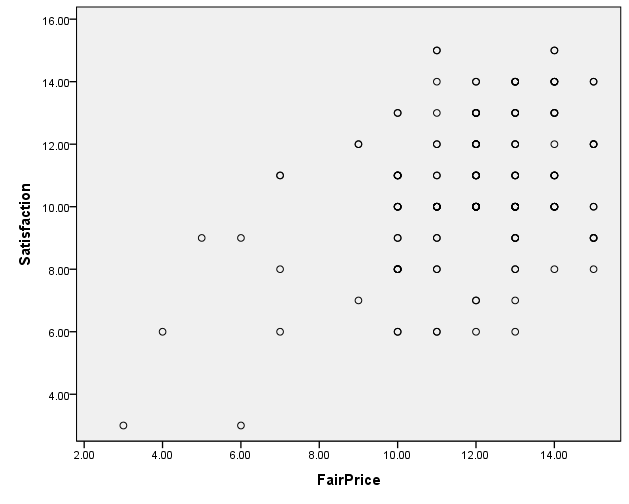
After inspecting a positive correlation between a fair wage and success in finding the candidate, a Pearson product-moment correlation coefficient was carried out to analyze the relationship between cost-saving and customer success in finding the candidate. The results are shown in table 16 below. As can be seen from this table, there was a medium positive correlation between a cost-saving and success in finding the candidate, with a correlation value of 0.412, which is significant at 0.01 level, indicating that higher levels of cost-saving is associated with higher levels of customer success in finding the candidate.
Table 4.16 Correlation between Cost-saving and Success in finding the candidate
The correlation between Quality recruitment and Success in finding the candidate
In order to check the correlation between quality recruitment and success in finding the candidate, a scatter plot was created. As seen in Figure 4.17 below, there is a strong, positive correlation between the variables of quality recruitment and success in finding the candidate and the data is normally distributed.
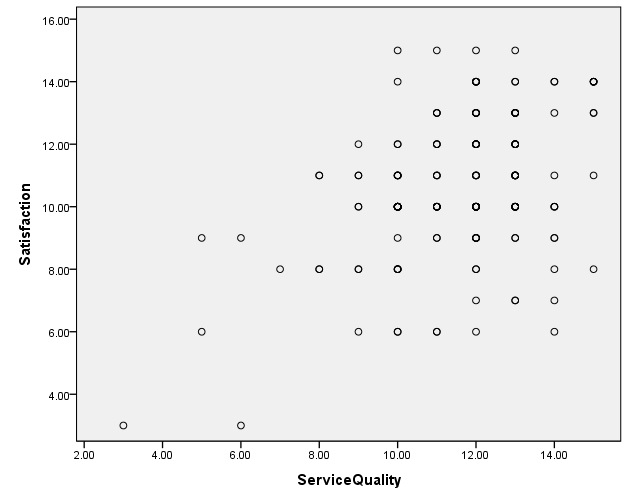
After inspecting a positive correlation between quality recruitment and success in finding the candidate, a Pearson product-moment correlation coefficient was carried out to analyse the relationship between quality recruitment and customer success in finding the candidate. The results are shown in Table 4.17 below. As can be seen from this table, there was a medium positive correlation between quality recruitment and success in finding the candidate, with a correlation value of 0.409, which is significant at 0.01 level, indicating that higher levels of quality recruitment is associated with higher levels of customer success in finding the candidate.
Table 4.17 Correlation between Quality recruitment and Success in finding the candidate
Correlation between Quicker recruitment process and Success in finding the candidate
In order to check the correlation between quicker recruitment process and success in finding the candidate, a scatter plot was created. As seen in Figure 4.18 below, there is a strong, positive correlation between the variables of quicker recruitment process and success in finding the candidate and the data is normally distributed.
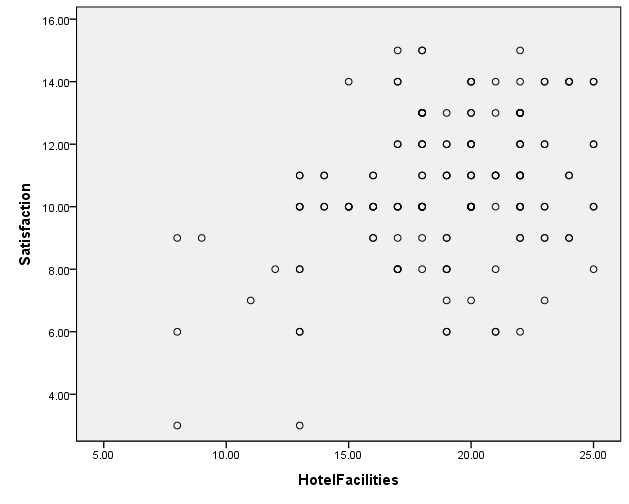
After inspecting a positive correlation between quicker recruitment process and success in finding the candidate, a Pearson product-moment correlation coefficient was carried out to analyze the relationship between quicker recruitment process and customer success in finding the candidate. The results are shown in Table 4.18 below. As can be seen from this table, there was a medium positive correlation between quicker recruitment process and success in finding the candidate, with a correlation value of 0.455, which is significant at 0.01 level, indicating that higher levels of the quicker recruitment process is associated with higher levels of customer success in finding the candidate.
Table 18 Correlation between Quicker recruitment process and Success in finding the candidate
The correlation between Subjective norms and Success in finding the candidate
In order to check the correlation between subjective norms and success in finding the candidate, a scatter plot was created. As seen in Figure 4.19 below, there is a strong, positive correlation between the variables of subjective norms and success in finding the candidate and the data is normally distributed.
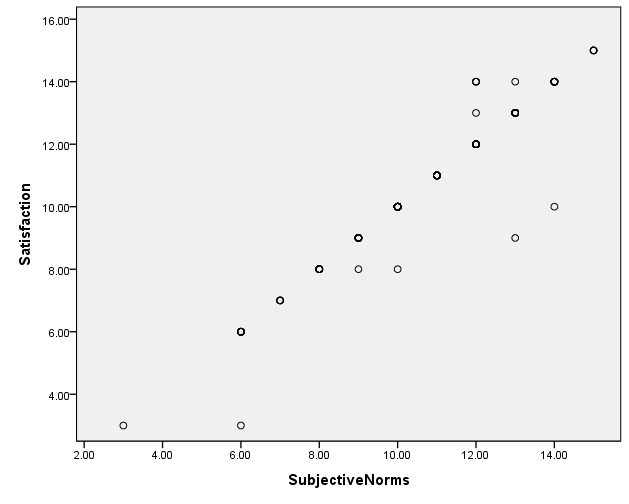
After inspecting a positive correlation between subjective norms and success in finding the candidate, a Pearson product-moment correlation coefficient was carried out to analyse the relationship between subjective norms and customer success in finding the candidate. The results are shown in table 19 below. As can be seen from this table, there was a strong positive correlation between subjective norms and success in finding the candidate, with a correlation value of 0.765, which is significant at 0.01 level, indicating that higher levels of subjective norms is associated with higher levels of customer success in finding the candidate.
Table 4.19 Correlation between Subjective norms and Success in finding the candidate
Regression analysis
Regression analysis is a statistical process for estimating the relationships among variables (Blanchard & Cathy, 2002). More specifically, regression analysis is normally used to understand how the change of independent variables can affect the change of dependent variables (Blanchard & Cathy, 2002). The correlation analysis above indicated that there are relationships between subjective norms, quicker recruitment process, Organization A knowledge, cost-saving, quality recruitment, environmental concern and success in finding the candidate. In order to find out how these variables influence customer success in finding the candidate and which one has the biggest impact, the multiple-linear regression is used.
Table 4.20 Model Summary
The Adjusted R Square is 0.536, which means that the independent variables of subjective norms, quicker recruitment process, Organization A knowledge, cost-saving, quality recruitment, and environmental concern can explain 53.6% of the variance of success in finding the candidate.
Table 4.21 ANOVA
By summarizing the ANOVA table, it can be said that the independent variables of subjective norms, quicker recruitment process, Organization A knowledge, cost-saving, quality recruitment, and environmental concern can predict the dependent variable of success in finding the candidate at a significance of 0.01, by considering F=411.961.
Table 4.22 Coefficients
The regression results are summarized in Table 4.22 above. According to the results, there is no collenearity problem among the independent variables as the VIF values for all independent variables are less than 10 and the Tolerance value for all variables are above 0.1. It is found that subjective norms, quicker recruitment process, Organization A knowledge, cost-saving, quality recruitment, and environmental concern can significantly impact success in finding the candidate, with sig values all less than 0.05. Specifically, subjective norms have the biggest impact on success in finding the candidate, with a standardized coefficient value of 0.437, followed by a quicker recruitment process, with a standardized coefficient value of 0.424 and cost-saving, with a value of 0.334. The environmental concern has the smallest impact on success in finding the candidate, with a standardized coefficient value of 0.212.
Conclusions and Recommendations
Introduction
This chapter presents the conclusion and the recommendations of the findings and of the results in accordance to the objectives of this study.
Conclusion and recommendations
There are a number of reasons why many organizations are gradually embracing e-recruitment process. Various researchers have carried out a research to establish the benefits of e-recruitment methods in the United Kingdom. The study focused on the HR managers and had over 25 thousand respondents. The respondents were from nearly 1000 organizations. The study established that the most significant reason for the use of e-recruiting methods is cost efficiency (80%), followed by ease of access by applicants (60%), access to a larger pool of candidates (50%), and greater success in finding the right candidates (49%). The findings show that most respondents admitted that e-recruitment was a success (65%), and only a small section thought it was unsuccessful (15%).
However, most of these studies were not clear on the definition of success. They defined success based on a solitary item and how the respondents categorized the organization’s effort to obtain and execute the e-recruiting process. The responses were measured on a Likert scale. The scales also ranged from “very successful” to “very unsuccessful”. The statements used to gauge the participants’ attitude towards the organization. However, some studies are not specific about the definition of success. They are hinged on the supposition that human resource is context-specific. For this reason, success is based on diverse conditions.
The study found that success is not guaranteed in all e-recruitment cases; the success of an e-recruitment system depends on the implementation process. Therefore, the efficiency of the e-recruitment process relies on the implementation process, rather than the system itself. It is believed that the success of the e-recruitment process is hinged on comprehensive planning and employment of customary HR practices. He adds that organizations can only realize success if they embrace suitable strategies during the implementation process.
Therefore, implementation can be regarded as a very significant aspect of the e-recruitment process. Even though implementation is one of the crucial components of the e-recruitment process, it has been ignored by many studies. Despite acknowledging the significance of e-recruitment implementation, there are very few results on the same. In addition, most studies focus on the applicants’ point of view, instead of the organizations’. Nonetheless, studies on e-recruitment process are still limited. After more than ten years, little has changed and many people are still uninformed about e-recruitment.
This can be confirmed by findings from numerous studies. In addition, most studies emphasize on the applicant’s point of view and paying less attention to the employer’s perspective. Nonetheless, most of these studies acknowledge the significance of implementation in the e-recruitment process. However, studies on e-recruitment implementation are also. For this reason, the study will add to the body of knowledge relating to the implementation of the online recruitment process with our focus on Saudi Arabia. The paper will be distinguished by a number of foci. First, it will emphasize on the implementation of online recruitment itself. The second focus will be on providing more insight on e-recruitment implementation in Saudi Arabia from the government and corporate point of view.
References
Alhamad, H.S. (2014). The labor market in Saudi Arabia: Foreign Workers, Unemployment, and Minimum Wage. Web.
Blanchard, K., & Cathy, T. S. (2002). The Generosity Factor: Discover the Joy of Giving Your Time, Talent, and Treasure. Oxford: Oxford University Press. Web.
Boxall, P., & Purcell, J. (2003). Strategy and Human Resource Management. Hampshire: Palgrave MacMillan. Web.
Cappelli, P. (2001). Making the most of On-line recruiting. Harvard business review, 79, 139 – 146. Web.
Chartered Institute of Personnel Development. (2007). Recruitment and Retention 2007, London: CIPD. Web.
DeLone, W.H., & McLean, E.R. (2003). The DeLone and McLean model of information systems success: a ten-year update. Journal of management information systems, 19 (4), 9 – 30. Web.
Fawzi, N., & Almarshed, S. (2013). HRM Context: Saudi Culture, “Wasta” and Employee Recruitment Post Positivist Methodological Approach, the Case of Saudi Arabia. Journal of Human Resource Management and Labor Studies, 1(2), 1-14. Web.
Handlogten, C. (2009).Implementation of e-recruitment: enablers and success indicators (Master Thesis. University of Twente, Twente, Holland). Web.
Krishnan, S.K., & Singh, M. (2006). Issues and concerns in the implementation and maintenance of HRIS. Indian Institute of Management. Web.
Newton, R. (2006). Project management: Five Steps to Make a Success of Each Project. Amsterdam: Pearson Education Benelux. Web.
Panayotopoulou, L., Vakola, M., & Galanaki, E. (2005). E-HR adoption and the role of HRM: evidence from Greece. Personnel review, 36 (2), 277 – 294. Web.
Parry, E. (2006). Drivers of the adoption of online recruitment – an analysis using diffusion of innovation theory. Cranfield, Bedford: Cranfield School of Management. Web.
Parry, E., & Tyson, S. (2008). An analysis of the use and success of online recruitment methods in the UK. Human resource management journal, 18 (3), 257 – 174. Web.
Pin, J. R., Laorden, M., & Sáenz-Diez, I. (2001). Internet recruiting power, opportunities and effectiveness. International Research Centre on Organizations. Web.
Ruta, C. D. (2005). The application of change management theory to HR portal implementation in subsidiaries of multinational corporations. Human resource management,44 (1), 35 – 53. Web.
Saunders, M., Thornhill, A., & Lewis, P. (2009). Research Methods for Business Students. New York, NY: Prentice Hall. Web.
Scott, S. (2011). Research Methodology: Sampling Techniques. Journal of Scientific Research, 2(1), 87-92. Web.
Strang, K. (2015). The Palgrave handbook of research design in business and management. New York, NY: Palgrave Macmillan. Web.
United Nations. (2012). E-Government Survey 2012: Leveraging e-government at a time of financial and economic crisis, Department of Economic and Social Affairs. New York: Division for Public Administration and Development Management. Web.