Lake Ecosystem
Comparisons of Lake Ecosystem with the grasslands ecosystem
Many kinds of ecosystems exist on the earth, which is mainly generated by different factors in the environment. Grasslands and lakes two major types of ecosystems commonly found at different parts of the earth, sometimes being integrated or in neighborhoods or even being separate and neighbored by other types of ecosystems. It thus appears that due to the closeness or separation of the two ecosystems, several similarities and differences are overtly present.
In the lake ecosystem, water is the most important medium for the support of the floral and faunal lives. While it’s used by the biotic part in the ecosystem for their physiological process, it’s also used for the physical support of the living part of the ecosystem, the floral lives in particular. Unlike the lake ecosystem, the main live supporting medium in the grassland ecosystem is soiled on which numerous biotic and biotic factors are embedded Setzer, 1999)…
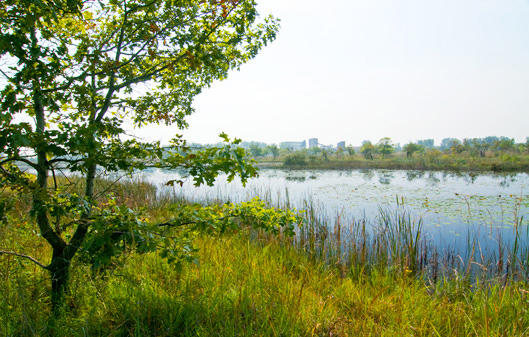
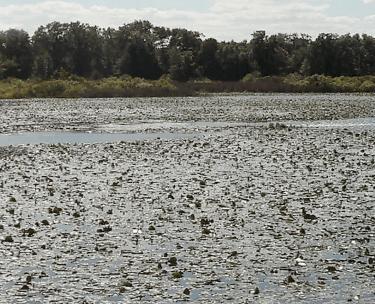
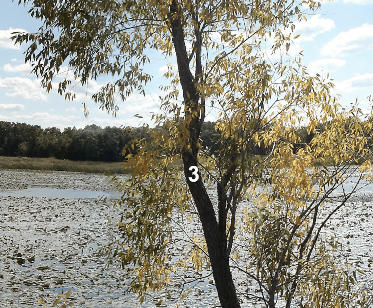
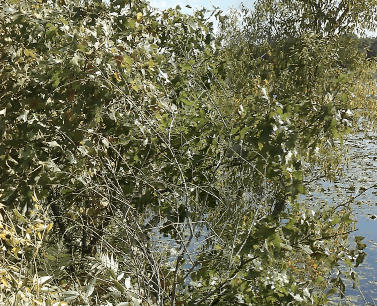
In the abundant fluid of water of the lake, there float several small plants which in some parts of the lake almost make the water surface to see in a blurred manner. Even though the lake had numerous types of plant species, trees were a rare type to spot particularly in the central portion, but a number of them clustered at the lake periphery. Similar to the lake ecosystem, there were a few trees that were evenly distributed in the entire region which depicted a kind of water inadequacy for tree support. Whereas the small emergent plants, the sub-emerged and those loosing embedded beneath the sea soil were the key producers in the water ecosystem, the dwarf trees intermingled in the vast tall grasses were the prime producer of the food to support the large number of faunal lives inhabiting the ecosystem (Brown, 2001)…
Generally, the biological communities in the two ecosystems were composed of biotic factors of different classes, families, and genus. In both cases, mammals, reptiles, insects, amphibians, and birds were seen resting or wandering to get the best from their environment. Crabs, shrimps, snails, turtles could be major attracting objects that could make the tourists squander their days around and in the lake. Moreover, the variety of fish would not make the lake a place for the tourists, but together with the classes of faunal and floral lives, it will be the most favorable part for commercial fishers in search of fish tonnages. Perhaps, this is completely impossible for grassland dwellers.
Exercise 2. Ecological Processes during Ecosystem Formation and Development
Results
Table 1: The Five Ecosystems and the living organisms that inhabit them.
Table 2. Mode of Nutrition among organisms in identified Ecosystems.
Table 3. Trophic Levels in the Identified Ecosystems.
Pond ecosystem
Talking of ecosystems has not been uncommon to most of the people in the different field of study and profession, but most the people while referring to the widely known types of ecosystems including grasslands, rainforest, and sea or Lake Ecosystems. As a result of this, pond ecosystems are rarely studied causing a large proportion of the world population to know little about it. Though, pond ecosystem has got great similarities to those of the lake ecosystems, the topic on pond ecosystem has always been partially explored with those believed to have knowledge and experience either handling it narrowly and shallowly perhaps due to its sophisticated nature even though interesting when one understands its processes of formation (Brown, 2001)…
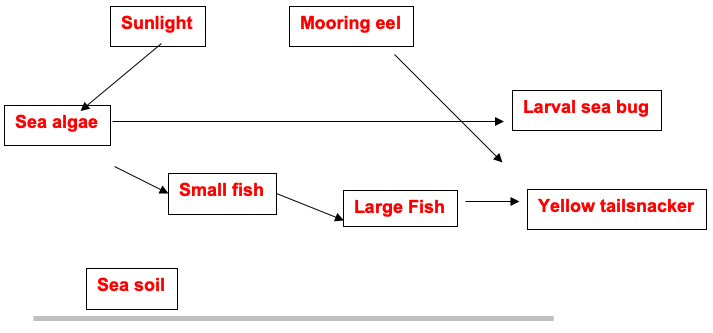
The complex pond communities found in the water system and their surrounding environment begins with a clear fluid medium (water), which eventually becomes turbid by the contamination with debris and minute seeds of different species. With the usual tendency of living things to create space and inhabit the place, aerial birds and terrestrial animals keep on visiting the water source, thereby deliberately dropping plant seeds and spores of all nature as they feed on water surface insects trying to breed on the water. The spores or seed dropped in the pond develops each into its kind. The debris from animal contamination and the pond surfaces form the attachment surfaces for the tiny floral part, but the algae which form the major portion of phytoplankton in the initial stage gets suspended or attached as a threat in the fluid water. The algal living organisms together with the film insects attract the small fish. The small fish feeds on both the algae and the surface insects, and this prevents the development of the algal bloom in the pond.
As the population of algal, fish and other tiny organisms in the pond water continues to increase with time, other floral and faunal species emerge due to the introduction of favorable supportive elements in the pond. The elodea, the pondweed, and other sub-emergent plants develop to increase the pond biodiversity.
During inhabitation of the pond by the different organisms, the pond depth continues to become diminished as much longer plants and larger animals from the mammalian and reptile classes become established and adapted to the pond environment. The depth reduction occurs due to augmented biotic activities including the increased deposition of animal debris as well as deposition from death and decay of the living organism. Also, the eutrophication of the pond is accompanied by the establishment of plants which are considered to have more complexity in their physiological systems. The woody plants which mostly are embedded in the soil at the bottom of the pond grow to a length of several meters (Brown, 2001)…
Overtly, the small fish gets attracted to the pond through the availability of certain factors that are necessary for its living. The Source of food is one of the key factors which determine the survival of the organism. Therefore, a pond organism interacts with each other in the search for food, water, or other factors necessary for their living. Some of them such as algae obtain the nutrients from the environment and synthesize their food. These are the primary producers of the pond ecosystem, meaning that all the other biota in the ecosystem depends directly or indirectly on their foods. The abiotic factors such as the sun, carbon dioxide, and water play a very important role in the manufacture of their food. The change of the concentration or intensity of any of these may increase or decrease the number of available foods for the organism which may be zooplankton, phytoplankton, or higher plant-like elodea and pine (Bartlett, (2002).
As the number of different species of plants and animals increases, the number of producers also increases both in number and type. Certainly, the primary producers are overwhelmed by the rapidly increasing number of primary consumers comprising of the beavers, small fish among others. The scarcity of food thus becomes a contributing factor bolstering both the interactions and dependencies of the various members of the biological communities. The algae, the elodea, and other organisms that manufacture their food or the autotrophs become stressed due to over-dependency from the primary consumers of small fish. While food for the primary consumers substantially reduces, their population also decreases and the large fish which feeds on them have insufficient food, hence, some would eventually die as others intensify their search for food and dependency on the primary producers. The red fox takes the opportunity of preying on the weakfish to satisfy its stomach, forgetting that these would soon be found in small numbers which would lead to its death and be broken or crushed by the scavengers. Though the red fox feeds on the flesh of small fish, it preys on beavers in times of extreme hunger, thus increasing the interactivity and networking with other living organisms in the ecosystem. This networking system for food is of great significance as each organism in the biological community has the authority and responsibility of monitoring and controlling the dominance of its intimate neighbors (Setzer, 1999)..
Energy pathways
The pond ecosystem has two major parts, the living and the non-living which contribute the energy required and distributes it. The sun generates the energy needed or used in the ecosystem through its energy capture by some of the floral living parts that carry out photosynthetic processes. The inability of some of the faunal living parts to photosynthesis creates the necessity of the living parts to depend on the floral parts or one another in one way or another for survival purposes. Members of the biotic part thus interact with one another through feeding dependency using different feeding modes such as the herbivorous, omnivorous, and carnivorous modes which are determined by feeding features possessed by the animal or organism. All the living organisms feed to obtain energy for their body metabolic processes. It is therefore through the feeding interaction of organisms that chemical elements, compounds, and energy are transmitted from one biotic creature to another down the food chain.
The algae, pond lilies, elodea, and phytoplankton all manufacture their food through the photosynthetic process. This implies that they obtain their solar energy from the sun; hence they are placed in the first trophic level. Similarly, the beaver and the small fish which feed on the algae are placed in different food chains and form the second trophic level. Trophic level is thus energy level which includes all organisms with the same number of steps of energy transmission. The autotrophs which are one step from the original solar energy belong to the first trophic level while feeders on the autotrophs, the herbivores occupy the second trophic level. Further, feeders on herbivores, the carnivores are placed on the third trophic level, while scavengers on carnivores are fourth trophic level occupiers.
Lab 4B
Exercise 1. Income and development level
Total fertility rate and life expectancy remain constant.
Under the condition that the total fertility rate and the life expectancy remain constant, we expect the number of the population in the next sixty years to be the same. It is not only the number but also the general population feature of structure and composition. This will be so because each of the pair of parents will be replacing themselves and the various even age group proportions will be replacing each other in the next higher level.
Total fertility rate changes to 4.0; life expectancy remains constant.
In the case of the fertility rate changing to 4, some changes are expected in the population. The difference in the change in total fertility rate is 2. This means that there is an increase in the rate of the parental childbearing of two while there is no change in life expectancy. The expected result is that there will be a population increase due to the increasing number of children. The number of children aged between 1-15 years is expected to double by the end of the first 15 years, quadruples by the end of the second quarter of the period, eight times by end of the third quarter of the period and clicks 16 times the initial population at the end of the sixty years. Those aged between 15- 50 double in the second quarter or end of the first 30 years while those between 50- 70 years double in the third quarter of the period. This is because the first double number of children born within the first quarter will make the change of the population proportion as time goes on(Jacobsen, 2006).
Total fertility rate changes to 1.0; life expectancy remains constant.
The total fertility rate change from 2 to 1 is an indication of a decrease in the number of children that a pair of the parent will have. It means that each pair of parents will have one child, thus, the total number of children in the population will be decreasing by half at the end of every thirty-five years. Similarly, the population will be decreased by the same number within thirty-five years. This means the population will be less than 14000 at the end of the duration of sixty years (Birch, 2006).
Total fertility rate remains at 2.0; life expectancy increases to 100.
As the total fertility rate remains at 2, it means that there is no chance of the current total fertility rate, that is, each pair of parents will have two children. Therefore, the total fertility rate equals the replacement rate. The expected changes in population, in this case, will thus be a result of the effects on the change of life expectancy. The details show that life expectancy changes to 100, which is an increase. It is expected that there will be a general increase in the number of people in the population. The proportion of children in the total population will remain constant whereas there will be an increase in the proportions for young adults between 15-50 as well as those in the old age of above 50 (Jacobsen, 2006).
E Total fertility rate remains at 2.0; life expectancy decreases to 50.
A case where the total fertility rate remains at 2 implies that there will equal population replacement. However, the population will have change due to the life expectancy decreased from 70 to 50. A decrease in life expectancy indicates that many people will die before they reach old age. The life expectancy decreased from seventy to fifty thus shows that many young adults will lose their lives causing a decrease in their number. A decreasing effect on the number of persons who reach the old age stage will also be reflected or recorded within the period as young adults are the ones who graduate to the old age. However, there will be no change in the total number of children in the population. The overall result will therefore be a decrease in the total population due to the high death of young adults (Birch, 2006).
Determination of the level of development
Explanation of result
The hypothetical result of the three-generation furnishes crucial information on the level of development for the current generation. Comparing the data results of the various factors which are indicators of development, I can assert there has in a progressive increase of the annual earnings per individual, which is the commonly used predictor of countries’ development level. The per capita income is rarely affected by other factors and therefore, it’s used as a more reliable tool in the measure of development. Depending on this it shows the ability to invest which can be detected on the result of the investment. For instance, there has been a decreasing trend in the death rate from the grandfather’s generation to the modern generation.
This can be interpreted as to be a result of the use of modern technologies in the treatment of diseases which once proved to be incurable, use of pervasive preventive methods such as immunization, and early detection technique like blood screening. Also, the birth rate has shown a decreasing trend from the old generation to the current one. This should have been enhanced by the application of modern technology on the use of contraceptives. To crown it all, the personal level of education have highly changed across generations, whereby the current generation is aiming to a high most level of knowledge. It is always said knowledge is power, and it’s true that to perform sophisticated therapeutic procedures, or to make a sound investment that would generate an enormous amount of profits, one must know. I then believe that the level of education is the most important factor in the determinations of the level of development (Findlay, 2007).
References
Bartlett, S. (2002). Population Models in Ecology and Epidemiology: London, Methuen.
Birch, C.(2006). The intrinsic rate of natural increase of an insect population: Journal of Animal Ecology, vol. 16, pp 16-27.
Brown, L., 2001. Seeds of change: The green revolution and development. New York, Praeger.
Findlay. M. (2007). Population and Development in the Third World. New York: Metheun & Co. Ltd.
Jacobsen, E. (2006). Population Growth: University Science Books.
Setzer, P. (1999). Everyman’s Guide to Ecological Living. New York.