Introduction
The purpose of the study is to find out the impact of the production budget, the days of release, the number of theatres, opening gross, and seasons on the amount of revenue generated by movies. The study is motivated by the need to examine whether movies with larger budgets become the highest income earners. The most popular movies usually announce the largest production budgets. The analysis starts with a descriptive table of the mean, and standard deviation.
The mean indicates that most movies spent about 100 days to release a movie, and generated about $66 million in revenues. It could have been favorable news for movie producers. However, the standard deviation indicates that the earnings can vary widely, which may include negative earnings. In the second part, the paper displays and analyzes a correlation matrix table. In the third part, scatter diagrams are used to elaborate on the effect of different variables on revenues. The study indicates that there is a strong positive relationship between revenues and the other four variables, except for the number of days. Seasons have a weak negative correlation with revenues, except for summer.
Descriptive statistics
Table 1.
There is a wide range in the amount that firms spend on movies as their production budget as well as the revenues they generate. It can be seen from the large values of standard deviation for the budget, and revenue. The mean indicates that most of the movies in the sample had revenues that are close to $66 million, and budgets that are about $53 million.
According to the characteristic of a normal distribution, 68% of the movies spent between $0 and $138.6 million, which is one standard deviation from the mean. It has a negative value for the minimum amount, which shows that there is a wide variation in revenues and the budget. The mean number of theatres indicates that most movies used about 2,500 theatres in their widest release.
The movie with the maximum revenue, Toy Story 3, spent an amount that is about 40 times the one spent on the movie with the minimum amount of revenue. Its revenues are 415 times the amount earned by the movie with the smallest amount of revenue. The movie with the maximum revenue made a profit of about $215 million when the lowest earner made a loss of about $4.5 million.
Correlation
Table 2.
Analyzing the Correlation of Variables on Revenue
Opening gross has the strongest relationship with revenue, which is followed by the size of the budget. The opening gross approaches a perfect relationship with revenues. The number of theaters is the third, which also has a strong correlation to revenues. The number of days has a weak correlation to revenues.
The opening gross is likely to indicate the number of revenues that a firm will generate. Revenues are less sensitive to the number of days of releasing a movie.
All variables have a positive correlation to revenue, which refers to the first row and the first column of the values. It shows that revenue generated by a movie is likely to increase as opening gross, budget, the number of theaters, and the days of release are increased. However, there are differences in the degree of sensitivity, as indicated by the correlation coefficients.
The release of movies in any other season, rather than summer, has a negative impact on revenues. Fall, spring, and winter have a weak negative correlation. It shows that the more a firm releases movies in these seasons, the more its revenues are likely to fall. The positive relationship revenue has with summer is relatively stronger than the negative relationship revenue has with other seasons.
Considering intuition as a general understanding, one would expect movies released in the summer to have higher earnings because of school holidays, and favorable weather. Winter is expected to have the lowest because of unfavorable weather. The findings are consistent with intuitions. People also expect a movie with a larger budget to have higher revenues.
Scatter Plots
Revenue and Budget

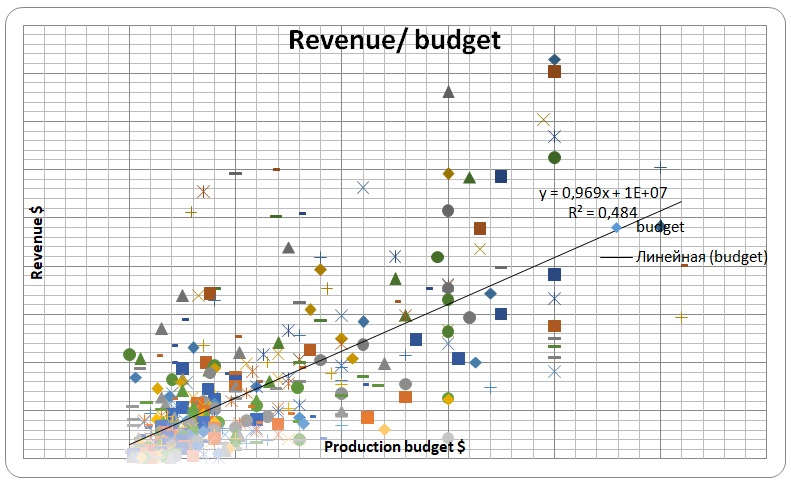
The scatter diagram for revenue against budget shows that as the budget becomes larger, revenue spots tend to fall far away from the regression line. It shows a strong correlation between budget and revenues when budget and revenue are relatively smaller.
Revenue and Theatre

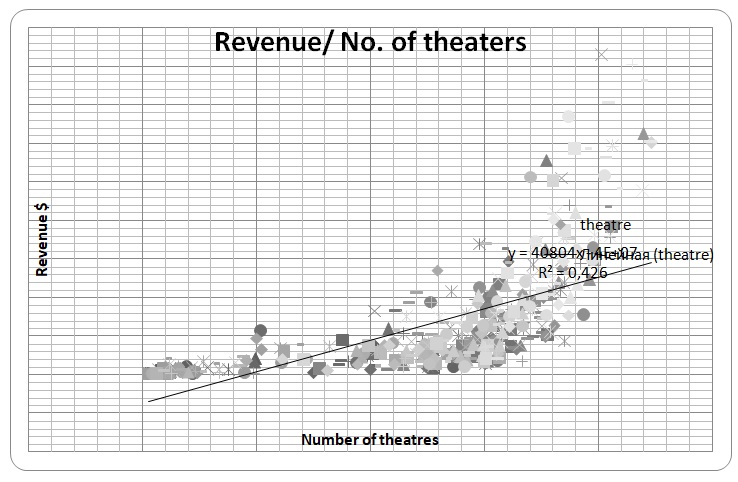
There is a strong relationship between the number of theatres used and revenue. Most of the spots fall close to the regression line. However, higher-income earners tend to have a relatively weaker correlation compared with middle-income movies. Higher-income movies tend to fall far from the regression line.
Revenue and Days

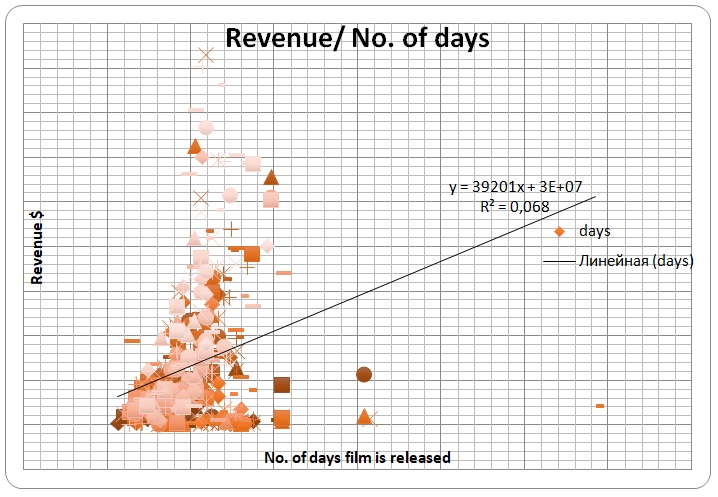
Compared with the two previous charts, the number of days has a weaker relationship with revenues generated by the movies. The spots do not fall around the regression line. They are scattered in a different direction from the regression line.
Revenue and Opening Gross

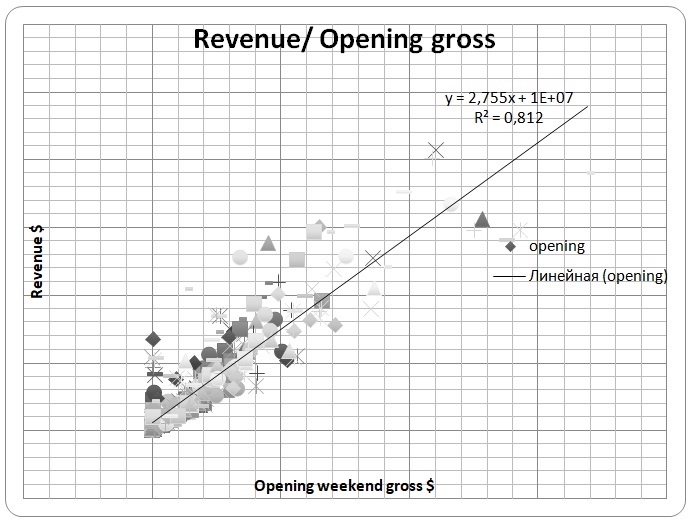
Graph 4 shows a stronger correlation than the three previous scatter diagrams. The spots tend to fall around the regression line, even for higher revenues.
The correlation results indicate that opening gross has the strongest relationship with revenue among the variables, which is similar to the scatter diagram. It shows that the correlation coefficient and the scatter diagrams portray the same information. The number of days has a weak relationship, which is supported by the scatter diagram as well as the correlation coefficients.
Seasonal Effects
Table 3.
The mean revenue for the movies released in spring is smaller than the mean for all movies. It may indicate that movies released in spring have lower revenues than other seasons. The budget for the movies released in spring is also smaller than the overall mean budget. The mean number of theatres is almost similar to the one for the overall mean. Opening gross and the number of days for release are also smaller than all seasons.
The movies that are produced in summer tend to have higher revenues than movies produced in other seasons, as indicated by higher mean revenue than the overall mean revenue. They also have higher production budgets than the other two seasons. They may release for more days and have a higher opening gross than the other seasons.
Movies released in spring have lower revenues than movies released in either winter or summer. The opening gross is much closer to the overall mean. The number of days for release is higher than in summer and winter.
The revenues of movies released in the fall season are slightly higher than those released in spring. They are much less than those released in summer.
Policy Recommendation
- The amount of revenue is strongly correlated to the opening gross. Managers should be able to allocate the right amount that they can spend on advertising depending on the first few weekends of a movie’s release. They should avoid further expenditure on a movie with a low opening gross to avoid large losses.
- Summer is the best time to release a blockbuster with a large budget if a firm wants to ensure optimal revenues. Other seasons tend to reduce revenues.
- There is little need to release a movie for more days because revenue is less sensitive to days compared with the other variables.
- Firms should use an optimal number of theaters and a sufficiently large budget in the movies they choose to produce.
Conclusion
The study indicates that there is a strong positive relationship between revenues with four of the variables. The numbers of days and revenues have a weak positive relationship. Seasons have a weak negative correlation with revenues, except for summer, which has a weak positive relationship. Further research should investigate on the areas that make the budget large, and their impact on revenues. For example, a budget could be large because of expenditure on the most popular movie stars, or expenditure on marketing. A movie could reduce the number of superstars, and increase advertizing.