Taxation
Carbon tax
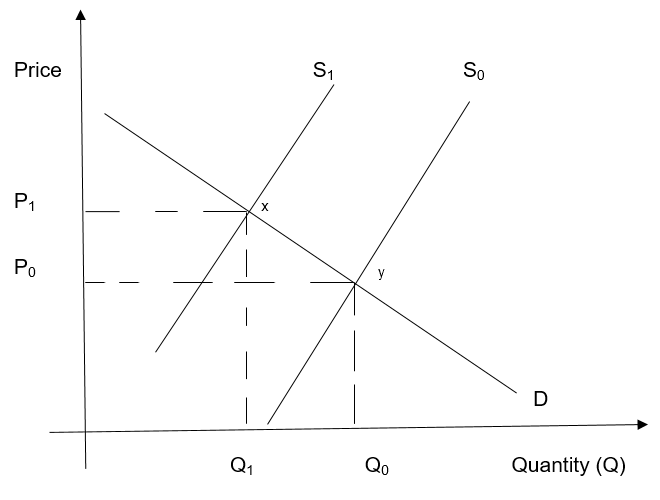
The carbon tax will increase the cost of production meaning that the supply of those products will reduce from Q0 to Q1; therefore, the supply curve will shift to the left (shift up) that is from S0 to S1. Conversely, assume that the firm transfers it’s the cost of production forward that is to the consumer, this implies that the price of the good increases from P0 to P1 resulting in to decrease in quantity demanded thus leading to an upward movement on the demand curve from y to x due to increase in price as shown below. Thus a new equilibrium point x will be established.
New car demand
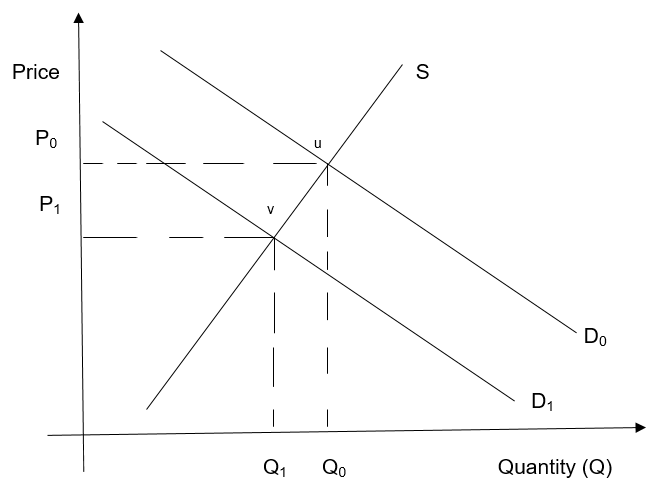
Oil and cars are compliment goods, which are used together; thus if the price of oil per barrel goes up to $200 this means that the demand for new cars will reduce that is a shift to the left from D0 to D1, this reduction in quantity demanded will force the car price to decrease from P0 to P1 leading to a new market equilibrium (v) whilst the supply curve S will remain the same because the production cost of the car is not affected by oil prices though there will a movement down the supply curve due to decrease in price to a much lower supply level.
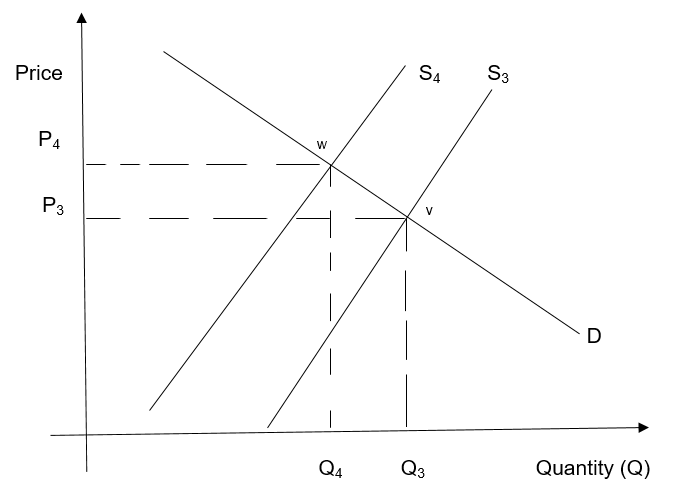
If the severe global recession takes place a year after the increase in oil prices, this will lead to an increase in purchase price (P3 to P4) to the consumer and firm’s cost of production for new cars, which reduces quantity supplied from Q3 to Q4. This implies that the supply curve will move to the left from S3 to S4, establishing a new equilibrium point (w) while the demand curve will remain the same though there will an upward movement on the demand curve as a result of a price increase.
Free trade agreement
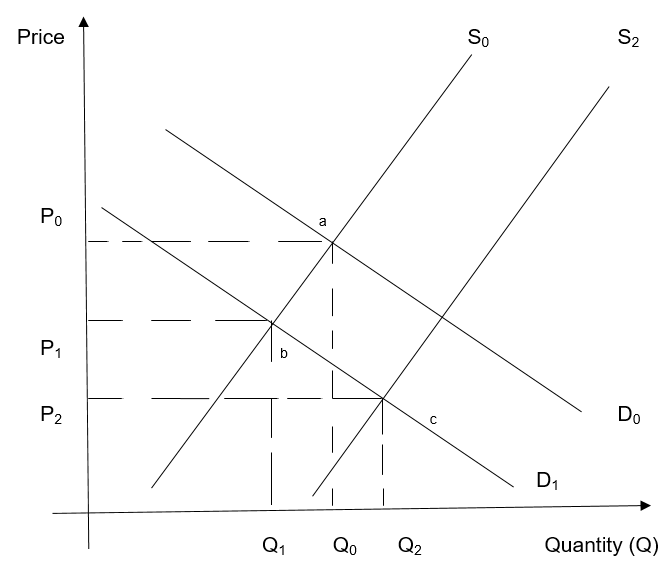
If consumers expect that the price of imported cars will reduce in six months this will lead to shifting of the demand curve to the left from D0 to D1 due to reduced demand from Q0 to Q1, and the price will reduce from P0 to P1 as a result point b will be the new equilibrium.
After the implementation of the policy, the supply curve will shift from S0 to S2 due to an increase in demand accordingly there will be a movement on the demand curve to the right from equilibrium point b to c due to an increase in quantity demanded from Q1 to Q2 which result to decrease in price from P1 to P2.
Profit
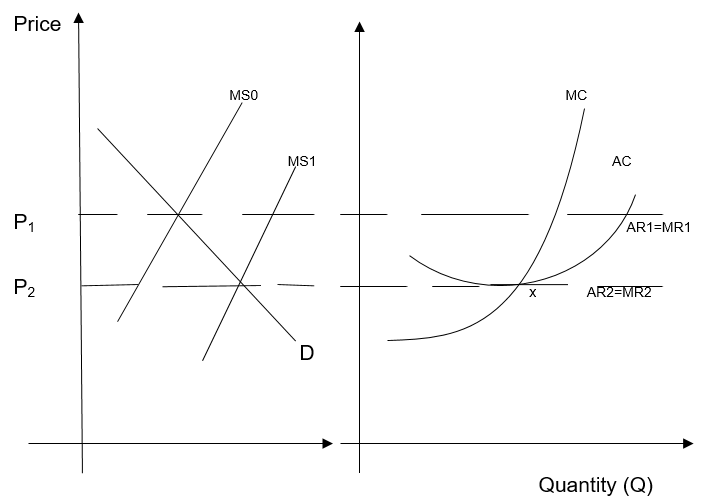
- Normal profits are determined by the product price and the average cost of production where the rise in supply triggers a decrease in cost as a result, the price will equal average cost plus it will change with the economic state in the long run because when the economy is at boom more goods will be demanded which attract new competitors into the industry in case of perfect competition (Willamette.edu, 2010).
- In the long-run firms making abnormal profit attract new entrants in the market-leading to an increase in supply (Willamette.edu, 2010) which eventually reduces the price from P1 to P2 in this particular point the price equates to average cost. Thus the companies are earning normal profit at point x, assuming that the demand curve does not shift.
- Normal profits (point x above) are considered as a cost because when the firms are operating in the long-run as shown in part b above, they normally equate the price of a good to its average cost of production(Willamette.edu, 2010).
- A firm continues to operate in the short-run even when it is making losses because it has to cover fixed costs and some variable costs and if it decides to cease operation it will still incur the unavoidable cost such as rent, depreciation plus it will not be receiving anything to offset its costs (Willamette.edu, 2010).
- Abnormal profits will encourage new entry into the industry thus increasing the quantity supplied and the number of firms operating in the sector.
Profit calculation
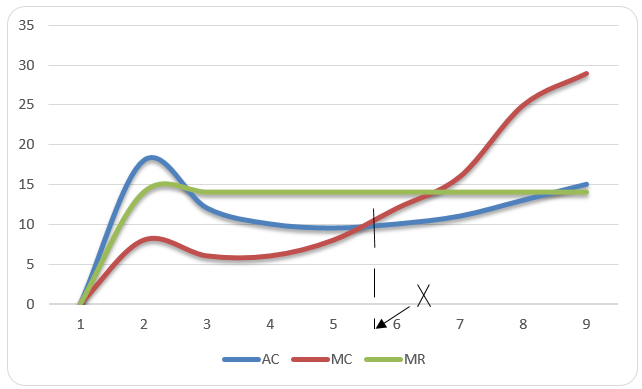
Point x is the profit-maximizing output and the firm is making a supernormal profit of $3 per unit ($14 – $11).
The price will eventually reduce in the long run due to an increase in supply due to many firms in the industry.
Information on average cost is important to determine the level of output at which the firm needs to produce to maximize profit.
Kinked demand curve
a. The failure of a company to forecast with firmness the rivals’ reactions make it almost impracticable to approximate MR data and demand that an oligopolist faces. With no such data, companies do not decide on their output and price that maximizes profit- even in the hypothesis (Cliffnotes.com, 2011).
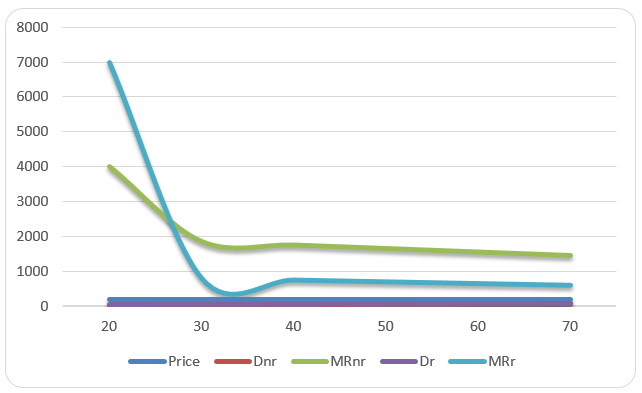
Where Dnr and Dr are the output where oligopolists do not react and where they react respectively.
An oligopoly’s marginal revenue must be equal to marginal cost to maximize profit at which point the equilibrium output is attained (Cliffnotes.com, 2011).
Natural energy sources
To endure on this planet, energy must be relied upon, although there is no unrestrained natural energy source, which will end very soon there is still a need to think of alternative options; nuclear is one example (Sloman, Norris and Garratt, 2010).
There are various motives as to why people do not prefer nuclear energy because it results in severe environmental damage and can be used in manufacturing bombs (Sloman et al, 2010). Additionally, the environment needs to be clean which means safe inexpensive renewable energy that is economically viable, reliable, socially acceptable, affordable, and sound is needed. Any impact on the society from this waste is referred to as externalities: they are normally “third party” or side effects, of the process of production (Sloman et al, 2010). In this case, individuals will be affected negatively, thus nuclear energy will lead to external costs (Sloman et al, 2010).
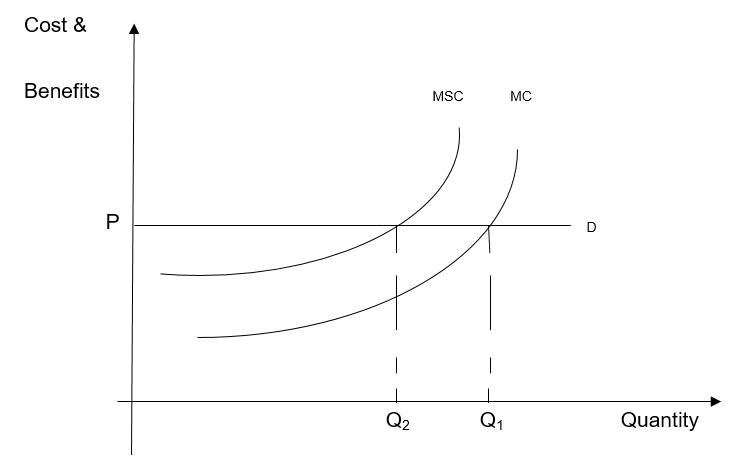
For instance, when a company dumps its chemical waste into the water body and air, society incurs costs extra to those accepted by the company. In that case, the marginal social cost (MSC) of chemical creation surpasses the MC (marginal private cost). In a diagram the marginal social cost curve is over the marginal cost curve, this is assuming that the company is doing business in a perfectly competitive environment and it thus takes the price (price taker) that is it is faced with a horizontal demand curve (Sloman et al, 2010) as shown below.
The socially best output will be Q2 where P=MSC; thus the company manufactures Q1 that is more than optimum. Therefore, external costs resulting in over-production from the community perspective. The external cost will be the difference between the marginal social cost and marginal cost.
Protecting employees
The “Work Choices” legislation that was effected in 2006 brought considerable variation to employment regulation conditions plus sector relations and the bill was instituted in 2005 to the House of Representatives (Sloman et al, 2010).
The employees were treated unfairly by the Work choice Law (Sloman et al, 2010) although from the employer’s perspective it was a superior law it was unethical. The government failed to deal with the main issues that were upsetting working families such as lack of protective laws from unjust dismissal, no assurance of any financial award, and no restriction on employers’ power to manage rosters (Sloman et al, 2010).
It did not assure employees whether they will be fairly paid or be financially compensated and the employer facing economic difficulty was not required to offer compensation. The unemployed individuals, young people, disabled and sole parents working in-country and regional areas were not secured in the “fairness test”; thus unjust dismissal and illegal termination was the main weakness of this law (Sloman et al, 2010).
Conclusion
In 2009, the “Fair Work” law was signed and restricted the extent of compensation discrimination claims (Sloman et al, 2010). Employers must make themselves acquainted with the new legislation to lessen the possibility of future risk plus to make sure that they comply (Sloman et al, 2010).
For instance, an employee (Lilly Ledbetter) of a rubber firm sued her labor force when she recognized that the male employees were being salaried more for the identical job description (Sloman et al, 2010). This law covers more than gender discrimination as it also safeguards the employees against pay discrimination based on color, race, age, nationality, religion, and disability (Sloman et al, 2010).
Reference
Cliffnotes.com. 2011. Kinked demand theory of oligopoly. Web.
Sloman, J., Norris, K. & Garratt, D. 2010. Principles of Economics, 3rd edn, Pearson, Frenchs Forest, NSW.
Willamette.edu. (2010). Economic Cost. Web.