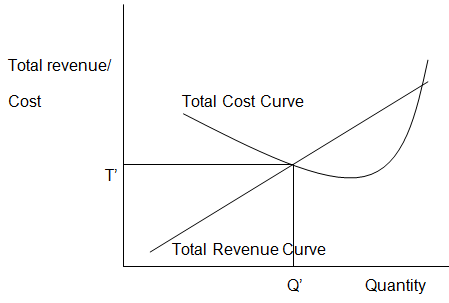
Total Revenue and Total Cost Curves
Any firm aims at maximizing the quantity of profits made from any business deal. However, amount of profits that a firm can get from production of commodities is determined by the difference between total revenue and total costs. The higher the difference between total revenue and total costs, the higher the amount of profits.
In this regard, total revenue and total cost curves are very crucial in determining the quantity of commodities to be produced (Talent, 2010d). Total revenue curve plots the total revenue that can be earned by any given quantity of production while total cost curve plots the average total costs for producing any given quantity.

As it can be seen from the graph above, quantity Q’ is the breakeven quantity. At this point, the firm makes neither loss nor profit. This is the point where the total cost curve and the total revenue curve meet.
However, producing quantities higher than Q’ increases profit while producing quantities fewer that Q’ reduces profits (Talent, 2010d). Nevertheless, increase in production can only increase profits as long as marginal revenue is greater that marginal cost. Increase in marginal costs is responsible for the eventual increase in total costs.
Sunk Costs
Sunk costs are the costs, both monetary and otherwise, that are incurred when one is setting up an investment and which cannot be retrieved in the future. It is important to note that sunk costs cannot be shifted from one commodity or investment opportunity to another.
When making business decisions, sunk costs should not be considered. This is because sunk costs will not in any way increase or decrease current or future output (Talent, 2010c). On the contrary, sunk costs were only necessary in the past and nothing can be done to save them.
For example, having unproductive employees in a firm is a costly venture because a firm will continue incurring costs on the employees yet they do not perform. The costs that have been used in training the employees as well as their salaries cannot be claimed from them.
In this regard, these costs should be considered as sunk costs and decision made to fire the employees and hire others who will be productive. The same case will apply for a piece of machinery that is not up to expectation though it was expensive to acquire (Talent, 2010c). In a nutshell, any decisions made should not take sunk costs into consideration.
Production Possibility Curves
There are very many production alternatives available to choose from. Given the scarcity of resources available, allocation of resources in production of a particular commodity means that there are fewer resources available for production of other commodities. Production possibility curves outline maximum achievable output of all products when all available resources are fully utilized.
Moreover, production possibility curves show the ration at which various inputs can be mixed in order to achieve maximum output. Understanding of production possibility curves is very crucial since it helps managers in knowing which level of production maximally utilizes available resources.
On the same note, when business managers explore the idea of increasing production of one commodity due to increase in demand, the question is usually what quantity of inputs should be shifted? Production possibility curves come in handy in enabling business people to know the quantity of inputs that can be shifted from production of one commodity to another without reducing total revenue (Talent, 2010b).
However, it should be noted that the concept of diminishing utility as well as comparison between marginal cost and marginal profit also determine the limit of resources that can be shifted. Nevertheless, increase or decrease in total resources available can shift the production possibility curves outwards or inwards respectively.
Opportunity Costs
Human life is about making choices given the fact that there are many options available. At any one given point, a person will have to choose what to do and what not to do. Choosing to take a given option means that one forgoes other options that are available.
Though there are times when the options available are not so much related and making a choice is not very difficult, there are moments when the alternatives have almost the same effects.
Opportunity cost is a term used to refer to the most applicable alternative forgone during decision making process. It is important to note that opportunity cost considers only those alternatives that can easily be used in place of one another (Talent, 2010a).
From the case given in the video, the employee has both time and money to take into consideration. An increase of $10,000 looks very attractive to be dropped. However, it comes with a limit on the amount of time that can be spared for family and friends. Whichever the decision that will be made, time or money has to be forgone. The idea of opportunity cost is very crucial in ensuring that efficiency is upheld in any decision made.
Any decision made by a business involves choosing from many options made (Talent, 2010a). A business person will therefore require knowledge of opportunity costs to ensure that any option taken is the most applicable.
References
Talent (Speaker). (2010a). Opportunity Costs [DVD]. United Sates of America: University of Phoenix.
Talent (Speaker). (2010b). Production Possibility Curves [DVD]. United Sates of America: University of Phoenix.
Talent (Speaker). (2010c). Sunk Costs [DVD]. United Sates of America: University of Phoenix.
Talent (Speaker). (2010d). Total Revenue and Total cost Curves [DVD]. United Sates of America: University of Phoenix.