Introduction
At the opposite extreme to perfect competition, there is the situation where there is only one producer in the market. Such a situation is described as ‘monopoly’. Under perfect monopoly, competition is non existent and the price can be influenced by the single seller. Two conditions are necessary for perfect monopoly to exist, there are:-
- A single producer or seller: – The single producer may be an individual owner or a group of partners or a joint stock company or any other combination of producers or the state. If there are many producers, there will be competition, perfect or monopolistic, and if there are a few producers we face oligopoly. Hence there must be sole producer or seller in the market, if it is being called monopoly.
- The commodity produced by the producer must have no closely competing substitutes. This ensures that there must not be any rival of monopolist. Thus under monopoly the market is dominated by one seller who has complete control over the supply of the commodity. He cannot, however control demand and so he cannot sell as much as he likes at any price he chooses. A monopolist is faced, therefore, with two choices. He can decide either:
- The quantity of the commodity he is prepared to sell – in which case the price will be determined by consumers competitors with each other to buy the supply available; or
- The price at which his product is sold – in which case consumers will decide how much they wish to buy at that price.
Perfect monopoly is almost impossible to achieve in reality. It suggests a firm operating in the completing absence of competition, that is, without any close substitutes for its products. This is unrealistic because there are few commodities for which there is not some form of substitutes. In any case, all goods are some extent comparative because they compete one with the other for consumers with limited incomes. In this sense, therefore all goods, are to some extent substitutes for each other and perfect monopoly could exist only if one firm controlled the supply of all the goods and services available.
The demand curve facing the monopolist
Since the monopolist is the sole supplier of a commodity, he is not faced with a given price level and his own behavior des affect the price. For his reason he is also faced with a downward curve; at a higher price; less of his goods will be demanded, while at a lower price demand will be greater.
Price- output determinant under monopoly
Since the monopolist is the sole supplier of a commodity, the demand curve for this product is the market curve and will slope downwards from left to right. This is a very different state of affairs from that which obtains under perfect competition where the individual firm’s demand curve is perfectly elastic.
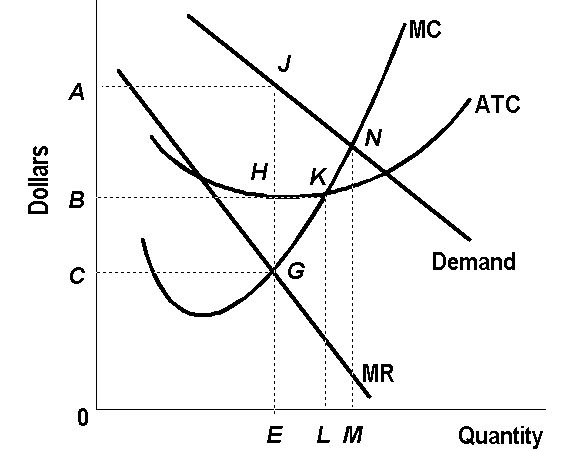
The monopolistic, we assume will try to maximize his profits and will therefore aim to produce where marginal revenue – marginal cost. He does so because profits will go on increasing as long as marginal revenue exceeds marginal cost. At the point where marginal revenue = marginal cost, the profits will be maximized and here he stops. If production is carried beyond this output, profit will start decreasing.
Diagrammatic illustration
The price output equilibrium of the monopolists can be easily understood from figure below. AR is the demand curve or average revenue curve facing the monopolist. MR is the marginal revenue which lies below average AR. AC is the average cost curve and MC is the marginal cost curve. It can be seen from the diagram that up to OM output, marginal revenue is greater than marginal cost, but beyond on the marginal revenue is less than marginal cost. Therefore the monopolist will be in equilibrium at output where marginal revenue = marginal cost and the profit are greatest.
Now the total profit = profit per unit x total output sold
= AB + Om + ABTP
Thus, the total profit, or the monopoly net revenue is equal to the rectangle ABTP – the shaded area.
Externalities
There two types of externalities that is, positive and negative externalities. Positive externalities are beneficial while negative externalities in harmful. Where there is externalities; the community interest is on the market result is beyond the well being of the supplier and the buyer. For example the community may be interested in the corporate social responsibility of organization while the consumer is interested with the benefits of the product. Some negative externalities may include exhaust of a motor vehicle because it will affect the life of the people through emission of gases. While a museum is a positive externality because it will give people for recreational. A barking dog is a negative externality because it causes fear to visitor.
Externalities affect the economic wellbeing of the society and can cause re-allocation of resources inefficiently. Assume, the demand for the generators goes up, there will be an increase in ozone gases into the environment which is a negative externality. The following two graphs show a negative externality and their changes.
Consumer surplus
The consumer surplus is the excess between the price the consumer is willing and has ability to pay and the actual price paid for a good or a service. For example if the customer is willing to pay $50 but pays $ 40 i.e. the customer surplus becomes $ 10.the following graph shows the consumer surplus of a consumer;
Consumer surplus measures how desirable are the product in market and it will help producers to decisions of production.
Income elasticity of demand
Income elasticity of demand is vital because it will help a businessman to know what price to charge for his product and how the quantities will be affected. For example if a slight change in price results in a large change in sales, then the demand for the product is said to be elastic.
Also, if the demand is elastic, a businessman will not want to raise the price of his product because any increase in price will result in serious decrease in the quantity sold. On the other hand if a change in price results in very little change in quantities sold, the demand for the product in question is said to be inelastic. This means price changed without affecting quantity demanded. There are five income elasticities of demand;
Perfectly elastic demand
It occurs when insignificantly price reduction leads to an unlimited extension for demand, and insignificantly price increase causes the demand to fall to Zero, one can say that the demand is perfectly elastic or the elasticity of demand is infinite.
Perfectly inelastic demand
In this case change in price does not affect quantity demand that is the demand is non-responsive to price changes. In figure below perfectly inelastic demand curve DD is a straight line perpendicular to the axis of Y. in the figure the amount demanded is OD’ both at the price OP and OP’.
Relatively inelastic demand
This is when a large change in the price produces a less than proportionate change in the quaintly demanded. The figure below shows a relatively inelastic demand curve DD’. As the price falls from PM to PM’ the quantity extends from on to on’ that is. the increase in quantity demanded is less than proportionate to the fall in price.
Unitary elasticity demand
This is when a proportionate change in price brings about an equal and proportionate change in demand In the figure below the case of unitary elasticity is shown. As the price falls from $ 2 per unit to $1 per unit, the quantity demanded increases from 1 unit to 2 units.
Relatively elastic demand
This is when a small change in the price is accompanied by a more than proportionate change in the quantity demands.
Alternatively, it is said that elasticity of demand is greater than unity. The figure shows a relatively elastic demand curve DD’ as the price falls from ON to ON’ the demand extends from OM to OM’ i.e. as the increase in demand is more than proportionate to the fall in price.
Production possibility of diagrams
Most economic models unlike the circular flow diagram are built using the tools’ of mathematics. Here I will use one of the simplest such models called the production possibilities frontier to illustrate some basic economic ideas.
The circular flow
The diagram is a schematic representation o the organization of the economy. Decisions are made by households and firms. Households and firms interact in the markets for goods and services the outer set of arrows shows the flow of dollars and the inner set of arrows show the corresponding flow of inputs and outputs.
The figure above shows an economy’s production possibilities frontier. If the economy uses all its resources in the generator industry, it can produce 2000 generators and no cars. If it uses all the resources in the car industry it can produce 500 cars and no generators. The two end points of the production possibilities frontiers represent extreme possibilities.
Because resources are scarce, not very conceivable outcome is feasible e.g. no matter how cars represented by point C give the technology available for manufacturing cars and generators the economy simply does not have enough of the factors of production to support that level of output.
An outcome is said to be efficient if the economy is getting all it can from the scarce resources. When the economy is producing at such a point, say point A there is no way to produce more of one goods without producing less of the other. Point D represents an efficient outcome.
The production possibilities frontier shows the combinations of output – in this case cars and generators that the economy can possibly produce, the economy can produce any combination on or inside the frontier. Points outside the frontier are not feasible the economies resources.
A shift in the production possibilities frontiers
A technological advance in the generators enables the economy to produce more for any given numbers cars. As a result, the production possibilities frontiers shift outward. If the economy moves from point A to point G, then the production of both cars and generators increases.
The figure above illustrates economic growth. Which point it chooses depends on its preferences for the two goods. The production possibilities frontier simplifies a complex economy to highlight some basic but powerful ideas: scarcity, efficiency trade offs, opportunity cost, and economic growth. The production possibilities frontiers offer one simple way of thinking about them.
References
Baumol W, (1992); Economics principles & policies; Australia, edn, Harcourt Brace Jovanovich.
Alfred. W. and Hague, D. C. (1980); A Textbook of Economic Theory. Published By- ELBS Ison, S. & wall, economics, fourth edition. Ft Prentice Hall.
Mankiw, N. Gregory, and others. (1993): A Symposium on Keynesian Economics Today” Journal of Economic Perspectives, 7 (1993): 3–82.
Mankiw, N. Gregory (2006);Principles of Economics; Thompson South-Western; 4th edition.
McTaggart D Finlay C & Parkin M (2003); Economics, Pearson education Australia.
Robinson, J. and Eatwell, J. (1973), An introduction to Modern Economics, McGeaw Hill Book Company (UK) Limired.
Stonecash, Gans, King,(1995); Principles of macroeconomics, 3rd Edition, Asia Pacific Edition.