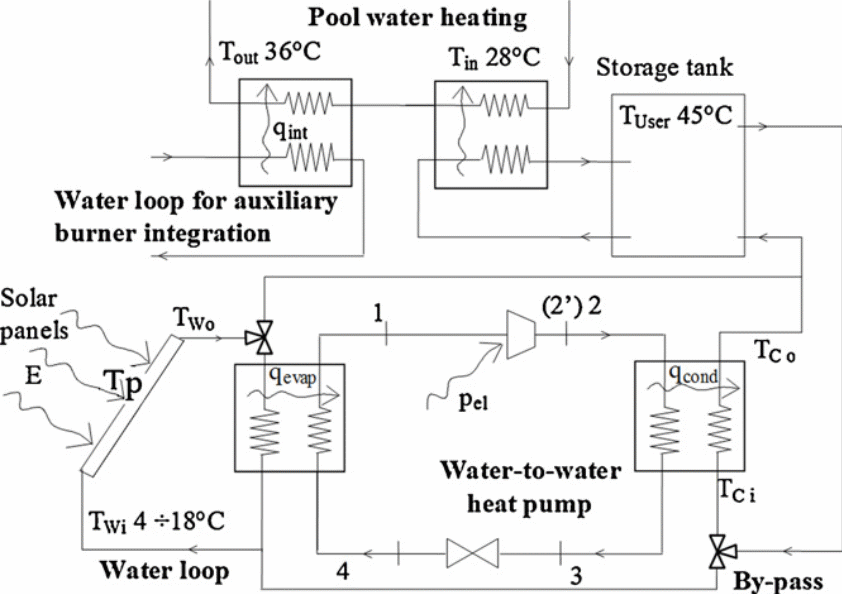
Contemporary systems meant to heat water/air explore both the heat pumps and the solar plates that are combined to form a unit with the aim of optimizing on the energy efficiency as well as solar collection efficacy (Tagliaficoa et al. 834). With a unit like Solar Assisted Heat Pump (SAHP), their effects are manifested on the refrigeration inverse phase of the same. In this article, the main focus is on the DX-SAHP (direct expansion) system meant to produce hot water for domestic use at approximately 45oC. The important part of a DX-SAHP includes a Rankine refrigeration cycle that is combined with a solar collector which acts as an evaporating unit in the system. Ideally, whatever transpires inside the unit to achieve its function is simply heat transfer. The refrigerant heats until boiling point consequently transferring the heat to the user’s reservoir tank. One advantage of a DX-SAHP over the other systems is that its solar plates are cooled, optimizing on its exploitation of the solar radiation. Moreover, its heat pump operates “with an evaporator temperature higher than in traditional air-to-water or air-to-air heat pump systems, with a consequent higher achievable coefficient of performance (COP)” (Tagliaficoa et al. 834).
In this article, a Water-SAPH (W-SAPH) was studied for analysis with swimming pools in Italy as the reference facilities. Remember, water acts as a refrigerant in this case. The analysis factored parameters such as the degree days (DD) and solar radiance (G). Importantly, the thermal load was constant at 150 kWt, and the W-SAPH energy-saving efficacy was recorded as PES (primary energy saving). This was compared to a normal gas burner (see Figure 1 for the schematic drawing of the experiment). 110 data representatives were collected within Italy, factoring all the climatic and topographic entities that may have an influence on the results. One representative (Genoa (1435 DD)) was selected for analysis where an individual analysis was required (Tagliaficoa et al. 834).
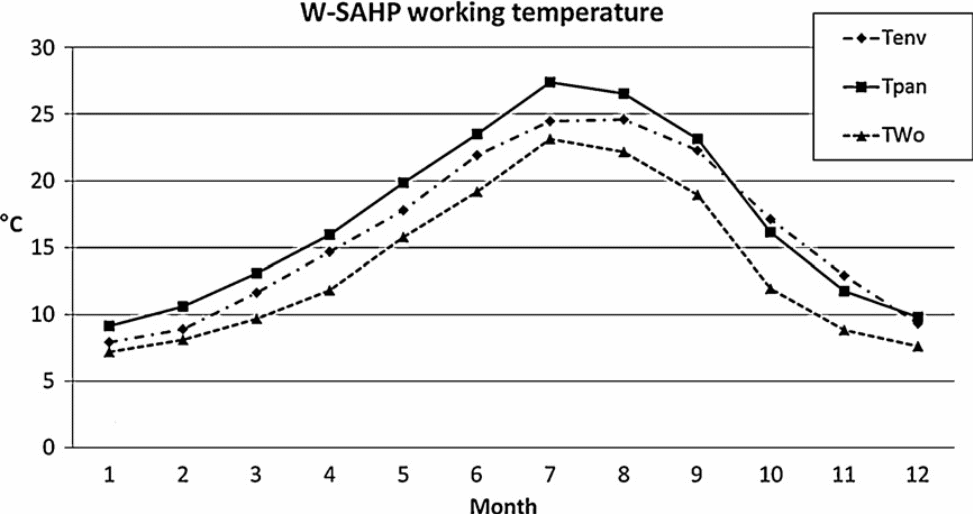
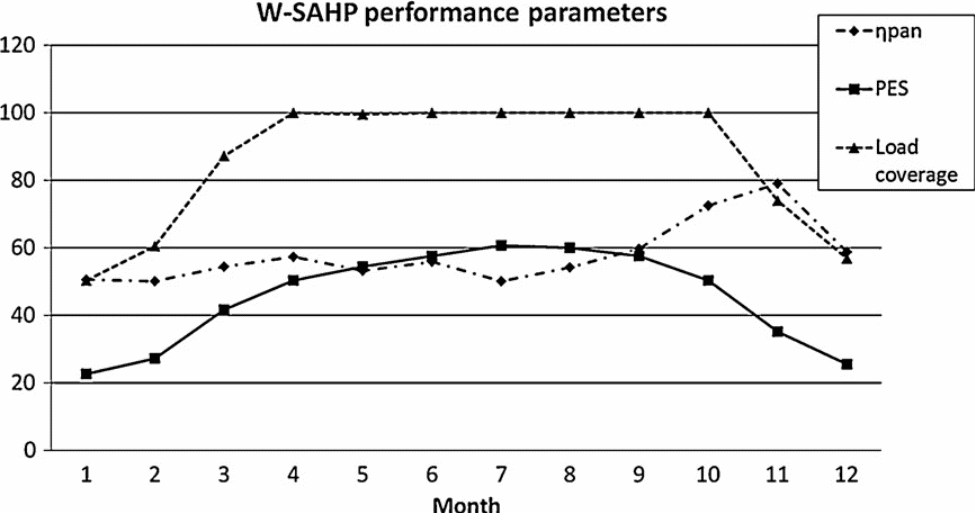
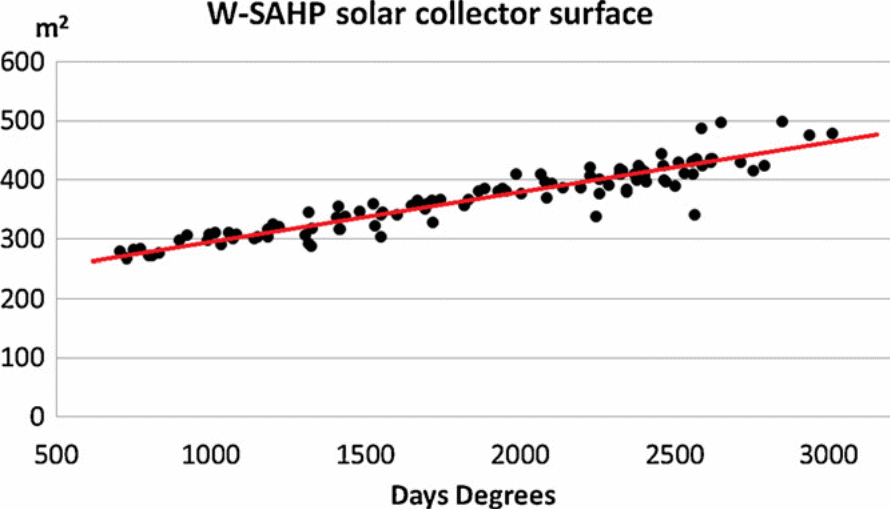
From the analysis, and going by the results presented in Figure 2, the best operating temperature for the W-SAHP ought to be above the environmental temperature to reduce thermal loses. With reference to Figure 3, the energy-saving efficacy was analyzed. To this end, a W-SAPH could support up to 100% of energy needs of the load within a span of approximately 210 days (April-October). Within this period, it attains an average of up to 60% PES per month. Ideally, the winters have worst PES performances owing to lower temperatures of the surrounding environment. Interestingly, the immediate season after summer (October-November) enjoys convective conditions from the previous season and thus exhibits considerably higher performance than other winter months. To comprehend the broader picture of the collector’s efficacy as well as the PES performance, the regression analyses were plotted (Figures 4 and 5 respectively). As regards PES, it can be concluded that its performance is almost linearly related to DD i.e. R= 0.82. However, there seem to be outlier plots (Trento and Varese) as the DD increases. Akin to PES, the collector’s regression plot exhibits a good correlation between the panel area and the DD. As such, the W-SAHP can guarantee “a yearly based PES greater than 35% in all the considered locations, up to values near 50% it the most favourable situations (mild climate, Italy south locations)” (Tagliaficoa et al. 838). Importantly, it should be noted that these results are region-specific owing to varied climatic conditions. Therefore, different countries would have different results.
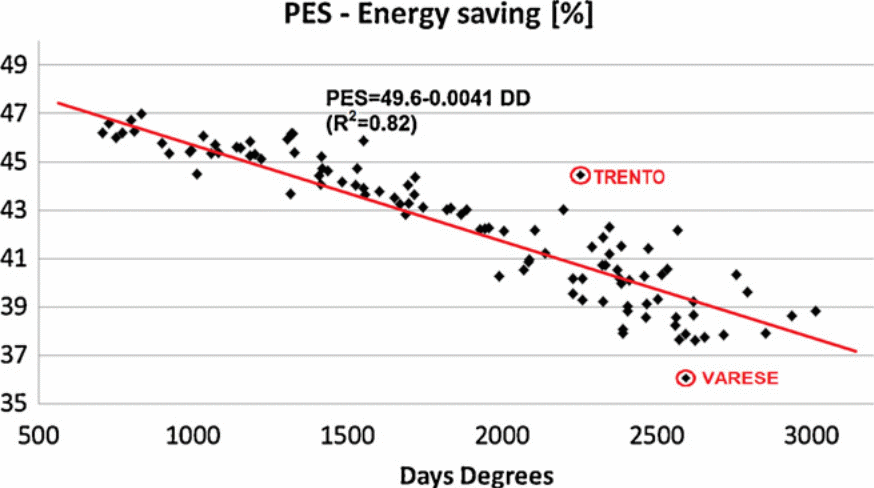
Conclusively, as per this study, the analyses presented here can be used to project on the quantity of panels and the PES performance of a given setting. Furthermore, given the varied climatic conditions of Italy, the results can easily be used to predict conditions in many other locations (Tagliaficoa et al. 838).
Accessing fresh water for domestic use in the US is a sensitive subject with regards to environmentalists. This is so owing to the fact that the ensuing processes have an influence on both the emission and energy footprint. In the US, fresh water is obtained from seawater, recycled water (REC), or imported (IMP) from abroad. Of the three, seawater contributes heavily to both emission and energy footprint (800 Kg CO2 and 14 GJ as compared to 360 Kg CO2 and 5.8 GJ for imported water in California per annum). Therefore, the study presented in this article analyzes these sensitive elements with the aim of helping the policymakers of California to make informed decisions. To achieve this, a decision making tool, WEST (Water-Energy Sustainable Tool), is adopted. This tool is an LCA-based (life-cycle assessment-based) that is yet to be fully explored.
With California as the case study, the results presented in the appendices (Figures 6, 7, and 8) depict the real situation on the ground. These show the chemical requirement per process, energy-carbon footprint, and energy requirement comparisons. When analyzing the results of Table 3 in Figure 7, it is evident that IMP has combined low energy and carbon footprint. However, this is not comparable to DBG which is preferable with regards to the analyzed parameters. Table 4 results in Figure 7 present the life-cycle findings which are generally higher owing to supply chain factors. The table in Figure 8 presents results obtained from different case scenarios. The scenarios tested include direct emissions from California, life-cycle emissions from the US, entire solar PV emissions, entire solar thermal emissions, EU 2020 mix, and low emissions combinations. From the results, the score exhibited by the US life-cycle emissions surpass the baseline case study of California. Other attributes can easily be drawn from the table.
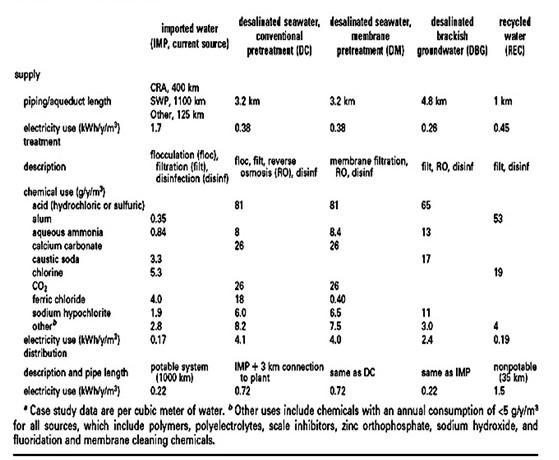
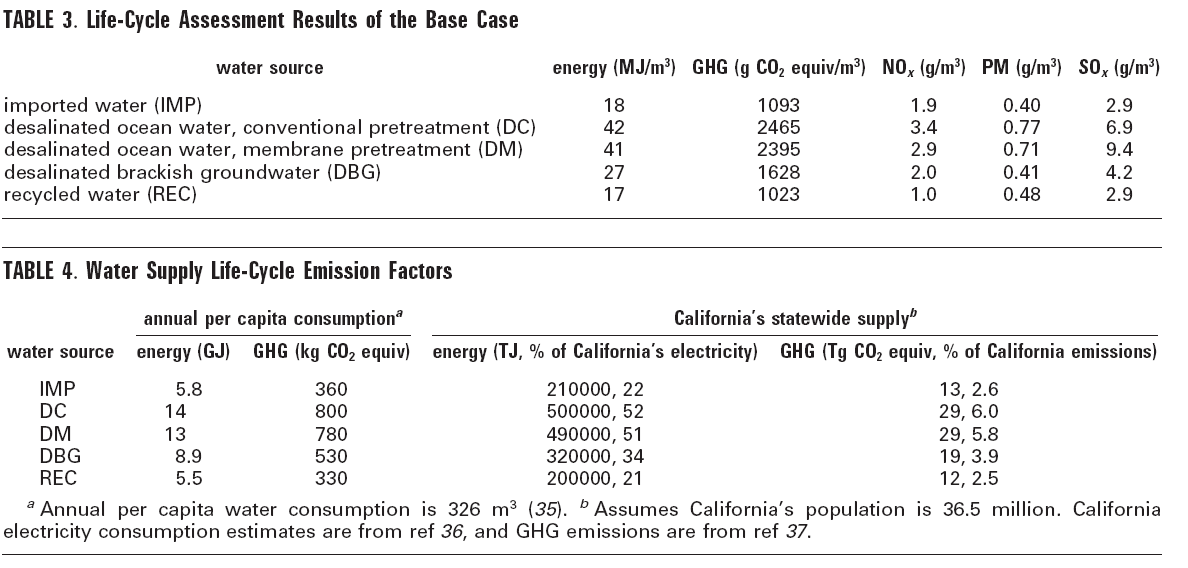
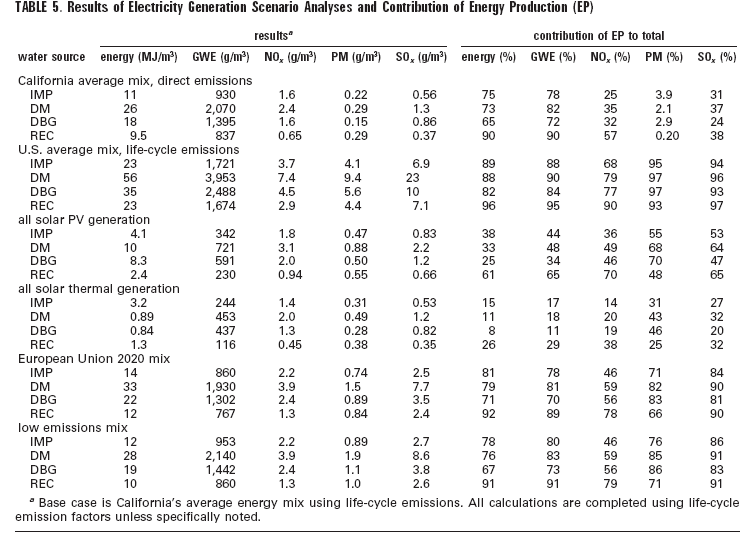
In this article, the main objective was to analyze the degree of emissions as obtained from the alternative sources of water. The details of the analysis incorporate additional treatment alternatives for comparison (conventional pretreatment versus emerging membrane pretreatment for desalination)” (Stokes and Hovarth 2686). With the information derived from these results, it is important for the policy makers to consider installation of novel water systems to satisfy the growing demand. However, the life-cycle factors have to be considered. Maintenance as well as upgrading of the current water systems ought to be prioritized to obtain positive results. Nonetheless, economists quote a high figure (80 billion per annum) for the maintenance-related costs. Nevertheless, once this is done the operational costs are low and the results outweigh the costs by far. It should be noted that the analyses presented herein are region-specific since factors e.g. topography and climate play a significant role on the results. Adopting the recommendations highlighted in this article would have a significant effect on the energy-carbon footprint.
Water-energy nexus explains the cycle that starts with water which provides energy that is later used to enhance water-related services. One typical example is when water is used to generate hydroelectric power that is later used in desalination units. The figure below represents an example of a water-energy nexus. The water-energy nexus presents a lot of challenges with regard to climate change.
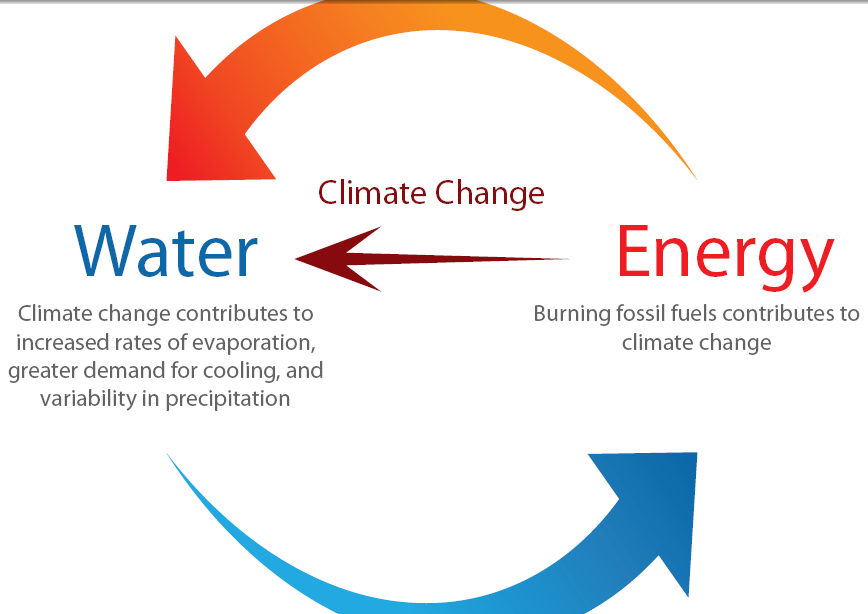
This water-energy nexus is significantly felt in Ontario province, Canada. Ideally, this cycle is responsible for increasing carbon footprint, an element responsible for climate change. With regards to Ontario, studies reveal that there is a growing population which puts pressure on the limited water resources. As such, it is envisioned that there will be need to explore new water resources that are remotely located (Maas 6). As a consequence, lots of energy will be required to pump this water from the remote locations. This will significantly increase the energy footprint. In order to limit this negative trend, then efficient methods that limit water wastage should be adopted (Maas 7).
In a conclusion, energy and water are the most important elements driving all industries. With the increase in demand due to a bulging population, these elements are constantly under pressure. The situation is set to worsen if corrective measures are not taken. This situation can only be remedied by reducing waste and adopting energy-saving techniques.
Works Cited
Maas, Carol. “Ontario’s Water-Energy Nexus: Will we find ourselves in hot water or tap into opportunity?” Research Report Journal 23 (2010): 1-32.
Stokes, Jennifer, and Hovarth Arpad. “Energy and Air Emission Effects of Water Supply.” Environ. Sci. Technol. 43.1 (2009): 2680-2687. Print.
Tagliaficoa, Lucas, et al. “An approach to energy saving assessment of solar assisted heat pumps for swimming pool water heating.” Energy and Buildings 55 (2012): 833-840. Print.