Research Question
Does the experience of members in the three teams influence their effectiveness in the successful completion of projects across the year?
Hypotheses
H0: The level experience among members in the three teams does not influence their effectiveness in successful completion of projects across the year.
The null hypothesis supposes that the level of experience does not influence the effectiveness of team members in successful completion of the projects. In this view, the null hypothesis implies that team members who have the experience of zero to five years (team A), six to ten years (team B), and 11 or more years (team C) have the same level of effectiveness in successful completion of projects.
H1: The level of experience among members in the three teams does influence their effectiveness in successful completion of projects across the year.
Contrastingly, the alternative hypothesis supposes that the level of experience in terms of years influences effectiveness of team members in successful completion of the projects. Therefore, it means that there is a significant difference in the level effectiveness among the three teams, namely, A, B, and C.
Variables of the Study
The dependent variable of the study is the effectiveness of team members, which is measurable in terms of the number of projects that they have completed successfully in a year. The effectiveness of team members is a discrete variable because it measures the number of completed projects; hence, it has no intermediate values. Moreover, it is a quantitative variable because it indicates the number of projects that each team has completed in a year. The scale of measuring the effectiveness of the team members is an interval scale. Comparatively, the independent variable is the three teams of study (A, B, & C). The three teams exist as discrete variables, which are in the categorical form. The scale of measuring the three teams is the nominal scale.
Descriptive Statistics
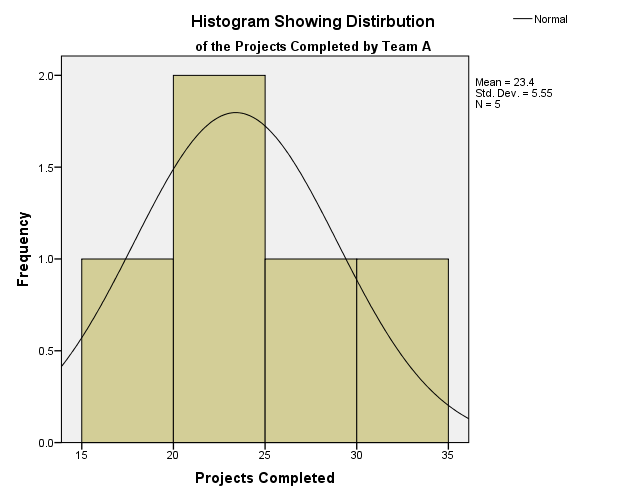
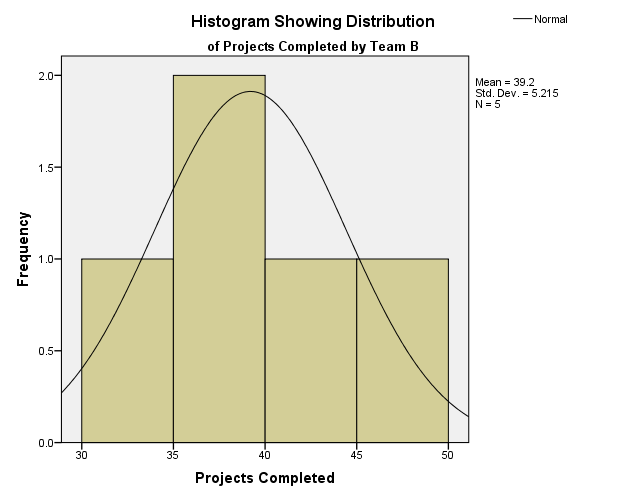
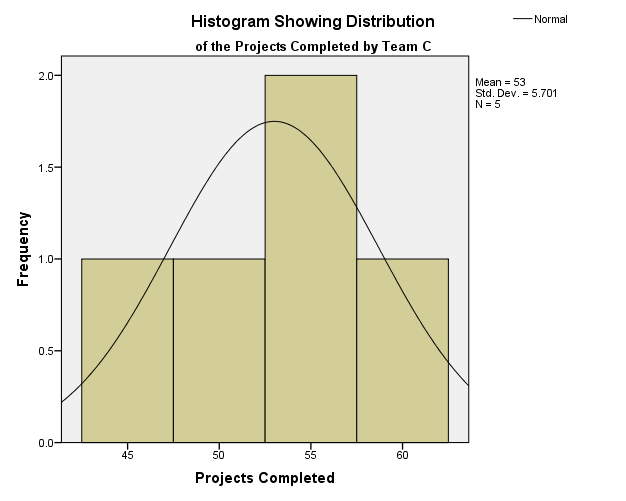
The team members who participated in the study are 15 (N=15). Each group had five members grouped according to the level of experience in years. The descriptive table above shows the level of effectiveness in terms of projects completed by the team members in team A, B, and C. Members in team A have a maximum projects of 31 and minimum projects of 16 with a mean of 23.40 and standard deviation of 5.550 (M = 23.40, SD = 5.550). Comparatively, team B members have a maximum projects of 46 and minimum projects of 32 with a mean of 39.20 and a standard deviation of 5.215 (M = 39.20, SD = 5.215). Likewise, team C members have a maximum projects of 60 and minimum projects of 45 with a mean of 53.00 and standard deviation of 5.701 (M = 53.00, SD = 5.701). The median for the team A is 22.00, for team B is 38.00, and for team C is 55. The variance for the team A is 30.800, for team B is 27.200, and for team C is 52.500.
Figures


The distribution portrayed by the effectiveness of team members in each of the three groups closely follows normal distribution. The skewness and kurtosis of team A is 0.112 and 0.418 respectively. Team B has skewness and kurtosis of -0.118 and 0.264, while team C has -0.405 and 0.178 respectively. According to Bryman and Cramer (2005), when the values of skewness and kurtosis are close to zero, the distribution curves approach the normal distribution. Hence, in this case, the effectiveness of team members in each group depicts distribution that is close to a normal distribution as shown by the above figures (figure 1, 2, and 3).
ANOVA Test
The type of ANOVA conducted is a one-way ANOVA test because the attributes of variables meet its assumptions. The three assumptions of one-way ANOVA are that the dependent variable must exist as an interval scale, must have no significant outliers, and must follow a normal distribution. Thus, the effectiveness of team members meets the three assumptions of one-way ANOVA, as a dependent variable. Additionally, another assumption of the one-way another is that the independent variable must exist as a categorical scale with two or more categories. The three teams form an independent variable, which meets the assumption of ANOVA. The one-way ANOVA is a one-tailed test because it shows the relationships among the three teams using one variable.
Hypothesis Testing
The ANOVA table below shows that the sum of squares between groups is 2193.733, while within groups is 362.000. The p-value of the test is 0.000, which is less than the significance level (p<0.05). When a p-value is less than the significance level, it implies that the null hypothesis is not true (Jackson, 2012). Therefore, the study rejects the null hypothesis and accepts the alternative one. The alternative hypothesis, therefore, states that the level of experience among members in the three teams does influence their effectiveness in successful completion of projects across the year.
Since the independent variable has three groups, it is possible to conduct post hoc analysis. Post hoc analysis shows multiple comparisons of the three teams and test if there is a significant difference in effectiveness among the teams. The multiple comparisons table below shows that all the p-values are below the significant level (p<0.05). This means that there is a significant difference in the effectiveness of team members among the three teams as depicted by ANOVA test.
Conclusion
From the results, one can conclude that the level of experience influences the effectiveness of team members since the ANOVA test and post hoc analysis shows that there is a significant difference in effectiveness among the three teams. However, one cannot generalize these findings to other teams because the study sample is too small (N=15) to warrant extrapolation of the findings. Hence, in the interpretation of the findings, one needs to consider that the study employed a very small sample, which makes the results not to have a robust external and internal validity.
References
Bryman, A., & Cramer, D. (2005). Quantitative data analysis with SPSS12 and13: A Guide for Social Scientists. New York: Routledge.
Jackson, S. L. (2012). Research methods and statistics: A Critical Thinking Approach (4th ed.). Belmont, CA: Wadsworth.