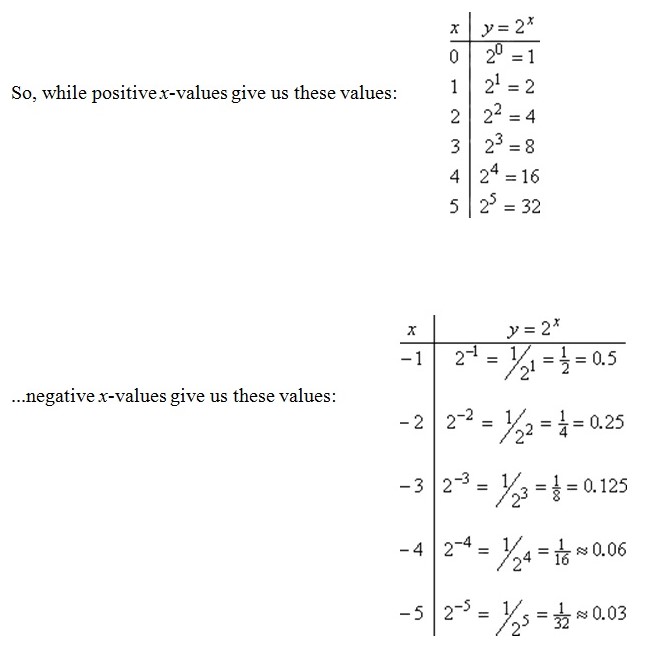
Exponential functions are functions of the form g(x) = nx with x being the variable and is the power of a base n which is a fixed number. For analyzing things with example g(x) = 2x,, we evaluate the given function with selected ordered values of x. The function gives a range of values with respect to the values assigned. The testing of the function is done with both a positive range of values as well as a negative range of values (Stapel, 2006, a).

Exponential functions graphs are developed on the basic property which suggests that exponential functions change by a given proportion over a set period of time. The outcome of an exponential function has the tendency of either being very close to one fixed value or will be too large. The exponential behavior observed in real-time experiments is seen in medical science when an isotope decays to half the previous amount every twenty minutes. Similar behavior is observed with bacteria culture that triples. In both cases, quantity changes by a constant proportion (Stapel, 2006, b).
Now we develop the graph of the example g(x) = 2x

On analyzing the graph, we find that the values of the function for negative values are so small that they’re practically indistinguishable from the x-axis but with positive values of x, the function starts growing at a very fast rate (Stapel, 2006, a).
The logarithm function is technically the opposite of the exponential function. The connection between the two can be understood with this demonstration:
Let’s start with an exponential function: y = box. Now for this exponential function, equivalent logarithmic statement would be log(y) = x. The function is pronounced as “log-base-b of y equals x” and “b” is called “the base of the logarithm”, in the same way, b is the base in the exponential expression “box“. For both exponential and logarithmic functions b is always positive and must not b equal to 1 (Stapel, 2006, c).
There are rules for logarithms.
Log Rules:
- logb(mn) = logb(m) + logb(n)
- logb(m/n) = logb(m) – logb(n)
- logb(mn) = n · logb(m) (Stapel, 2006, d).
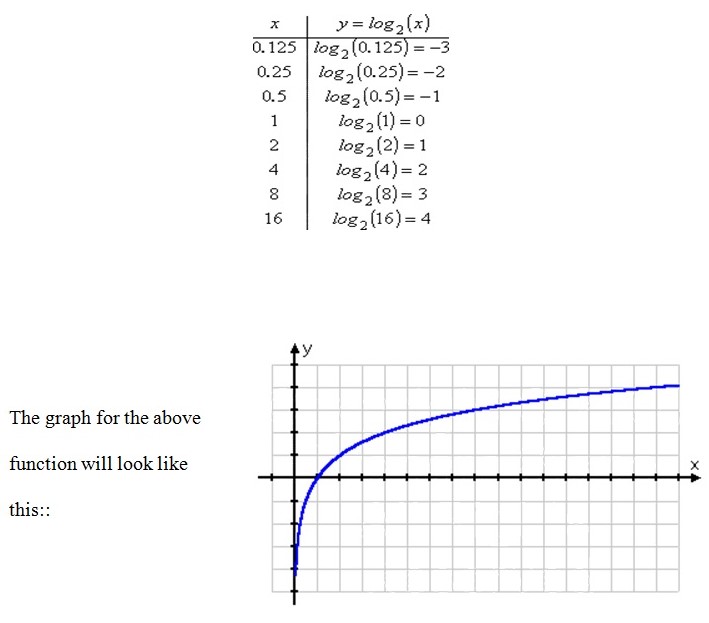
By nature of the logarithm, most log graphs tend to have the same shape (Stapel, 2006, e).. We now begin with an example: y = log2(x). Values of y for different values of x give this chart.

References
Stapel, Elizabeth. (2006, a)”Exponential Functions: Introduction.” Purplemath. 2008. Web.
Stapel, Elizabeth. (2006, b) “Graphing Exponential Functions: Intro.” Purplemath. Web.
Stapel, Elizabeth. (2006, c) “Logarithms: Introduction to ‘The Relationship’.” Purplemath. 2008. Web.
Stapel, Elizabeth. (2006, d) “Basic Log Rules / Expanding Logarithmic Expressions.” Purplemath. 2008. Web.
Stapel, Elizabeth. (2006, e) “Graphing Logarithmic Functions: Intro.” Purplemath. 2008. Web.