Abstract
The purpose of this study is to compare the financial performance of two cement companies of Saudi Arabia to assess the contribution to the national economy as a potential non-oil sector. However, this paper will concentrate on the Saudi Cement Company (SCC) and Yamamah Saudi Cement Company (YACCO) to evaluate the financial performance before, during and post-global economic downturn. SCC is a Saudi Joint Stock Company that started its journey in 1955 with the key objective to produce cement (fortification product) and it mainly operates two cement plants in the Eastern Province of the KSA. On the other hand, YACCO was established in 1961 with a wide range of product lines to meet the demand in the central zone. However, the first chapter of this paper concentrates on the background of the topic, objectives of the study, and scopes of the research to address the financial aspects of these two companies. In addition, this paper will focus on the companies’ balance sheet, cash flow and income statement, valuation, risks, ratio analysis like current ratio, quick ratio, return on equity, return on assets, return on capital employed, net profit margin and so on.
Introduction
Background of the topic
The aim of the first chapter is to concentrate on the overview of the topic mainly the influence of the global economic downturn on the cement industry in Saudi Arabia as an important segment of the non-oil sector. In accordance with the annual report 2010 of SAMA (8), the financial growth rate of the world economy turned down from 5.2% in 2007 to 3.2% in 2008 because of the global economic downturn but a financial system of KSA recorded extraordinary growth in 2008 as a consequence of the constructive advancement oil market (oil price $147.0/barrel) though oil price declined subsequently. On the other hand, few non-oil industries experienced economic growth in 2008 but the global economic downturn adversely influenced the capital market, employment and interest rate, foreign direct investment (FDI), baking sector, stock market, mortgage market, construction industry and private investment sectors. In addition, according to the forty-fifth annual report of SAMA, the Saudi banking sector have also suffered from serious liquidity crisis like other foreign banks, as a result, banks were reluctant to provide loan to young people for construction projects due to a lack of confidence in them. In this circumstance, the renowned cement companies in Saudi Arabia had faced financial loss. As a result, the purpose of the topic is to focus and compare the financial performance of two cement companies Saudi Cement Company (SCC) and Yamamah Saudi Cement Company (YACCO) for three distinct periods (before, during and post) of the global financial crisis.
On the other hand, the Saudi cement industry gained a steady growth before the global financial crisis, but during and post-crisis period, it has concerned with progressively more antagonistic and disorderly environments of the domestic market, which is insufficient to face the challenges of quick-shifting while society is arguing to represent optimistic technological needs, encouraging incentives, and affirmative export. In addition, the most noteworthy dilemma is that the non-oil sector of Saudi Arabia has basically been mistreated to take into consideration the impact of globalization as well as analyzing the impact of being a WTO member while the governmental focal point has failed to address appropriate policy and practice for the non-oil sector. However, all the cement companies in Saudi faced intense competition from foreign and local companies for the membership of WTO from 2005, but it also helped the local players to enter the foreign market as the capacity of production of all the cement companies in Saudi was more than 37.0 million tonnes whereas the demand was only 31 million tonnes.
Thus, there exists a major research gap to integrating the factors resisting the improvement of the non-oil sector of Saudi Arabia coordinating with the value chain of the cement industry for reconfiguring the standard of the domestic market. The process of cement industry’s motivation could attain such gaps by identifying those factors to bring improvements of Non-oil sector integrating with the changing dynamics of the market and such studies would be able to quantify the short and long-run costs and benefits for the contemporary the Non-oil sector of Saudi Arabia to enhance the management process improvements. Therefore, for this research paper, it is important to look for a literature search on the coordination of the cement industry as a major player in the non-oil sector. At the same time, the non-oil sector of Saudi Arabia has evidenced to have a growth rate of 3 % inspired by the accelerated governmental expenditure agenda along with different growth rates in different industries while the construction industry grew at the rate of 3.9 % including the cement industry in 2009 (NCB, 30). Due to the introduction of the Peak oil conceptual framework the government is under pressure to go faster expansion of the non-oil sector, at the same time, the development partners and academia have emphasized exploring the non-oil sector from theoretical perspectives as oil is a finite resource. However, the government has practically realized the necessity of developing the non-oil sector due to the fall of oil price and concerned reduction of oil production, and this research paper concentrate on the cement industry as a promising and exploring sector for the development of the national economy.
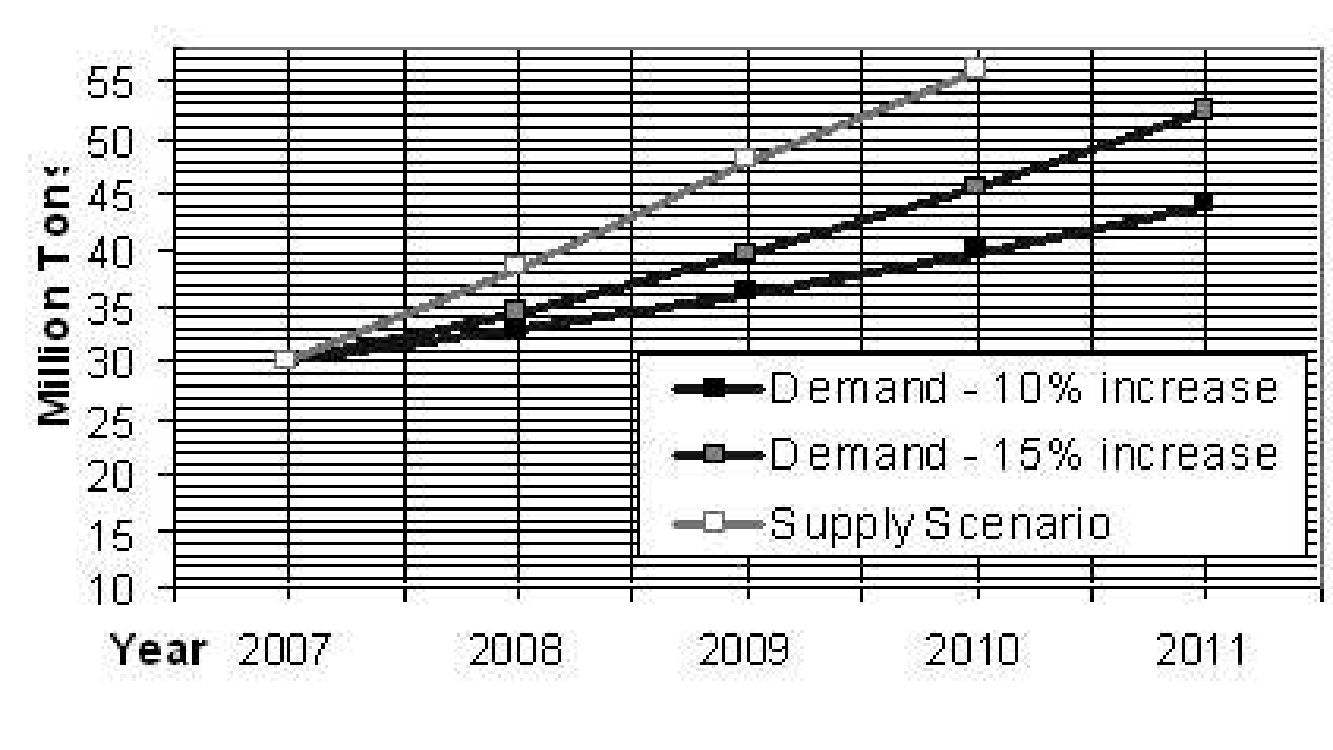
However, the rationale to select cement industry is the demand for cement is increasing and the main companies have the capacity to export their products in the foreign market to generate revenue. Al-Nagadi (2) pointed out that KSA is the biggest construction market in the Middle East with multibillion-dollar projects and the construction segment in this country accounts for 8.0% of Gross domestic product, thus, the demand for cement is enhancing. However, the above figure compares the supply and demand capacity of the local companies and identifies that both production capacity and supply are higher than local market demand, therefore, this sector has long run prospects to export this product in the foreign countries by using foreign market entry strategies Al-Nagadi (8).
Objectives of the study
The aim of this research paper is to consider the cement industry as a prospective non-oil sector in Saudi Arabia and the financial performance of this sector at the time of the financial crisis, before and after the financial crisis. This paper seeks to address these issues because there is enough research with the implication of the non-oil sector of Saudi Arabia but there is a small number of recent researches observe cement industry as a potential non-oil sector and existing literature on the non-oil sector has not yet been addressed the dilemma of sustainability and value chain of the cement industries. There is no research agenda has yet raised to what extent the non-oil sector especially the cement industry of Saudi Arabia would be capable to sustain before, during, and after global financial crisis or how the cement industry of Saudi Arabia would capable to encounter foreign competitors due to the impact of being WTO member. There is also no elaborate study concerning the emergencies before, during, and after the global financial crisis in Saudi Arabia integrating with factors threatening the non-oil sector for enhanced importation and access of foreign competitors in the market.
This research has intended to analyze and compare the financial ratios of two leading cement companies and aimed to coordinate pact with the results that would provide a most advantageous solution for the investors and policymakers for the right direction to explore the non-oil sector of Saudi Arabia. It would also identify the acceptable value chain of the Saudi cement industry and argue for appropriate strategies satisfactory to the academia and legislators in this region while the management of the non-oil sector would be convinced and they will take appropriate steps to make necessary changes to their existing operational strategies. By addressing the research questions, it has also aimed to generalize the standard of factors that influence the non-oil sector of Saudi Arabia to ensure sustainable growth in the emerging market of the GCC region, it also inspires the management of the non-oil sector to enhance their investment to expand their operation. Moreover, the proposed research would demonstrate the strength and weakness of the cement industry of Saudi Arabia and also argue for optimal solutions for coordination with the objectives of strengthening the non-oil sector of the kingdom.
Scopes of the study
This dissertation has scope to compare the financial performance by addressing the following issues:
- This research paper has scope to analyze the Saudi cement industry as a potential non-oil sector of Saudi Arabia
- It has to observe the business environment of three periods to measure the impact of the financial crisis on Saudi cement industry;
- It has the opportunity to analyze financial performance and to compare the major cement companies like Saudi Cement Company and the Yamamah Saudi Cement;
- In addition, it has also scope to highlight to what extent SCC and YACCO can overcome the adverse position of the global recession in the present time;
- Moreover, it has scope to measure the domestic market competition in cement industry with real evidence;
- In the comparison, the chapter would focus on the contribution of the financial ratios to take future investment decision and setup new strategies for the future;
- Considering the financial analysis of two companies, this research paper would recommend for further development of the companies.
Methodology in brief
According to the view of Malhotra (132), there are two types of research approaches for example qualitative and quantitative research methods. The research paper would only follow a qualitative research approach to measure the financial performance of two cement companies of KSA. However, secondary data sources like an annual report for the last three years, financial reports, Global Research reports of two companies SCC and YACCO would be used in order to calculate financial ratio analysis, discounted cash flow (DCF), dividend discount model (DDM), Weighted average cost of capital (WACC), dividend yield ratio, earning per share ratio, and so on. However, these calculations would help to provide suggestions to the companies to develop the Saudi Arabian cement sector in the national and international markets.
Literature Review
Cement Industry Overview
History
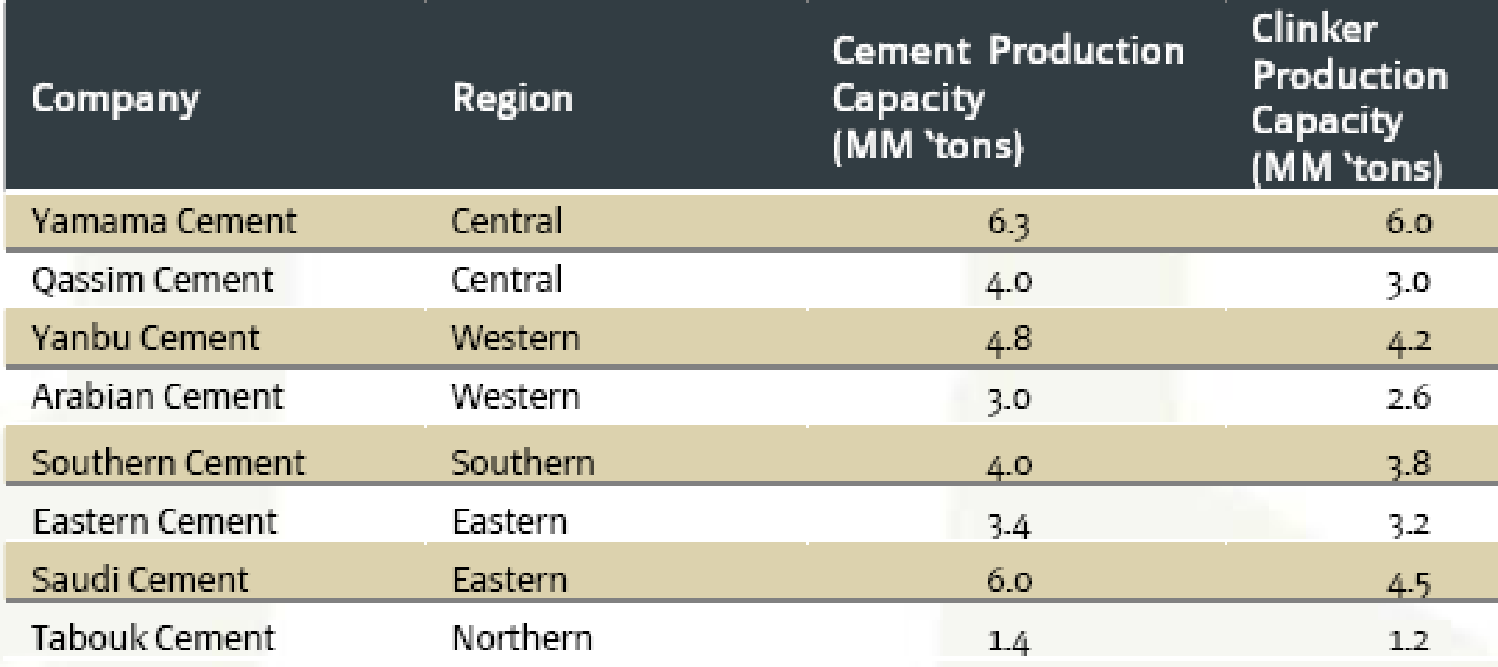
According to the report of Al-Rajhi Financial Service, there are eight listed cement companies with 33.1 million tones production capacity whereas other GCC countries have very few cement companies. As a result, the Saudi cement industry has huge scope to export cement to the GCC countries to meet the large market demand due to liberal regulatory framework. At the same time, the macroeconomic situation of GCC countries had improved because of increasing oil prices, therefore, the real estate business with big construction projects are well-developed sectors in this region. In this context, Saudi Arabian cement companies export surplus products to the GCC countries, which helped the nation to increase the national GDP from the cement sector (Al-Rajhi Financial Service 8). On the other hand, Al-Rajhi Financial Service (11) further reported that the Saudi cement industry has glorious historical background while Saudi Cement Company started its journey in 1955, Arabian Cement was established in 1956, Yamama Cement started its journey in 1961, Qassim Cement and Yanbu Cement started business operation in 1976. However, it is one of the most potential sectors the cement manufacturers because the government of this country was invested about 17.0% of its GDP on infrastructure, but now they invest more than 30% of its GDP on infrastructure development projects such as millions of housing projects, roads and railways, water-plants, sewerage and electricity plants (Al-Rajhi Financial Service 11). However, there are mainly eight cement companies in Saudi Arabia and these companies face intense competition in the local market due to high production capacity and offer good quality. The following table provides some information among the top competitors of the cement industry in this country:
Table 1: Market share of key competitors of Saudi Cement Sector
Construction industry of Saudi Arabia faced serious problem during the global financial crisis but this sector is recovering because of sustained high public spending and better financial positions. Here, it should note that the Saudi cement industry experienced difficulties in business operation not only for a global economic downturn but also for the government policy such as export ban reduced sales of the companies. The above figure shows that Saudi Cement held the largest market share before and during the time of the global financial crisis but this company failed to maintain this position due to the adverse impact of the crisis. However, the following figure gives more information about the sales volume and gross margin of the competitors:
Table 2: Sales volume and gross margin of key competitors
Company Profile
Saudi Cement Company SCC
Saudi Cement Company (SCC) is a Saudi Joint Stock Company formed in 1955 with the key aim to produce cement (fortification product) and spend in cement-based product areas; SCC mainly runs two cement plants in the Eastern Province of the Kingdom of Saudi Arabia, which are Hofuf Plant and Ain Dar Plant.
A short and precise summary of the chronological background of this renowned Saudi Arabia based business has provided in the following section from the very beginning of the firm and until the recent years:
- According to Global Research SCC (12) Saudi Cement Company commenced its long enduring journey on the very beginning of 1961 while a single burning chamber of about three hundred tons of clinker had installed for every day at the Hofuf Plant at Saudi Arabia
- Starting from that time, the Hofuf Plant was able to carry out 4 growth measures together with reconstructions as well as advancement of the firm’s plants and factories; the final one was implemented in 1997 when 35 hundred tons of cinder power had adjoined, conveying the overall power of the factory to 78 hundred tons of clinker for everyday
- In about 1981, Ain Dar factory of this famous firm began with the power of a sovereign group with the banner of Saudi Bahraini cement corporation; over here, four burning chambers of 15 hundred tons of clinker power for all of those had put into practice (that is, an overall power of six thousand tons of ashes for every 24 hours and seven weeks)
- This sovereign group (Saudi Bahraini Cement Corporation) put on the audacity in order to carry out uninterrupted business practices autonomously until the end of 1991; on the very beginning of 1992, this separate business entity became committed to join with some other business to strengthen itself and finally acquired with SCC (and now running under the name of SCC)
- The administration and human resources of the business: the firm has until now ran handled by a Board of Directors consisting of eleven partners; the most of the partners at this board are all quite well known businesspersons both in the KSA, in the GCC countries and globally
- The human based resources, jointly in the factories and headquarters in Dammam of Saudi Arabia consist of people from different countries; moreover, the potency of the human resources are sufficiently high to the degree of works carried out daily at all the factories which encompasses high temperature burning machinery and the necessities of supplementary and interrelated amenities.
Yamama Saudi Cement Co. Ltd.
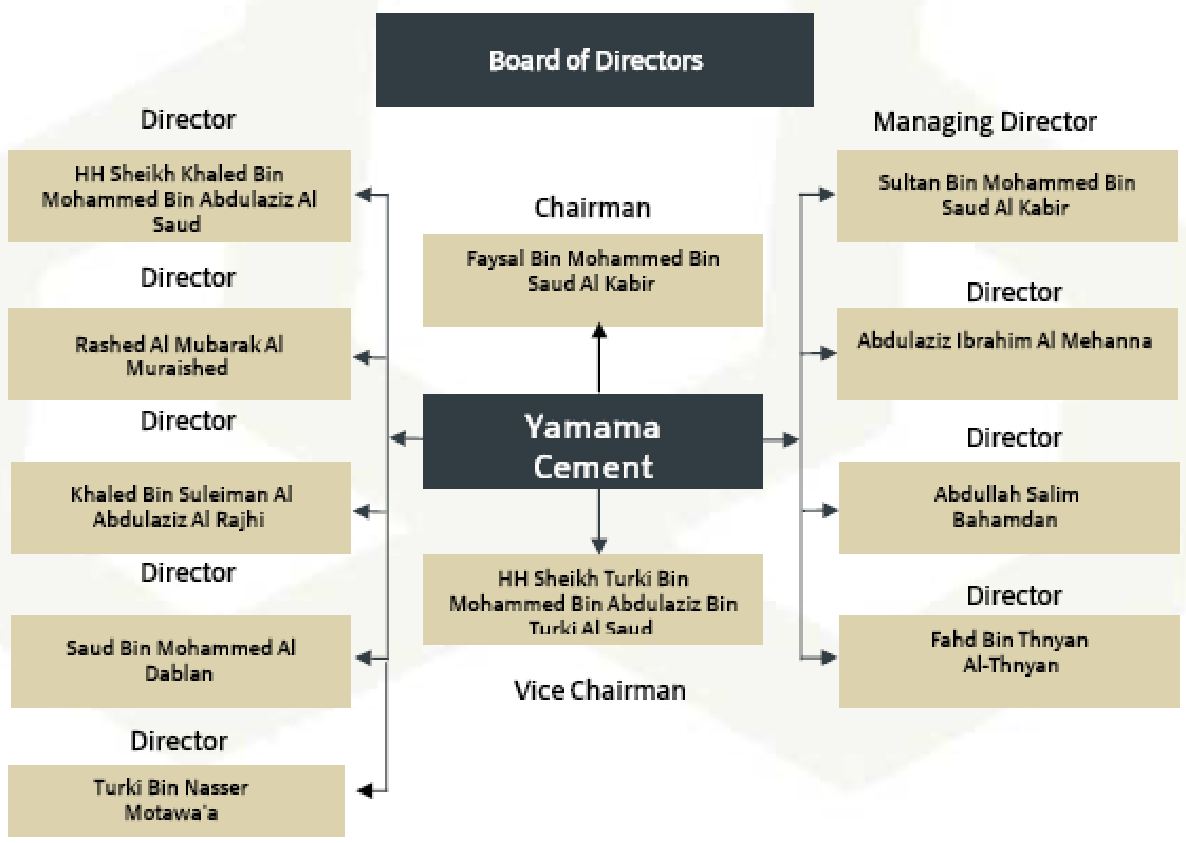
Bloomberg Businessweek (1) suggested that Yamama Saudi Cement Co is associated with the production and marketing of cement in the Kingdom of Saudi Arabia, which possesses a wide range of product lines, comprising of normal Portland-cement, sulfate-resistant cement, white cement, colored-cement, oil wells-cement, quick-setting cement, pozzolana-cement, and bacteria-resistant cement; the firm had established in 1961 with head office in Riyadh. Most of the members of the Board of Directors together with the managing director are quite prominent business personalities in the Arab world. The table below shows the name of these renowned businessmen at the Yamama Saudi Cement Co:
Table 3: The businessmen at the board of directors of the company
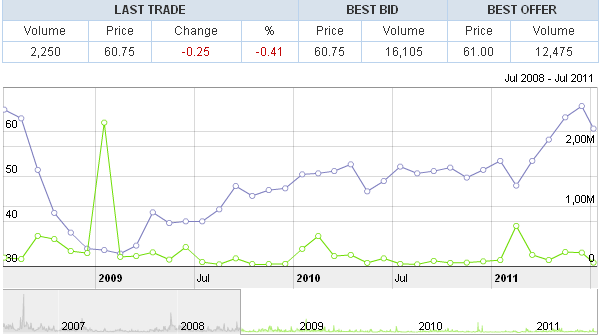
In recent years, Yamama Cement’s manufactures has enlarged further Riyadh increasing sales ad revenues; in 2007, the business’s upper sales level raised by approximately twenty five percent to eleven thousand eighty five million riyal primarily because of rising sales of the company’s products that augmented from 3.8m tonnes in 2006 to 4.6m tonnes in 2007. Out of the 4.6m tonnes, three million and thirty-nine tonnes had sold abroad by the company for the very first instance in Yamama’s history of operations, largely in the Middle East and adjacent nations of the Kingdom of Saudi Arabia (like the United Arab Emirates). Yamama Cement runs in Saudi Arabian capital, Riyadh, where a large amount of development plans provides a rising use of construction resources ahead of the estimated period; to mitigate rising demand, Yamama roughly doubled its facility headed for late 2006 to 6.6m tonnes, backed by the right concern of 2:1 and 2 bank-loans of 400m and 387.2m riyal. However, the following figure shows the Volume and Last Trade Price of Yamama Cement –
Demand
The Saudi Arabian cement companies meet the demand of local market and export products in the GCC countries (Al-Rajhi Financial Service 13). However, the demand for cement varies from area to area in the country; for instance, the demand is extremely higher in the central zone but lower in the Northern zone. At the same time, the demand for cement is increasing steadily in the Eastern and Western areas in the country. However, the following figure shows the national market demand area-wise –
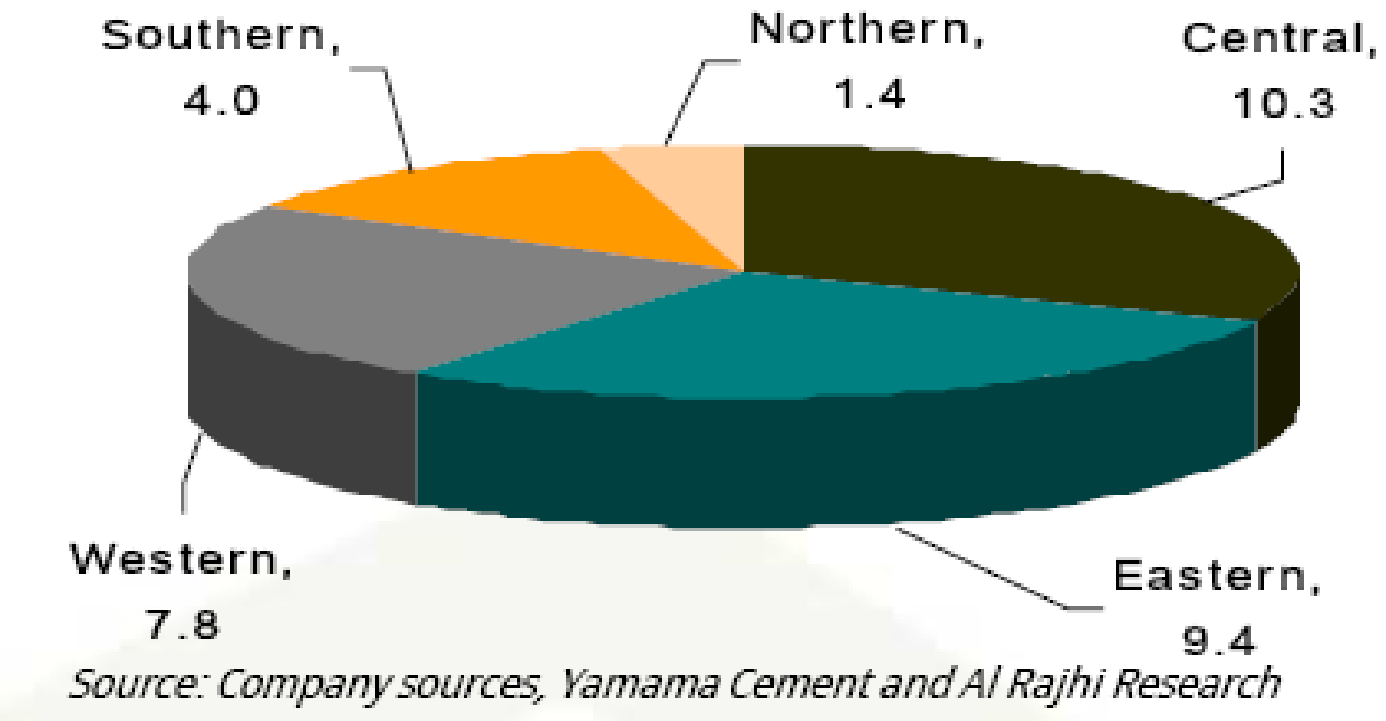
According to the next figure, Yamama Cement is the dominant market player of the central zone while this company meets 60% of total market demand in this area. On the other hand, Saudi Cement is the market leader of the Eastern zone and this company also has the capacity to meet a significant part of the demand in the region (Al-Rajhi Financial Service 13). However, the following figure gives more information about the companies’ capacity to supply cement –
Job, Career, Employees
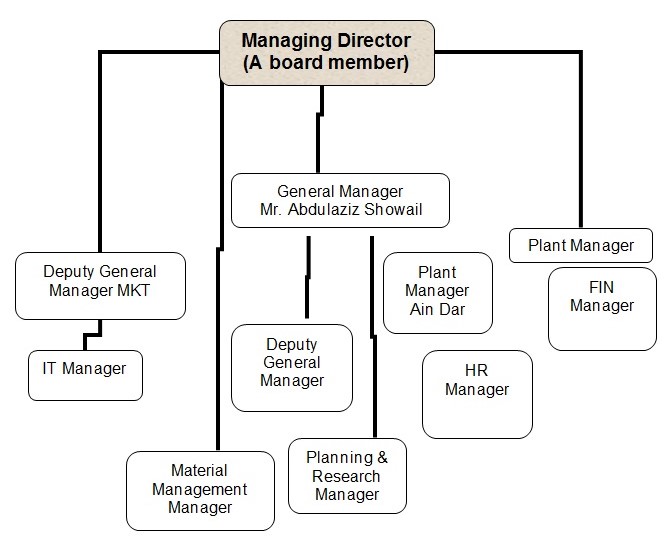
Saudi Cement Company has given its workforces with induction, on-job, and off-job training by executive and schooling programs; this is the reason of why in 2008 with employees 1711 in total, sixteen out of sixty-three training programs conducted outside Saudi; the costs to carry out such activities boosted by 134.1 percent and reached 33.3m in 2008 from 14.2m in 2007. However, the managing director of SCC would be a board member who has control over the general manager of this company, the Deputy General, project management, the managers of information technology and so on (Al-Ghamdi 8). In addition, the managing director and general manager are also responsible for maintaining the human resource department, planning and research department and most importantly the finance department of Saudi Cement Company (Al-Ghamdi 8). However, the following figure also demonstrates the organizational structure of Saudi Cement Company more elaborately
At the same time, Yamama Cement Company has also maintained a simple organizational structure to control the employees and to take decisions related with corporate governance system. However, the Board of directors of this company consists of a chairman and a vice-chairman with nine individual directors who are responsible to provide service in different departments.
In addition, this company is committed to developing the facilities for the employees in order to advance their career path of the staff because job satisfaction is one of the most important issues to retain employees. Therefore, this company has invested to arrange a regular training program to utilize the efficiency of the employees and develop skills in specific fields in the cement industry. At the same time, the employees gather knowledge about cultural and motivational factors that influence them to communicate with others, as 40% of its total employees are foreigners.
Growth & Competition
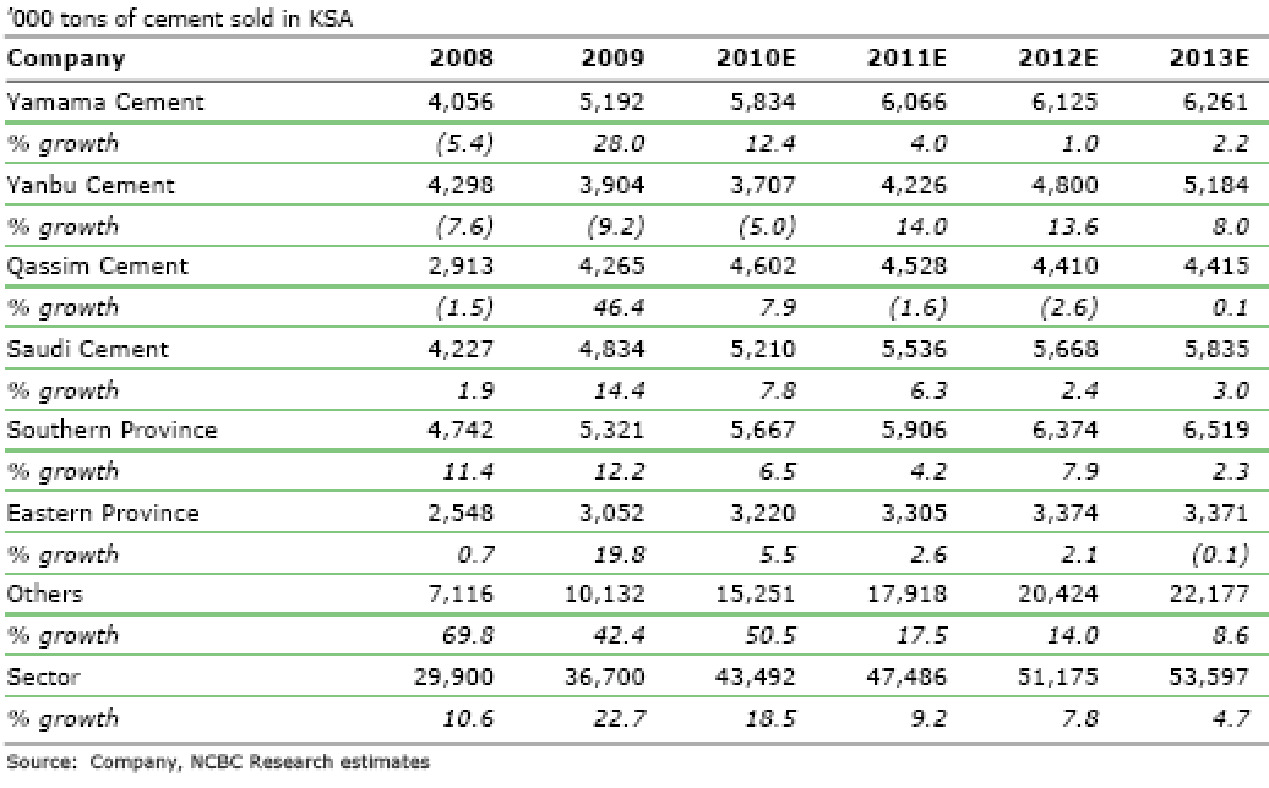
During the time of the global financial crisis, the growth rate of Yamama Cement had declined by 5.4%, but this company successfully recovered such a position within one year and experienced a 28% growth rate in 2009. On the other hand, the growth rate of Saudi Cement (SCC) was not satisfactory during the recessionary period and it was only 1.9% but SCC experienced a 14.4% growth rate in 2009 by implementing new strategies. However, the following figure shows the market growth rate of the competitors from the fiscal year 2008 to 2013 –
Financial Overview
According to the report of Global Research of Yamama Cement, this company has experienced huge success such as total assets, net revenue, operating income and net profit for the year 2009 have been decreased significantly from 2008; as a result, the return on equity decreased significantly from previous years. However, the following table shows the data for Yamama Cement of previous four fiscal years:
Table 4: Financial Overview of Yamama Cement
On the other hand, the main competitor of Yamama Cement is Saudi Cement, which started its journey in 1961 involved mainly in the manufacturing and marketing of cement, bags and so on (Global Investment House, 39). In addition, it also offers high-quality products to the customers; as a result, its earnings from sales have increased SR 156.1 million within the last 3 fiscal years, and net profit is in a stable position (Global Investment House, 39). However, the subsequent table demonstrates the financial data for Saudi Cement Company of last four fiscal years:
Table 5: Financial Overview of Saudi Cement Company (SCC)
From the key statistics of the two companies, it can be found that although the financial position of these two businesses seemed to be declining during the global financial downturn, but by the end 2010, they were gaining back the financial strengths.
Regulatory Environment and Industry Development
Regular responsibilities
Al-Ghamdi (7) pointed out that most of the Saudi cement manufacturers like SCC are much more aware of their individual responsibility from the board members to its executives. All they have a very particular number of board of members and all of the members of the board are well-known entrepreneurs KSA and GEC region with a global reputation. All the board members are in a straight line elected by the general shareholders while the board members are responsible to look after the interests of the company, the board members elect one chairperson who poses at the top of the decision making of the organization and allows the board implements corporate strategy at all level. The board is also responsible to select human resources identifying business strategies and implement a different strategy for the success of the company and protecting the interest of the stakeholders as well as contributing to the national GDP.
Legislation
The e-Standard Forum (29) and Malik (2) pointed out that the legislation of Saudi Arabia has established upon Shari’ah Law along with the core values of Islam though the country has long been integrating every prescription of IMF and World Bank as their own legislation without any debate. Under the present legislation, the listed companies in KSA have governed by the Companies Law – 1965, connecting with the law of commercial – 1930, Charter of Saudi Arabia Monitory Agency – 1952, Capital Market Law 2003, Foreign Investment Law 2000 and the Commercial Court Law – 1983, Merger and Acquisition Regulations along with listing rules of CMA (e-Standard Forum, 29).
At the same time, Saudi Arabia’s membership in the WTO has kept continuous pressure to open the door of the country for foreign cement without safeguarding the domestic cement manufacturers and as a result, the imported cement has deserted the local industries with abnormally lower prices than the local production cost. Moreover, the increasing governmental royalty for limestone consumption, extensive capital expenditure, the expensive production process for clinker, increasing gas and electricity price, and unjustified fixed price ceiling for cement has seriously threatened the Saudi cement sector. Therefore, the government of KSA should implement new laws to rescue the Saudi cement sector from such challenges and to address the right policy to safeguard the cement industry of the kingdom from probable collapse with appropriate strategies by analyzing the financial performance of the industry players.
At the same time, SAMA has introduced the responsibilities of the board of members together with the emergence of performing a well-designed system for accounting and internal control of commercial organizations with detailed responsibility of the audit committee within the board. As the compliance of the commercial organizations with the listing rules is observed by the Capital Market Authority, there are huge companies who are not following them, but all the cement manufacturers of Saudi Arabia are complying with the listing rules.
Regulatory Development
E-Standard Forum (29) pointed out that until 2006 there was no official corporate governance structure but market corrections were conducted through IMF prescribed FSSA that played a supervisory role through Capital Market Authority in the financial market, which is the initial state to corporate governance development in KSA. In 2009, World Bank has issued the ROSC on the status of Saudi corporate governance criticized the role of the Capital Market Authority including very particular recommendations and guidelines of practicing CG in KSA. The government of KSA has accepted the ROSC and made it compulsory to maintain corporate governance in accordance with the guidance of OECD through encouraging and applying in their legislation.
Considering the Saudi CG practice in the very early stage, the ROSC kept importance on disclosures concerning the ownership along with non-financial information, considering the prevailing disclosures of entrepreneur’s benefits including the establishment and responsibilities of the board members. It has also integrated the qualification of the board members, shareholders rights, and restriction on the market manipulation which has already been implicated by the CMA by introducing capital market law.
The World Bank (2) pointed out that the CMA has scrutinized with its enforcement powers, it also exercises to standardize control over the securities exchanges and supervise to what extent the corporations in KSA are complying the concerned corporate governance system and kept the highest effort to conducting consultative process among the concerned stakeholders with the aim make popular new regulations. It also identified that the functions of CMA are not conflicting but cooperating with the SAMA to regulate and administer diverse corporate bodies in many ways and both of the agencies enjoy enough administrative resources and financial independence. With joint efforts, the CMA and SAMA have taken the liability to construct awareness regarding the significance of strong corporate governance practices among Saudi companies keeping full attention to the greater interest of the shareholders and safeguarding stakeholders through better corporate governance where Saudi cent industries have evidenced better compliance in this respect.
The Theories of the Global Financial Crisis
The incidence of the disgraceful recession of 2009 was not an impulsive occurrence, but rather, a consequence of a long period of mismanagement and numerous consequential events. The plunge in the sub-prime mortgage market of the US has generated a serious liquidity trap in the US banking sector, the resultant effect of which influenced the international financial markets and spread out the liquidity trap and analogous financial dilemmas to Europe and later on to Asia and Africa. This has caused some rigorous impacts on the US investments and the country moved its investments from the stock market to oil investments; subsequently, the fuel costs rose at the highest peak of history. Following all these, the most alarming issue that has increasingly accelerated amongst the major players of financial institutions was the trend of bankruptcy. Consequently, the financial crisis transmitted all over the American commercial bodies, Europe, Central Asia, and the rest of the globe the result of which was the recession of 2009. The French bank BNP Paribas has indicated a high-interest rate as the central ground of the financial crisis; moreover, the governments have extended their hands to overcome the situation with bailout bills and other rescue packages, but the problem is entrenched for the long run.
The impact of Global Economic Downturn in KSA
The Saudi Arabian financial sector has gone through some level of changes resulting from the global economic downturn. Conversely, in some areas of the financial sector, no significant changes have occurred.
- Government investments: Saudi government has invested in the lengthy pipeline projects through utilizing their budget surplus; because of this, in the recessionary period, the Saudi financial market has forecasted a neutral impact
- Capital Flows: the recession has shaken the availability of fund pool, as a result, private capital flow or the FDI has slowed down significantly; besides this atmosphere, the Saudi government has expected a handsome amount of FDI due to their flexible buying power as well as friendly business atmosphere
- Private investment sectors: In the housing segment, Saudi has unfavorably affected, but this adverse circumstance has put several positive results in the real estate division; other private investments areas, which have worked for inhabitants’ necessities fulfillment has not yet negatively influenced the actual purchasing power of the Saudi clients.
Methodology
Financial Analysis
In order to Compare SCC and YACCO, this chapter concentrates on the financial forecasts, financial ratio analysis, valuation of the companies and risks.
Financial Forecasts
The purpose of this segment is to analyze the balance sheet, Statements of Income and cash flows for the period ending 2007 to 2010 of Saudi Cement Company (SCC) and Yamama Saudi Cement Co. Ltd in accordance with the reports of Tadawul and Global research.
Saudi Cement Company (SCC)
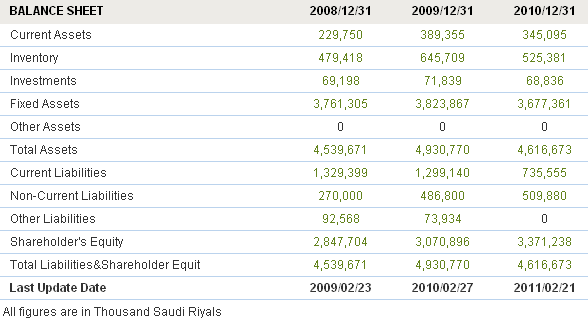
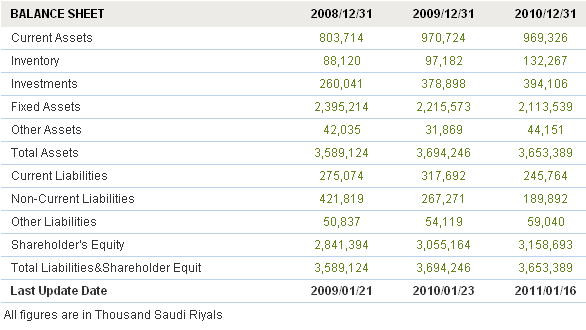
From the following balance sheet of SCC, the assets and liabilities show the long-term financial position of this cement company where the total amount of assets of the company at the end of the year 2009 was SR 4,930.770 million was SR 4,539.671 in the year 2008. On the other hand, the total amount of assets was SR 3,860.734 million in 2007 indicating a continuous enhancement in the fixed and current assets; therefore, the impact of the global financial crisis was not serious here. At the same time, total liabilities of this cement company were SR 1122.152 million in 2007, SR 1691.967 million in 2008 and SR 1859.874 million in 2009, which demonstrate an increased rate of liability during the time of global financial crisis.
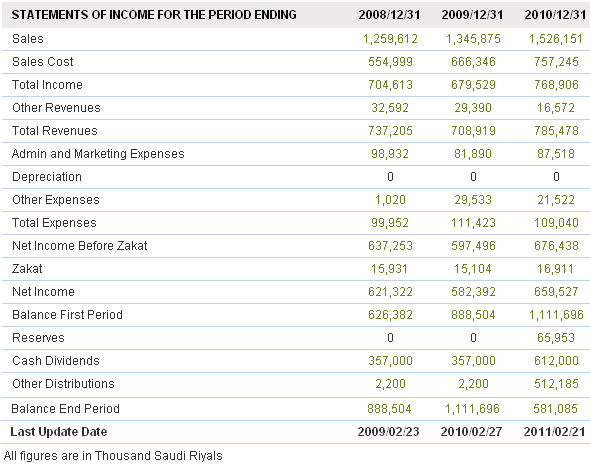
The consolidated income statement of the Saudi Cement Company presented the income and expenses of the company for the year 2007 to 2010 to compare the income and expense in three distinct periods of global economic downturn. However, the net income of the company was SR 686.397 million in 2007, SR 621.322 million in 2008, 582.392 million in 2009 and SR 659.527 million in 2010. From the net income, it can be said that Saudi Cement Company generated more profit before the global economic downturn because sales revenue had decreased and total expenses had increased SR 99.95 million significantly (Tadawul 1).
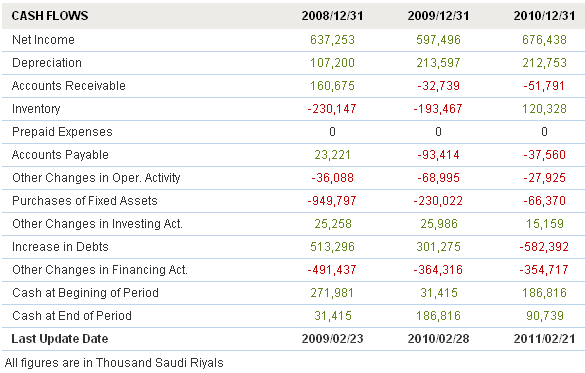
Cash is one of the main influential factors to any business because the company invests to make a profit through dealing with the cash; therefore, the cash flow statement is considered the key financial indicators for any company. However, according to the following cash flow statement, the cash inflow and outflow of Saudi Cement Company had shown from the year 2008 to 2010 for comparison with Yamama Cement Company in the recessionary period and after crisis moment. The cash flow statement of Saudi Cement Company demonstrates the main areas of cash inflow and outflow, such as, cash inflow includes net income, operating asset, and accounts receivable while cash outflow includes operating liabilities, investment, financing, purchasing of fixed assets and so on. However, cash at the beginning period of 2008 was SR 271.981 million and cash at end of the period of 2008 was SR 31.415 million while these amounts were SR 186.816 million and SR 90.739 million in 2010.
Yamama Saudi Cement Company (YACCO)
The balance sheet of Yamama Saudi Cement Company (YACCO) demonstrates the current condition of long and short-term asset and liabilities of the company from the fiscal year 2008 to 2010 in order to the gradual development of the company after the global economic downturn. In accordance with the following figure, this cement company had successfully enabled to develop the condition of the balance sheet by increasing total assets and decreasing liabilities to some extent. However, the total assets of Yamama Cement Company were SR 3,589.0 million in 2007 increased to SR 3,694.20 million by the last quarter of the fiscal year 2010 (Tadawul 1). Here, it is important to mention that the non-current liabilities of the company had increased due to recovery from the financial crisis in 2009, but the management of Yamama is trying to control or reduce these non-current liabilities.
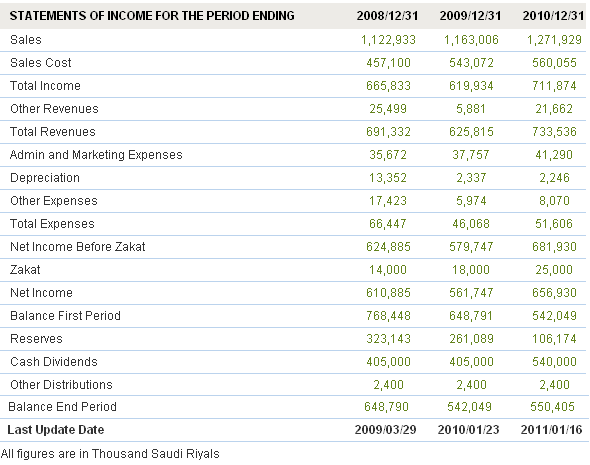
The profit and loss of the Yamama Saudi Cement Company is shown in the following income statements and demonstrates the main income source of YACCO sales of its products to the local customers. On the other hand, the expenses of the YACCO include salaries of the employees, rent and premises expenses, depreciation expenses, amortization, administrative and marketing expense, production costs, etc. The net profit of YACCO after the year 2007 was SR 731.4 million, SR 610.885 million in 2008 and SR 561.747 million in 2009. From the above data, it can be said that the net income of the company had decreased due to the adverse impact of the global financial crisis in the local market; within the time of economic downturn, the YACCO generated consistent profit, for instance, the net profit of Yamama Cement Company increased more than SR 95 million in fiscal 2010. However, the rising profit of YACCO not only contributes to the growth of this cement company but also to the national economy and cement industry as a whole, which encourages the shareholders to invest to build the confidence of customers in the bank.
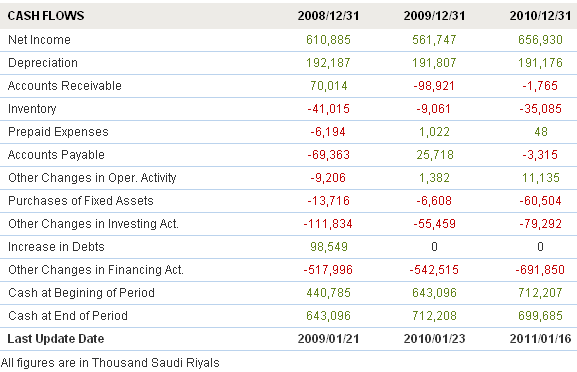
The subsequent cash flow statement of Yamama Cement Company illustrates the cash inflows and outflows of the company for the last four years and it focuses on three broad areas, such as cash outflow for operating activities, investment activities and other financing activities. On the other hand, there are mainly two sources of cash inflow in the case of the operating activities of Yamama Cement and those are inflow from net income and inflow from the operating assets. The cash flow statement shows that Yamama Cement’s debt increased in 2008 by SR 98.549 million but the cash at the beginning and end of the period of the fiscal year 2009 were much better than the previous years’ progress.
Financial Ratio Analysis
Current ratio
Table 6: Working Capital and Current Ratio analysis of Yamama Cement
Table 7: Working Capital and Current Ratio analysis of Saudi Cement Company (SCC)
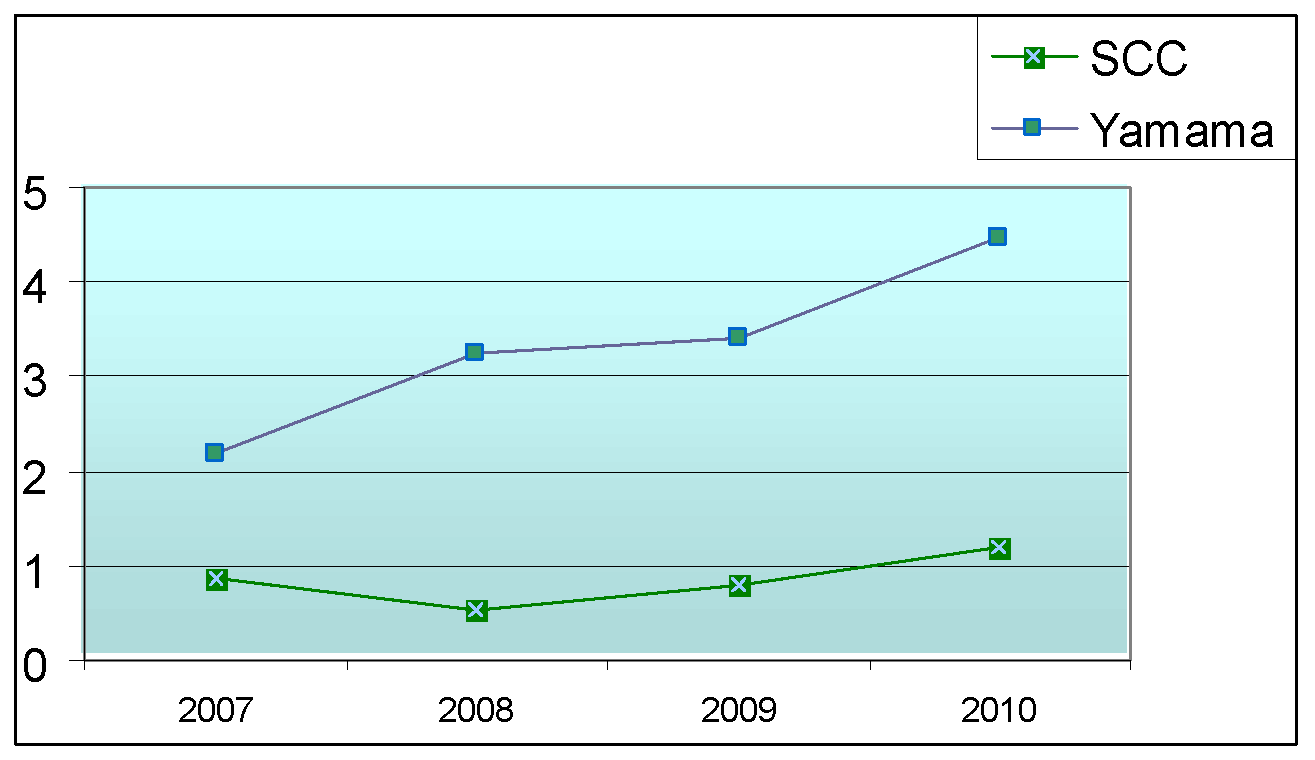
Current ratio is a common and quick evaluation of liquidity of SCC and Yamama, as it shows the margin of safety or cushion accessible to the creditors; moreover, it is an index for the financial stability and practical solvency and a directory of the strength of the working capital of these two non-oil giants of Saudi Arabia. As shown in the figure above, from 2007 to 2010, there has been a slow increase in the current ratio of Yamama. Conversely, SCC saw a sudden fall in the current ratio in 2008, which again gained a slow increase from 2009 to 2010.
Gross Profit Margin
Table 8: Gross profit margin of SCC
Table 9: Gross profit margin of YACCO
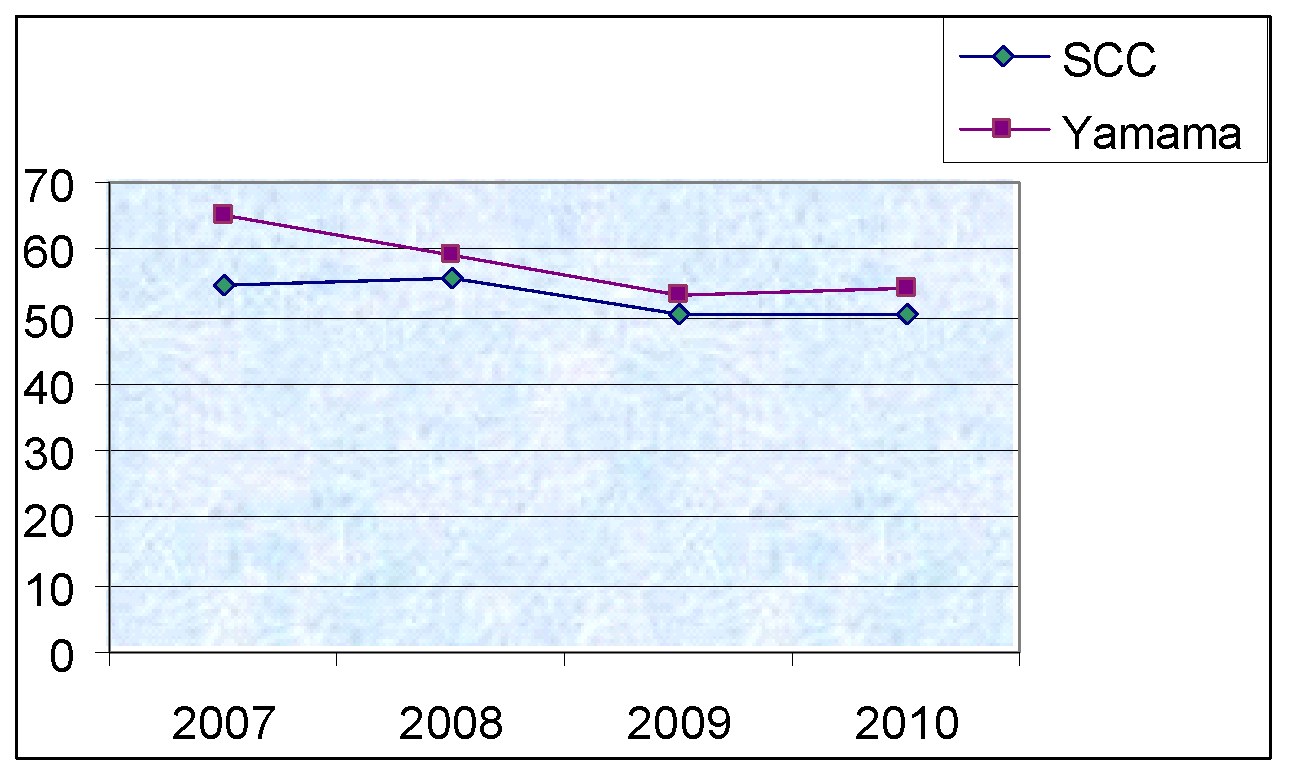
The gross profit margin is the proportion of the turnover, which a business preserves following the direct-expenses linked to generating the materials traded throughout a certain period; moreover, a rising profit margin means that the firm has good pricing strategy (it is able to lift prices with small or no effect on sales) or that it possess a rising productivity. However, as shown in the figure above, there has been a substantial decrease in the gross profit margin of both SCC and Yamama from 2007 to 2009 – however, from the very beginning of 2009 to 2010, the decreasing rate became quite stable, which indicates that the companies are trying hard to increase this ratio.
Net Profit Margin
Table 10: Net profit margin of YACCO
Table 11: Net profit margin of SCC
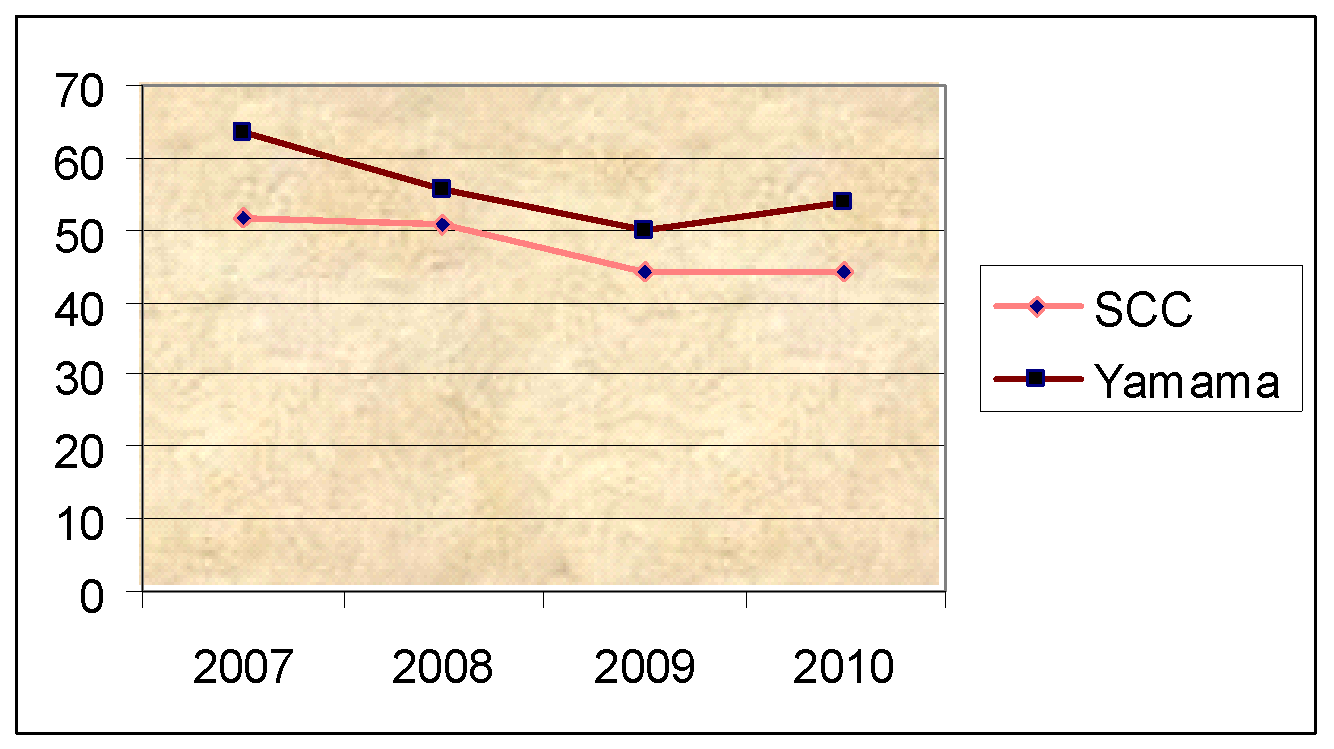
High net profit margin ratio shows how successful the firm is at changing sales into profit, and that the firm is capitalizing on some competitive-advantage, which can give it some additional capability and suppleness throughout the difficult financial periods; conversely, low net margin means the firm is not generating enough sales or it is not keeping your operating-expenses under control. Throughout 2007, 2008, 2009, and 2010, it is notable that the net profit margin of SCC has decreased so much, which was not expected by the company. On the other hand, although Yamama’s margin fell from 2007 to 2009, it has gradually increased from 2009 to 2010.
Asset Test Ratio or Quick Ratio
Asset test ratio would decline while cash or accounts obtainable balances reduce, devoid of an equivalent diminish in current liabilities, or boost in a current liability devoid of an equivalent boost in cash or accounts obtainable (for example, cash spent to buy fixed assets, cash spent to give off a long term debt, or cash spent to disburse dividends). The asset test ratio of both SCC and Yamama reduced from 2007 to 2008. However, from 2009 to 2010, it again started to gain back its position.
Acid-test Ratio
Table 12: Acid-test Ratio of Yamama
Table 13: Acid-test Ratio of SCC
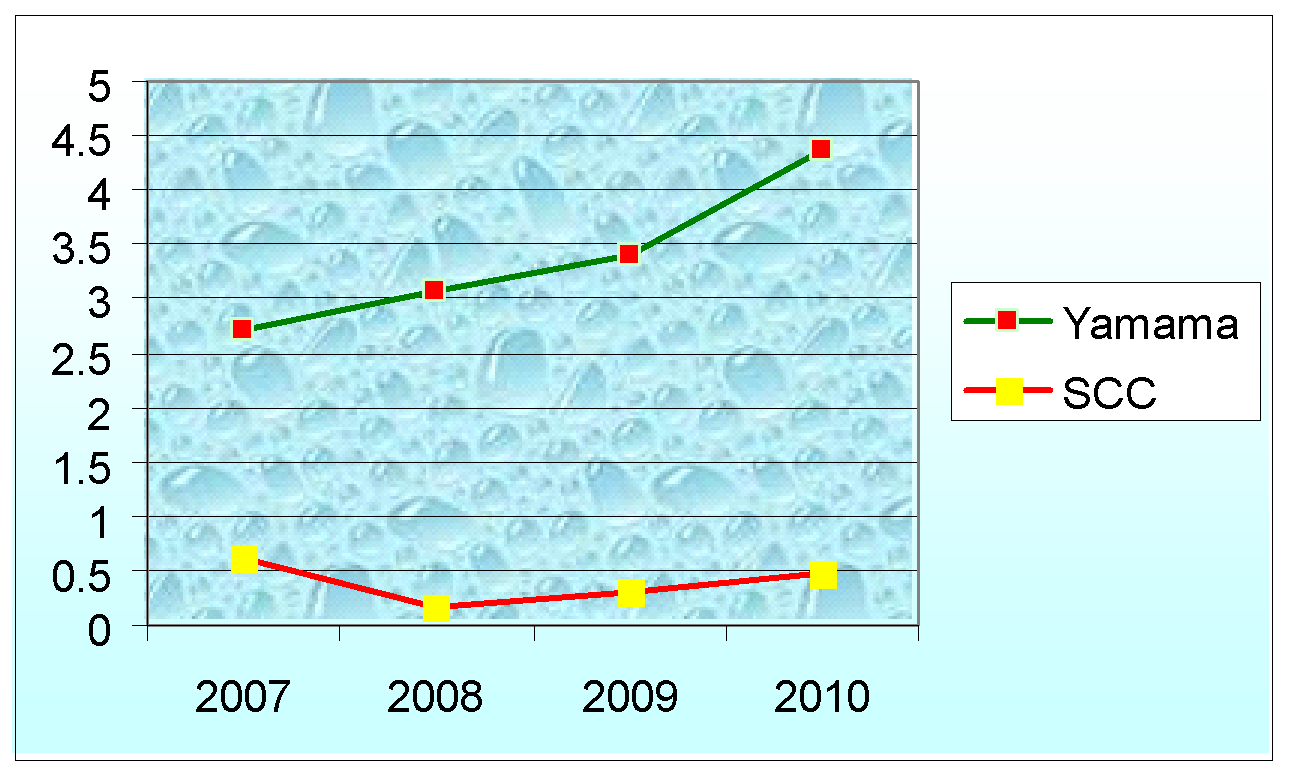
The above graph shows that from 2007 to 2010, there has been a huge gap between the acid test ratio of SCC and Yamama cement companies. While this ratio was 0.61, 0.17, 0.30, and 0.47 consecutively in 2007, 2008, 2009, and 2010 in case of the Saudi cement company; during the same period (that is during 2007, 2008, 2009, and 2010), the acid test ratio of the Yamama cement company was consecutively 2.1, 2.9, 3.1, and 3.9.
Debt Equity Ratio
Table 14: Debt Equity Ratio of Yamama Cement
Table 15: Debt Equity Ratio of SCC
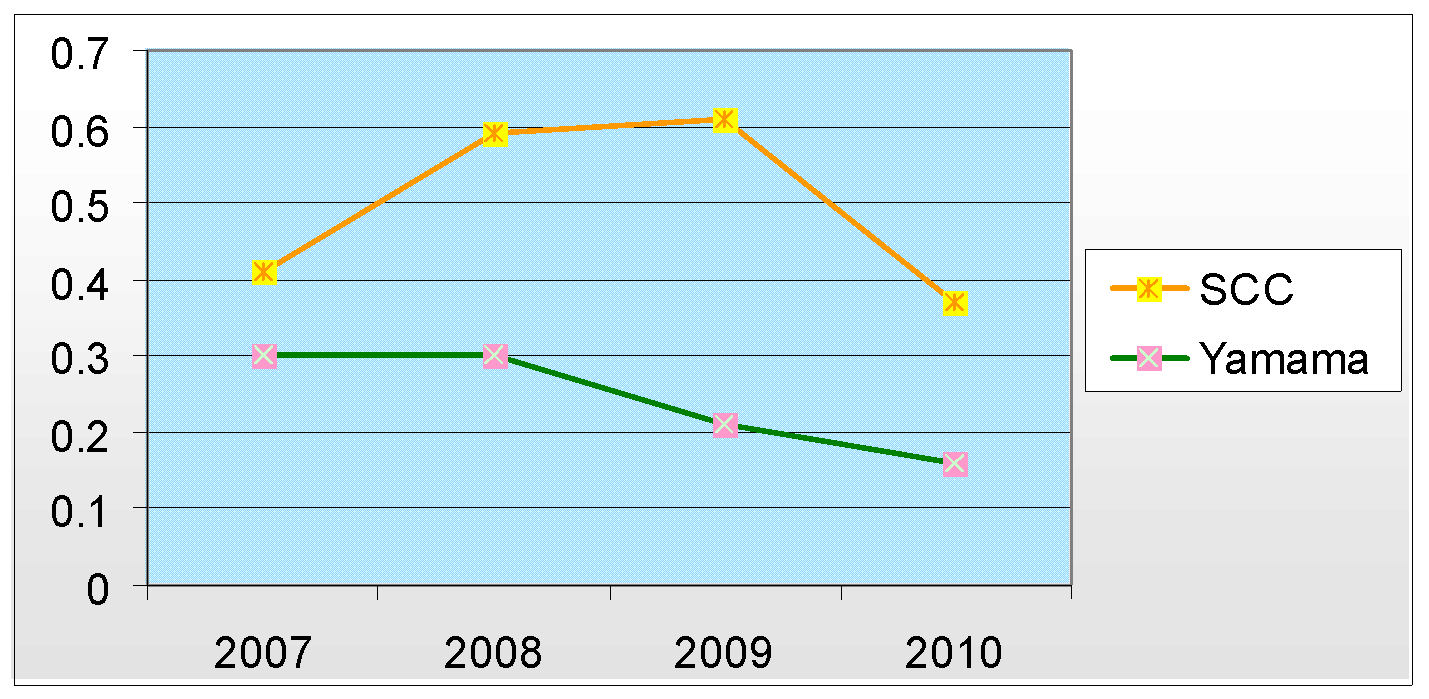
The above diagram demonstrates that from 2007 to 2010, debt equity ratio of SCC was far greater than Yamama Cement Company; whereas this ratio was 0.41, 0.59, 0.61, and 0.37 respectively in from 2007 to 2010 in case of SCC; in the same period the debt equity ratio of the Yamama cement company was consecutively 0.30, 0.30, 0.21, and 0.16.
Liabilities to assets ratio
Table 16: Liabilities to assets ratio of (YACCO)
Table 17: Liabilities to assets ratio of (SCC)
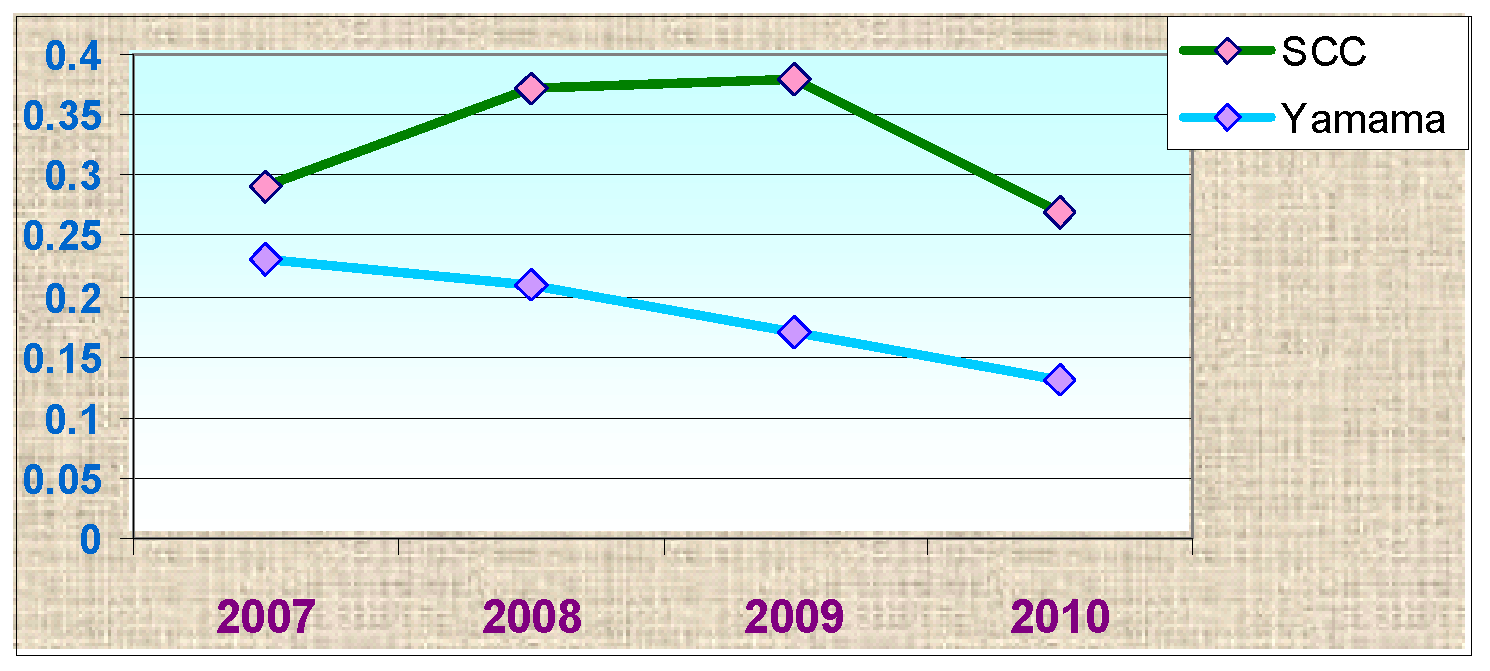
According to the figure above, starting from the same point in 2007, the liabilities to assets ratio of Yamama Cement Company went on to be far greater than SCC in 2008. The fluctuation rate of the liabilities to assets ratio or the dept-asset ratio is so high in the case of Yamama Cement Company that in 2009, it fell from a ratio of 2 to 0.17. A slow reduction of this ratio in case of SCC by the end of 2009 means that it was just above the ratio of the Yamama Cement Company. The dept-asset ratio point outs what percentage of the firm’s assets has been backed by debt; this ratio is quite comparable to the debt equity ratio – a ratio below 1 tells that a mainstream of assets has backed by equity, whereas over 1 tells that they has been backed more by debt; moreover a high-ratio shows a “highly debt-leveraged business”.
Return on Equity (ROE)
Table 18: ROE of Yamama Cement
Table 19: ROE of (SCC)
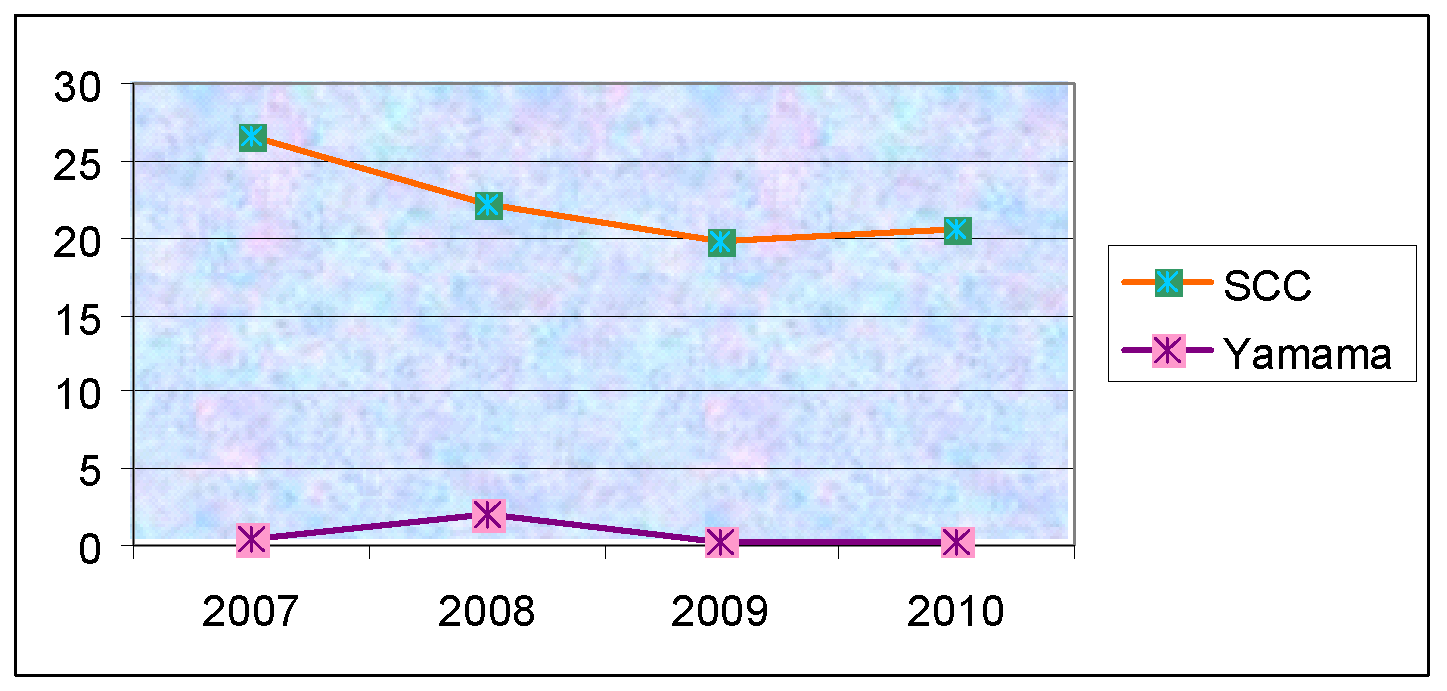
According to the figure, from 2007 to 2010, Return on Equity (ROE) of SCC was much higher than Yamama Cement Company; where ROE was 26.6, 22.24, 19.68, and 20.48 respectively in from 2007 to 2010 in case of SCC; in the same years the ROE of the Yamama cement company was 0.31, 0.22, 0.19, and 0.21.
Return on total assets (ROA)
Table 20: ROA of YACCO
Table 21: ROA of SCC
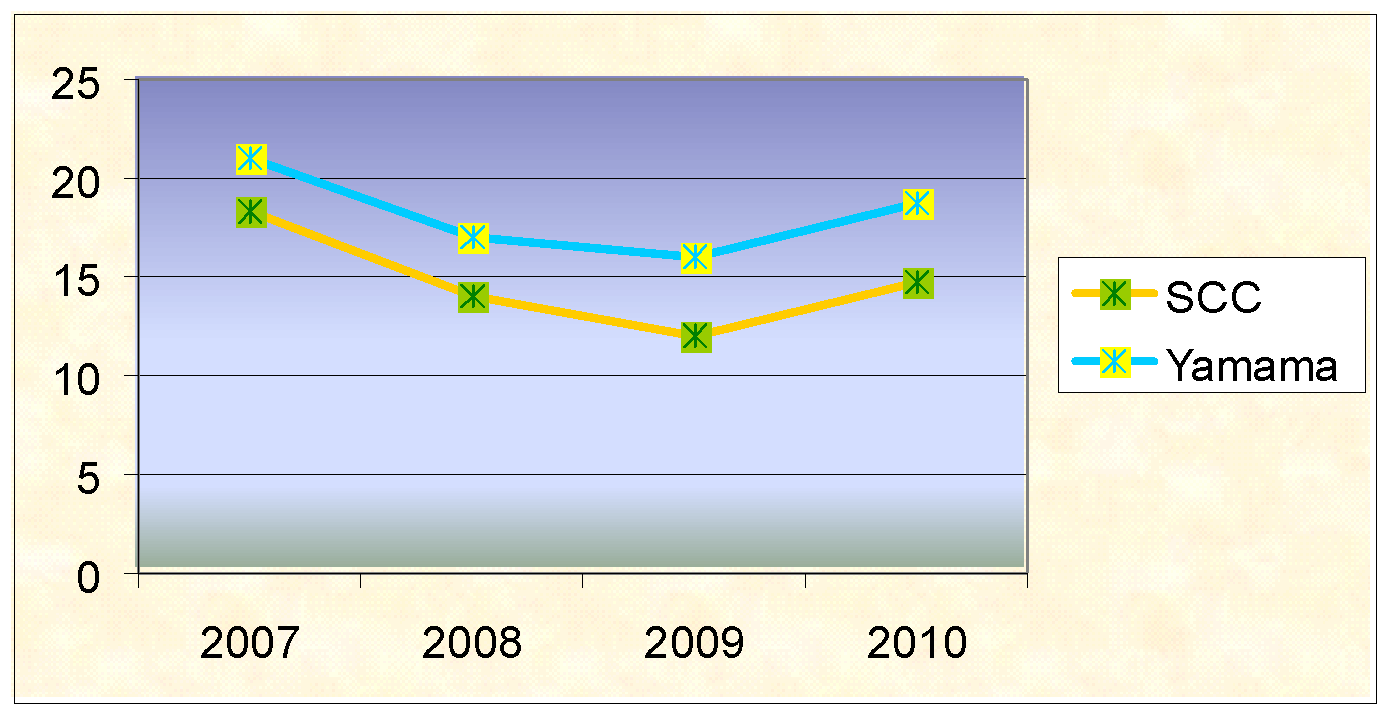
From 2007 to 2010, Return on total assets (ROA) of SCC was a little higher than Yamama Cement Company; whereas in case of SCC, the ROA was 18.28, 14, 12, and 14.65 from 2007 to 2010; in the same time the ROA of the Yamama cement company was 20.94, 17, 16, and 18.67.
Total assets turnover
Table 22: Total assets turnover of SCC
Table 23: Total assets turnover of YACCO
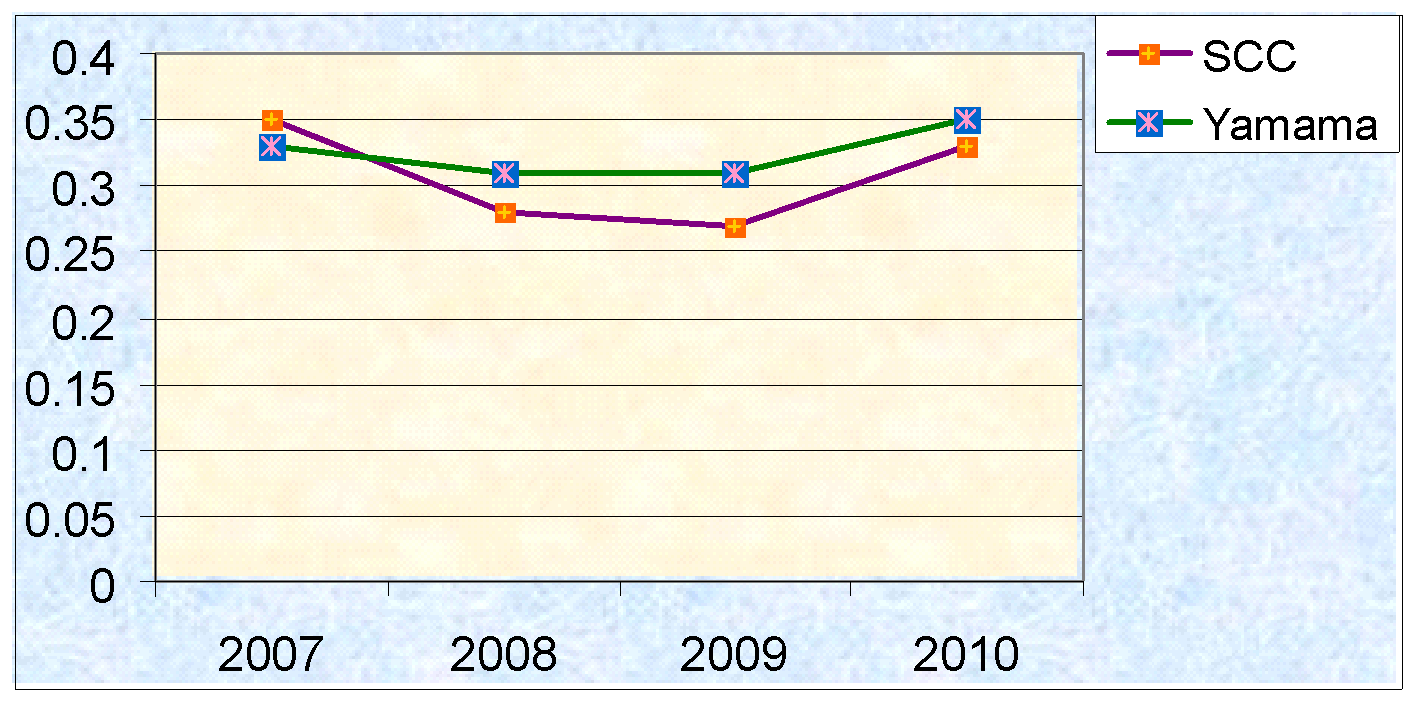
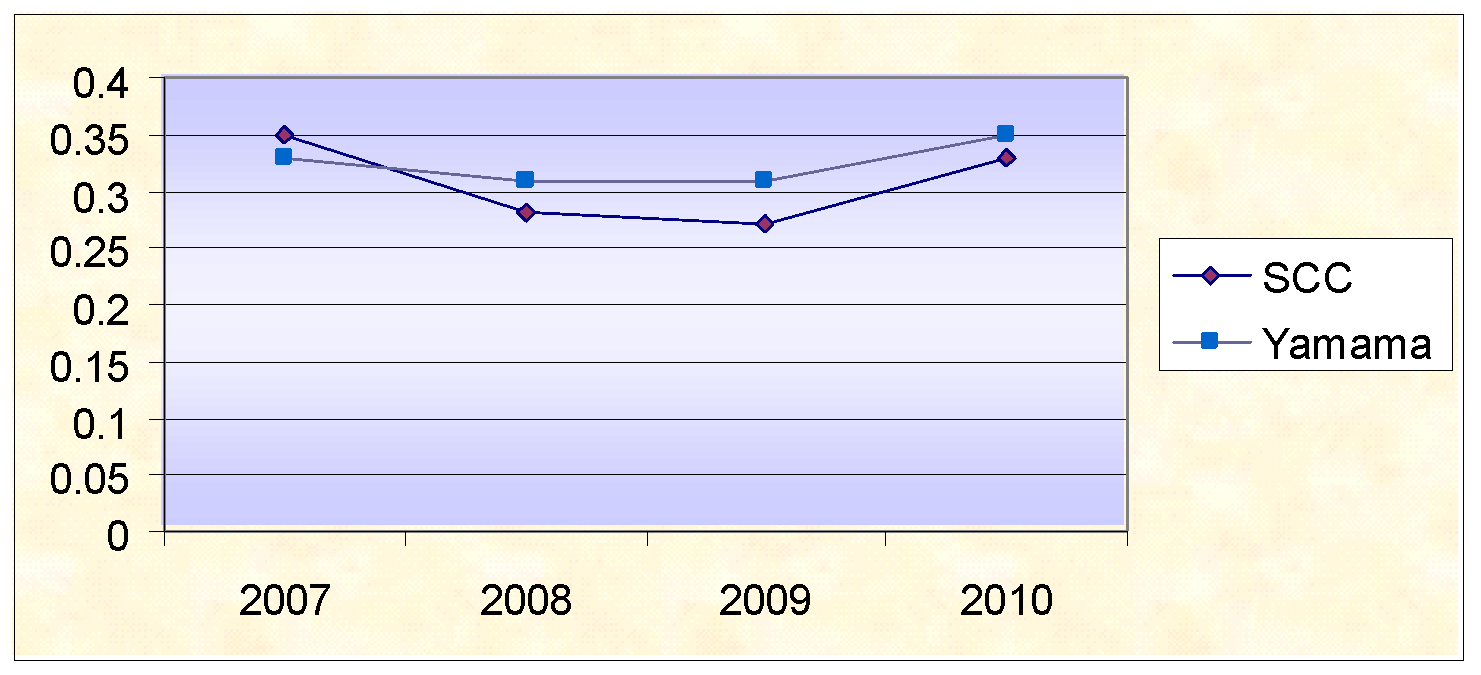
From 2007 to 2010, total assets turnover of SCC was a little lower than Yamama Cement Company; in case of SCC, the total assets turnover was 0.35, 0.28, 0.27, and 0.33, whereas in the same time the total assets turnover of the Yamama cement company was 0.33, 0.31, 0.31, and 0.35. Total assets turnover calculates a company’s competence and effectiveness at utilising its assets for creating sells and turnover – the greater the figure the better; this also points out the pricing strategy – as firms with little profitability have a tendency to possess elevated asset turnover, whilst those with more profitability have little asset turnover. From the figure above it is clearly visible that Yamama’s total assets turnover is, to some extents, higher than SCC’s – which indicates that with more profitability it has little asset turnover. On the hand, it is very important to argue that Saudi Cement Company, with little profitability, may have a tendency to possess greater asset turnover.
Return on capital employed
Table 24: Return on capital employed of YACCO
Table 25: Return on capital employed of SCC
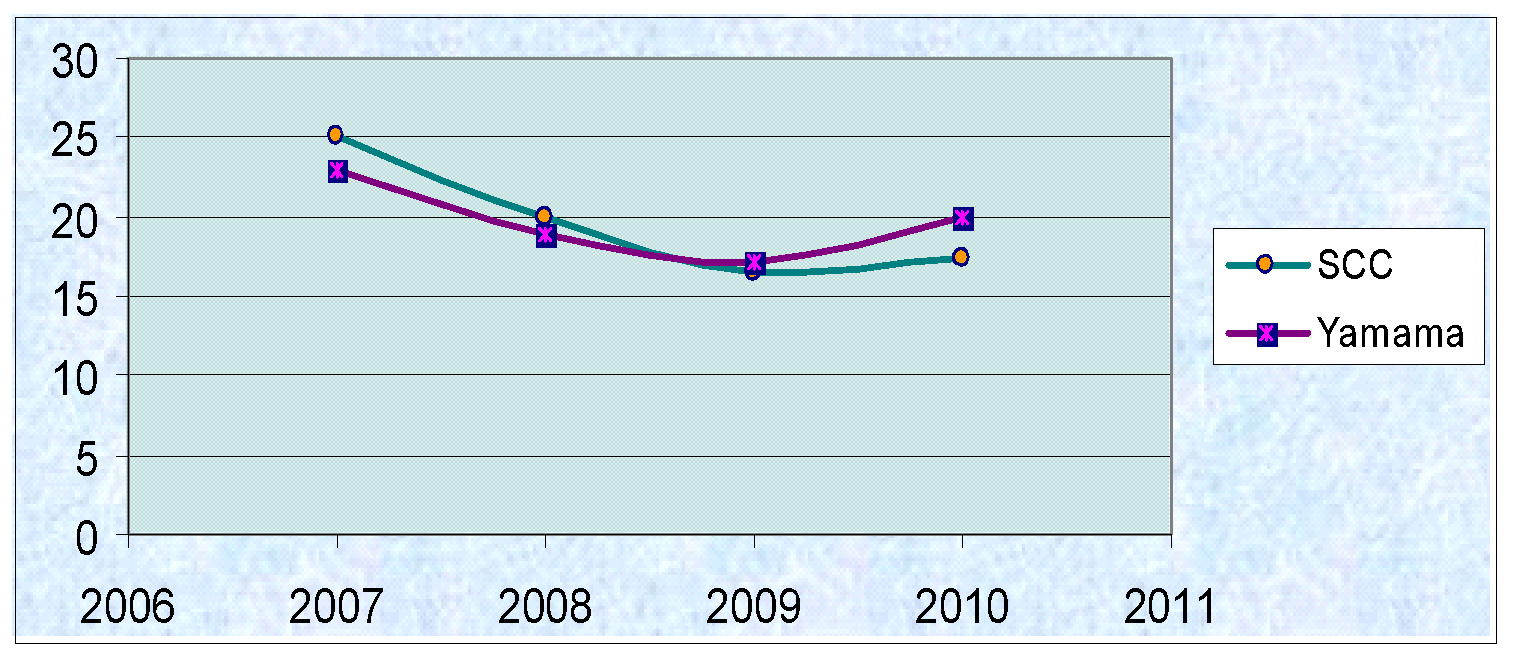
As demonstrated in the figure, from 2007 to the middle of 2008, Return on capital employed of SCC was a little higher than Yamama Cement Company. After 2008, Yamama has noticed to go up from the SCC business. In case of SCC, the return on capital employed was 24.98, 19.85, 16.45, and 17.43, whereas, in the same time the return on capital employed of the Yamama cement company was 23.03, 18.86, 17.17, and 20.01.
Long-Term Debt to Assets Ratio
Table 26: Long-Term Debt to Assets Ratio of YACCO
Table 27: Long-Term Debt to Assets Ratio of SCC
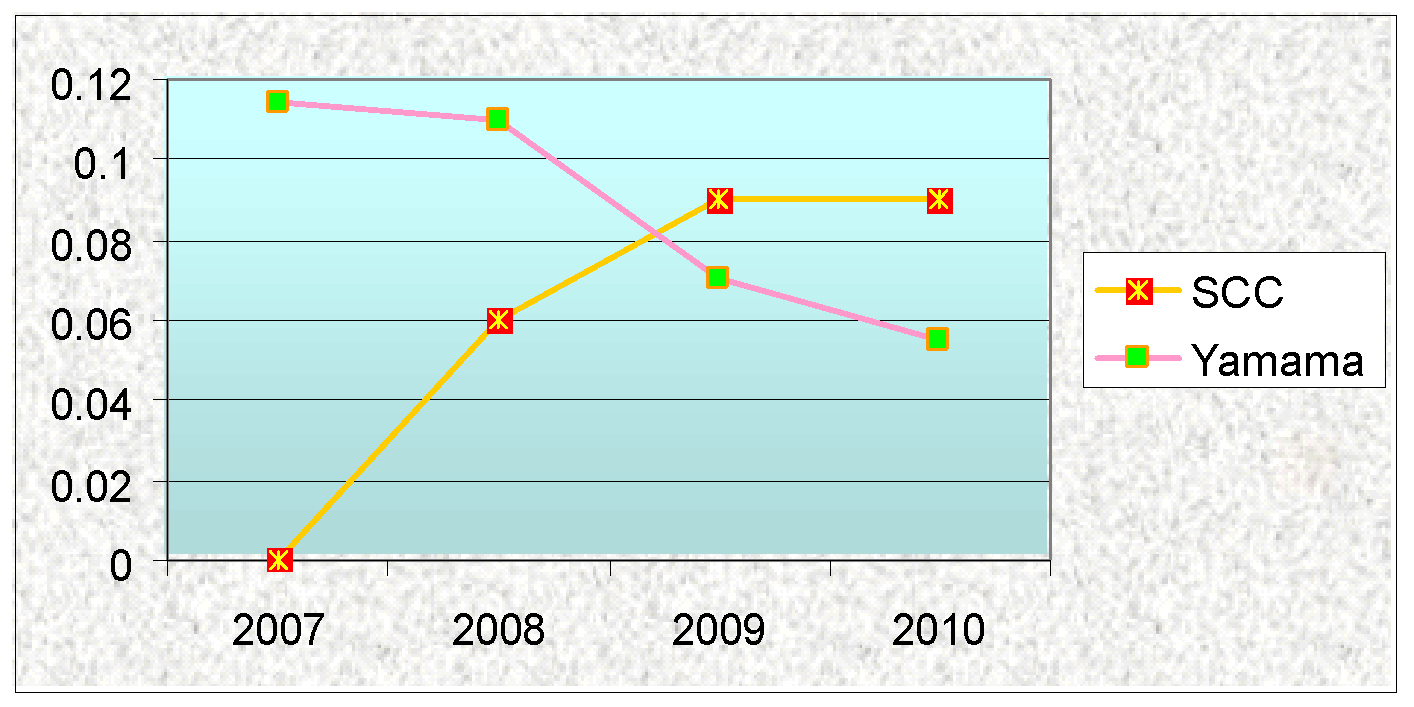
From 2007 to 2010, the long-term debt to assets ratio of SCC and Yamama fluctuated significantly; whilst this was 0, 0.06, 0.09, and 0.09 for SCC, for Yamama, this was 0.114, 0.11, 0.07, and 0.055.
Long-Term Debt Ratio
Table 28: Long-Term Debt Ratio of SCC
Table 29: Long-Term Debt Ratio of YACCO
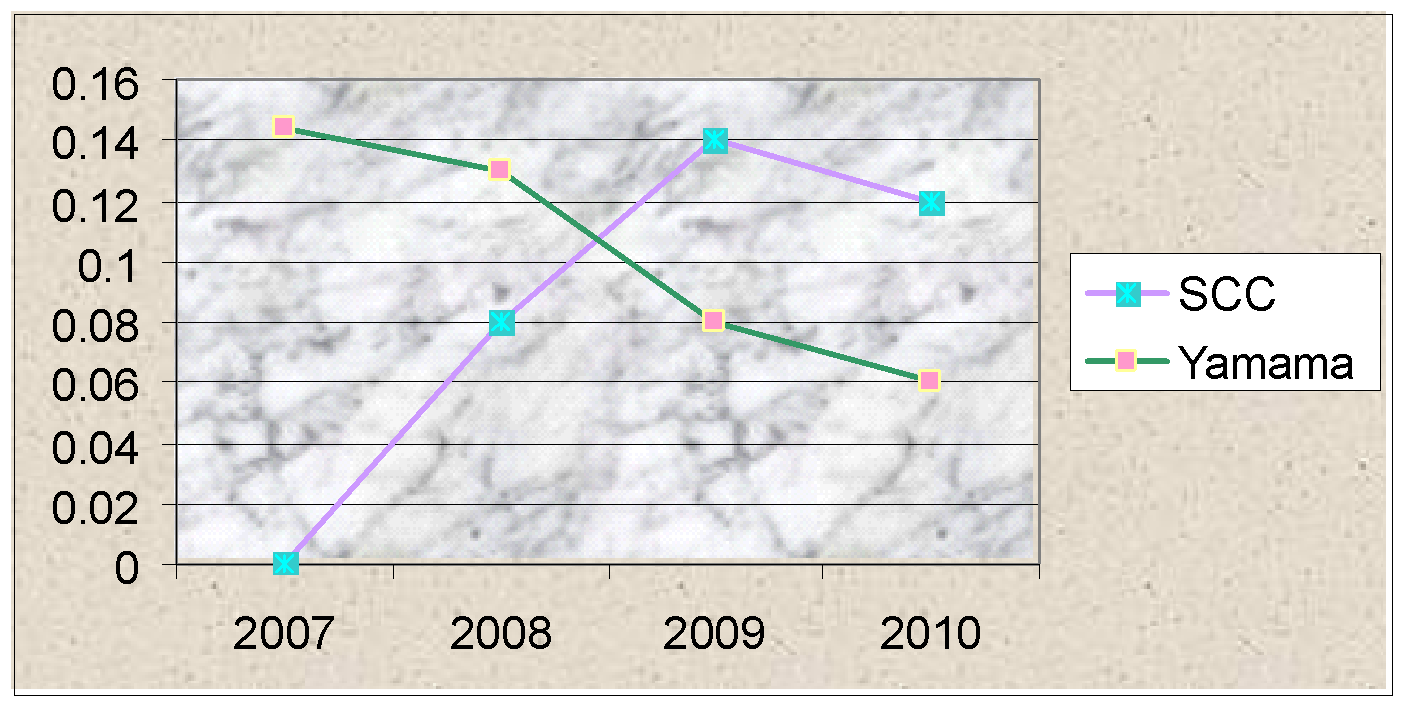
Long-term debt ratio of SCC from 2007 to 2010 was 0, 0.08, 0.14, and 0.12; conversely, for Yamama, this was 0.144, 0.13, 0.08, and 0.06. SCC saw an increase in the ratio, whereas Yamama suffered a decrease.
Valuation of the company
In defining financial performance comparison to explore the non-oil industry in Saudi Arabia during different phases of the global economy the paper has focused on two blockbusters of the Saudi cement industry SCC and YACCO. To draw the financial performance comparison, the following are the crucial approaches of company valuation and hence to decide which one has carried sound investment attributes.
Discounted cash flow (DCF) for 2007, 2008, 2009, 2010
The DCF is a mathematical form that involved assessing the investment analysis of a manufacturing company especially for calculating the present value or the NPV attached with regular cash flows. Alternatively, the DCF has carried the concept of the time value of money to assess the entire future cash flows of a company considering discounting factors/rates or the cost of capital in order to justify potential uncertainties of the company’s cash flows. Mathematically, DCF has expressed through the following equation. (Arumugam 8, 9, 57, 58, 127–36, 183–84, 236)
n
DPV = Σ FVt/(1+d)t
t=0
Or, DPV = FV1/(1+d)1 + FV2/(1+d)2 +…..+ FVt/(1+d)t
Where:
- FV = Adjusted Future Cash Flow
- PV = Present Value of Future Cash Flow
- d = Discount Rate or Interest Rate or Risk-Free Interest Rate
- n = Number of Years or Discounting Period
The DCF is also known as DPV (Discounted Present Value) where DPV is equaled to FV and since the paper is assigned to consider and calculate multiple discounting periods, DFC equation is expressed through as bellow which is an effective calculating tool of NPV and IRR. Considering previously mentioned DCF equation, here is the DCF calculation table of SCC and YACCO for 2007, 2008, 2009 and 2010.
Table 30: DCF Calculation of Yamama Cement Company (YACCO)
Table 31: DCF Calculation of Yamama Cement Company (YACCO)
Result of Comparison: In defining investment decision and financial performance measure of these two firms, YACCO is more favourable than SCC due to its high DCF value.
Concerning the DCF model and for more clarification, following is the calculation table of NPV and IRR for SCC and YACCO.
Table 32: NPV and IRR Calculation for SCC
Table 33: NPV and IRR Calculation for YACCO
Result of Comparison: Inconsistent with the hypothetical view, YACCO has carried greater NPV and IRR compare to SCC, therefore, YACCO is more favourable to invest.
Dividend Discount Model (DDM) for 2007, 2008, 2009, 2010
The DDM is a valuation model of an organization’s intrinsic value of stocks more specifically common stocks, expected future cash flow of present value, potential dividend value and selling price of the share. In another word, the DDM has been involved to carry out a valuation of an organization by determining the market value of stock dividends for the new equity holders who have significantly noticed and emphasized sound dividend payments during the sale of their stocks. For more clarification, the following is the most effective DDM equation by Gordon that considers organization’s dividend payment (Arumugam 58–60) and (Pandey 379–391).
n
Po = Σ Dt(1+g)t /(1+k)t
t=1
Or, Po = D1(1+g)/ (1+k) + D2(1+g)2/ (1+k)2 +…..+ Dt(1+g)t /(1+k)t
Where:
- Po = Value of Share When t=0
- Dt = Dividend Received at Time t
- k = Discount Rate or Cost of Capital
- g = Growth Rate of Dividend
In analysing Gordon’s view for the DDM model, hypothetically it’s the most effective valuation approach of common stocks of an organisation but in practice there have several limitations for instance, observed dividend amount are not chief attribute to make future dividend value of an organisation. Moreover, observed dividend values are absolutely inappropriate to draw payout policy and meanwhile, observed dividend values cannot play any lead role to determining stock price of that organisation and hence, assessment of payout ratios. Escape from these limitations chief advantage of the DDM model is that it has conveyed most proficient role to present future cash flows towards the valued stakeholders as well as adjusted cost of equity and cost of debt. (Arumugam 58–60) and (Pandey 379–391).
Inspiring from Gordon’s DDM model following is the calculation table for SCC and YACCO:
Table 34: DDM Calculation for SCC
Table 35: DDM Calculation for YACCO
Result of Comparison: In consistent with the DDM valuation, SCC is more stable to invest or in another word, SCC has performed more sound financial operation.
Dividend Yield Ratio for 2007, 2008, 2009, 2010
The dividend yield ratio is assign to draw relationship between two stock factors dividend payment per share and market price per share and hence, through this conduct shareholders of an organisation able to design actual sense of required earning distribution in terms of dividend. Here is the calculating method of dividend yield ratio (Pandey 167).
Dividend Yield Ratio = (Dividend Paid Per Share/Market Price Per Share)
Table 36: Dividend Yield Ratio for SCC
Table 37: Dividend Yield Ratio for YACCO
Result of Comparison: Since YSCC has carried rather superior dividend pay performance, therefore YSCC is more competent to invest than SCC.
Weighted average cost of capital for 2007, 2008, 2009, 2010 Summary of comparison (250 words)
In making investment decision, the WACC is an effective tool of calculating discount rate of an organisation that converted expected future cash flows (EFCF) into the PV (present value) and conveyed towards the entire investors. Mathematically, WACC has calculated in consistent with weighed cost of equity and debt financing as well as weighted cost of organisation’s own financing resources. Following is the simplest equation of WACC (Arumugam 43–48, 147–155, 260–263)
WACC = (Kd x Wd) + (Ke x We) + (Kp x Wp) + (Kr x Wr)
Where:
- Kd = Cost of Debt Capital
- Wd = Weight of Debt Capital
- Ke = Cost of Equity Capital
- We = Weight of Equity Capital
- Kp = Cost of Preferred Stock
- Wp = Weight of Preferred Stock
- Kr = Cost of Retained Earnings
- Wr = Weight of Retained Earnings
Table 38: WACC Calculation for SCC
*** Workings: Calculation of Costs of Capital for SCC
Table 39: WACC Calculation for YACCO
*** Workings: Calculation of Costs of Capital for YACCO
Result of Comparison: Since lower WACC is favourable for financial performance measures as well as investment decision making therefore, SCC is more secure to invest.
Dividend Per Share Ratio for 2007, 2008, 2009, 2010
Dividend per share or DPS ratio has primarily used to calculate dividend yield or payout ratios of an organization that entirely play a significant role during trade of stocks by determining both capital yield as well as existing profit distribution. Common approach of organisations that they mostly like to pay more dividend compare to prior business operation therefore, a healthy capital structure would crafted (Pietersz 1)
DPS Ratio = (Dividend Payment/Total Number of Shares Issued)
Table 40: DPS ratio for SCC
Table 41: DPS ratio for YACCO
Result of Comparison: As YACCO has carried rather superior dividend pay performance, hence YACCO is more competent to invest than SCC.
Earning Per Share Ratio for 2007, 2008, 2009, 2010
Earnings per share ratio/ EPS ratio is an approach to calculate return or yield on equity capital ratio and in addition., it’s a good assessment tool of calculating profitability of an organisation. Alternatively, EPS is a comparative kit to define firm’s earning power in a similar industrial area. Finally, EPS has made easier for the stockholders whether to buy an organisation’s share. Following is the calculation equation of EPS (Pandey 201)
Earnings Per Share (EPS) Ratio = (After Tax Net Profit − Preference Dividend)/Number of Outstanding Shares
Table 42: EPS Ratio Calculation for SCC
Table 43: EPS Ratio Calculation for SCC
Result of Comparison: In consistent with the hypothetical view on EPS, SCC is more favourable than YACCO since its greater EPS value.
Terminal Growth
Terminal value of an organisation has principally oriented through WACC and growth of the organisation as described following equation and key consideration of terminal value is defined that lower terminal value is threat to sound existence of an organisation. (Global Research 49–56 & 65–71, Global Investment House 1, 2, 19 and Global Investment House 1, 2)
Terminal Value = (1 + Growth Rate)/ (WACC–Growth Rate)
Table 44: Terminal Growth Calculation for SCC at End of 2010
Table 45: Terminal Growth Calculation for YACCO at End of 2010
Result of Comparison: As YACCO has carried greater terminal growth rate, investors should invest in YACCO rather SCC.
Risks
Considering the geographic location of Saudi Arabia, the cement industry has attributed through four risks factors and they are i) increasing competitors among rivals, ii) transformation of subscribers results in a decrease of entire revenue as well as market share, iii) erosion of available telecommunication packages due to competitive pricing strategy and iv) dissatisfied stockholders because of low return on aggregate investment. In the discussion of the financial performance of two telecom giants of Saudi Arabia, SCC and YACCO have currently suffered from competitive subscription pricing strategy as well as complex tariff structure and hence, existing subscribers are preferred Internet service providers or broadband services than wireless suppliers. Conversely, another risks factor of these cement companies is that they are in a severe crisis of international expansion strategy which has coherently affiliated with high current risks as well as loss of value investors and also the low value of the entire organization.
Comparison
Global Research (5) compared the annual sales in the local and international market of all cement companies and reported that the production of cement increased more than 8.60% in 2008 and the price of these products reached an all-time high but the government imposed exports ban on the cement companies, which reduced about 18.9% of net sales of the cement companies. However, this barrier influenced the business of both SCC and YACCO, for instance, SCC’s sales from export decreased by 0.12 mn tonnes or 10.43% and YACCO’s sales from export reduced by 0.04 mn tons. From 2007 to 2008, YACCO’s total sales decreased by 0.28 mn tons or 6.02% of its total sales whereas SCC’s net sales diminished only by 0.05 mn tons or 0.94% of its total sales. Here, it is important to mention that Saudi Cement Company has experienced huge success in the local market in 2008; as a result, a large fall in the export market of this company had a limited impact on the financial performance.
Table 46: – Cement Sales in Saudi Arabia
A rise in the current ratio demonstrates the enhancement of the liquidity position of the business; it is notable that the liquidity position of Yamama had a slow development over these three years. On the other hand, if there was a decline in the current ratio, it was quite natural that the liquidity position of the business has worsened with time and that it should improve in order to have a better position. In 2008, SCC had a fall in this ratio resulting in a worsened liquidity position; however, from 2009 onwards, SCC is trying to improve in order to a have better position.
The GPM of SCC and Yamama fell significantly from 2007 to 2010; such decreasing margin could indicate that variable costs have risen while selling price has remained constant; it could also mean that firms have cut prices to make an augmentation in sales; moreover, with a slow down in the rate of reduction, the firms are trying to improve the ratio.
Maybe because of the global financial crisis, the net profit margin ratio of Yamama fell from 2007 to 2009, but it has gradually increased from 2009 to 2010; however, SCC was not able to increase this ratio during the same period – as this company gained a stable rate in the ratio. Therefore, the decline in the net profit margin ratio throughout 2007 and 2008 might point out cost binges, which necessitate competence development – the SCC firm, having a low ratio, might need to take on debt to pay its expenses if it does not remain successful to raise the ratio in 2011 or in the next 5 financial years.
The asset test ratio of both SCC and Yamama reduced from 2007 to 2008 and from 2009 to 2010, it went ahead to achieve back its pose; these show that the two companies had a small liquidity ratio from 2007 to 2008 demonstrating that their liquidity position needed further amplification; however, the liquidity position of the companies have not augmented satisfactorily.
Yamama Cement’s liabilities to assets ratio is comparatively lower than that of SCC’s indicating that its assets are financed more by equity rather than debt; firms having elevated ratios are particularly at risk, principally in a rising interest-rate market; so the creditors are anxious if the firm has huge debts and may want it to pay some of it back.
Recommendations
- Joint Venture and Partnership: Saudi Cement Company has a strong presence Eastern zone in KSA and Yamama Cement Company has a significant market share in the central zone. Therefore, SCC and YACCO should try to enter another part of the national market and the management of these companies should follow a joint venture or partnership strategy to capture new market share in the national market. This strategy is also applicable to enter the foreign market as this strategy gives the opportunity to share other company’s assets and technological support;
- Implementation of Law: The government of KSA should flexible the legislation in order to expand the business in the global market and compete with the Chinese cement companies as they have already captured the major market share in cement industry. The entire paper demonstrates that both SCC and YACCO have the capacity to meet the existing local market demand and export products in a foreign market but the management of these companies failed to expand its business in the foreign market due to inflexible legislation of KSA though this country is the member of World Trade Organization. However, the government should concentrate that there is enough law to help the local companies but there should have proper implementation of the law with strong monitoring process as a significant part of the management and employees consist of foreigners;
- Export: According to the reports on two companies of Cement Industry, these companies only export the products in the GCC countries after withdrawing the export ban. However, the prospect of export depends on the economic position of the foreign countries, for instance, earnings from export had decreased in 2008 due to the adverse position of the UAE construction industry. In addition, SCC is the better position in the case of exports but the potentiality of Yamama was not explored yet in this regard; therefore, YACCO should concentrate more on exports. However, The cement manufacturing companies in Saudi Arabia are competing in an oligopoly market, which gives the opportunity to enhance their performance to attract more investors; as a result, these companies should try to enter other Asian countries to develop their position in the future;
- Rate of Debt: Saudi Cement Company’s rate of debt is comparatively high, therefore, the management of this company should restructure its capital more quickly to develop the integrate performance;
- Cost Control: Finally, the management of SCC and YACCO should control operating and manufacturing costs in order to avoid business risks in the future, and to overcome the companies from the adverse impact of the global financial crisis. In order to apply a cost-effective strategy, SCC and YACCO should reduce production costs by using alternative raw materials and reduce operating costs by restructuring remuneration policy in accordance with the corporate code. However, SCC should concentrate more on this factor as its current liability and total liability is greater than Yamama’s financial liability;
- Global Financial Crisis: Both SCC and YACCO have experienced the adverse impacts of the global financial crisis and the financial reports such as cash flow statement, balance sheet and income statement show that the net income reduced significantly because of decreasing sales revenue and increasing costs. In this context, these companies should review their strategies in order to find out loopholes in the operational system, and set up new strategies considering the market risks. However, these companies should prepare a new business plan in order to avoid business risks in the future;
- Brand Expansion: These companies should adopt horizontal brand expansion strategies in order to recover the position, for example, these companies can manufacture new products and other by-products by developing their technology.
Conclusion
This research paper has illustrated the financial performance of SCC and YACCO to measure the impact of the global financial crisis on the cement industry and to find out the contribution of this industry to the national economy. However, considering the financial performance, it can be said that Yamama Cement Company is more favorable to invest because the net profit margin, net present value, IRR, and liquidity position of this company is in a more stable position than SCC. On the other hand, a comparison of the dividend discount model of these two companies demonstrates that SCC has performed more sound at the time of the global financial crisis.
Works Cited
Al-Ghamdi, Salem. Saudi Cement Company: Survival Is The Name Of The Game In A Very Competitive Industry. 2010. Web.
Al-Rajhi Financial Service. Yamama Saudi Cement Co. 2008. Web.
Arumugam, Thavamani Thevy. An analysis of discounted cash flow (DCF) approach to business valuation in Sri Lanka. 2007. Web.
Bloomberg Businessweek. Yamamah Saudi Cement Co. Ltd (YACCO: Saudi Arabia). 2011. Web.
Bloomberg Businessweek. Yamamah Saudi Cement Co. Ltd (YACCO: Saudi Arabia). 2011. Web.
e-Standard Forum. Financial Standards Report Saudi Arabia. 2010. Web.
Global Investment House. Saudi Cement Company (SCC) update 2011. Web.
Global Investment House. Saudi Cement Sector. 2010. Web.
Global Investment House. Yamama Saudi Cement Company (YSCC). 2011. Web.
Global research. Saudi Arabia Cement Sector. 2007. Web.
Global Research SCC. Saudi Cement Company. 2009. Web.
Malik, Al Fahad. The Development of Commercial Laws in Saudi. 2008. Web.
Miah, Farouk. Saudi Cement Sector: Cornerstone of the Kingdom’s Development. 2010. Web.
Pandey, I M. Financial Management. New Delhi: Vikas Publishing House, 2010. Print.
Pietersz, Graeme. Dividend Per Share (DPS). 2011. Web.
SAMA. Forty- Sixth Annual Report of Saudi Arabian Monetary Agency. 2010. Web.
Tadawul. Balance Sheet of Saudi Cement Company (SCC). 2011. Web.
Tadawul. Balance Sheet of Yamamah Saudi Cement Co. Ltd. 2011. Web.
Tadawul. Cash Flow for the period ending of 3020 – Yamamah Saudi Cement Co. Ltd. 2011. Web.
Tadawul. Cash flow Statements for the period of 2008 – 2010 of Saudi Cement Company (SCC). 2011. Web.
Tadawul. Statements of Income for the period ending of 3020 – Yamamah Saudi Cement Co. Ltd. 2011. Web.
Tadawul. Statements of Income for the period ending of Saudi Cement Company (SCC). 2011. Web.
Tadawul. Volume and Last Trade Price of Yamama Cement. 2011. Web.
The World Bank. Report on the Observance of Standards and Codes (ROSC) Corporate Governance. 2009. Web.