Use the demand and supply model to show the likely short-term impact of the flood on the price and quantity of fruits and vegetables in Australia
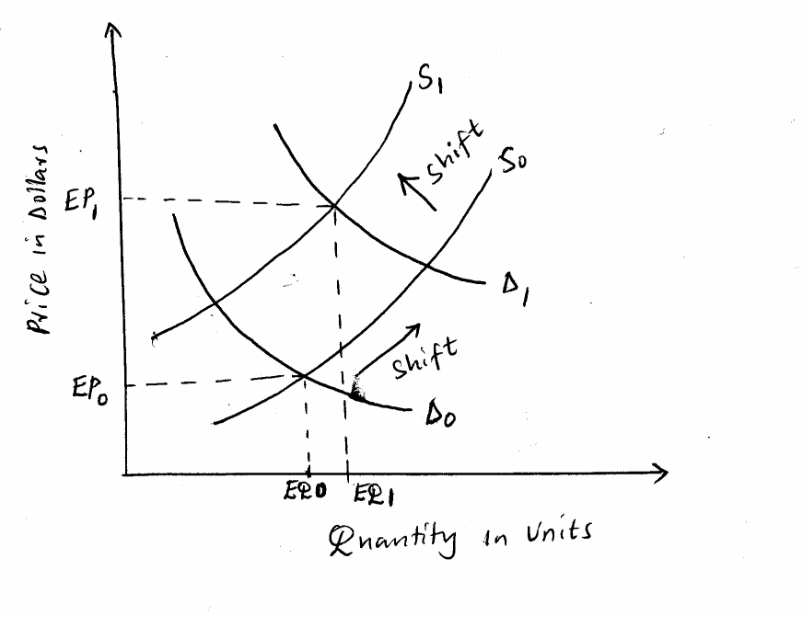
The changes in the price level are the only ones that cause a movement along the supply curve. Changes in other factors other than the price, lead to shifts in the demand curve (Slavin 2004). Floods can be classified under other factors that affect the demand and supply for products especially agricultural products. Floods in Australia will affect the production of fruits and vegetables and therefore have adverse effects on their market as shown in the graph below.

- D1- represents the new demand curve S1-New Supply curve;
- D0- represents the original demand curve S0- Original Supply curve;
- EQ- Original Equilibrium Quantity EP1 – New Equilibrium price;
- EQ1- New Equilibrium Quantity EP0- Original Equilibrium price;
- EP1 – New Equilibrium price EP0- Original Equilibrium price.
From the graph, assuming that the equilibrium price in the fruits and vegetable market was EQ0, the floods destroy the products in the fields and this causes a shift of the supply curve to the left due to reduced supply of the products in the market. The demand will continue increasing and therefore cause a shift to the right. The lower supply level may not meet the demand in the market; hence the suppliers have to increase the prices due to increased demand (Jerry & Whinston 1995). This leads to a new equilibrium price level in the market of EP1. This price is higher than the previous price that existed in the market.
If a technological breakthrough ensures imported pumpkins are as good as domestic qualities and are thus allowed to be imported into Australia, use the demand and supply model to explain the short-term impact on the pumpkin market
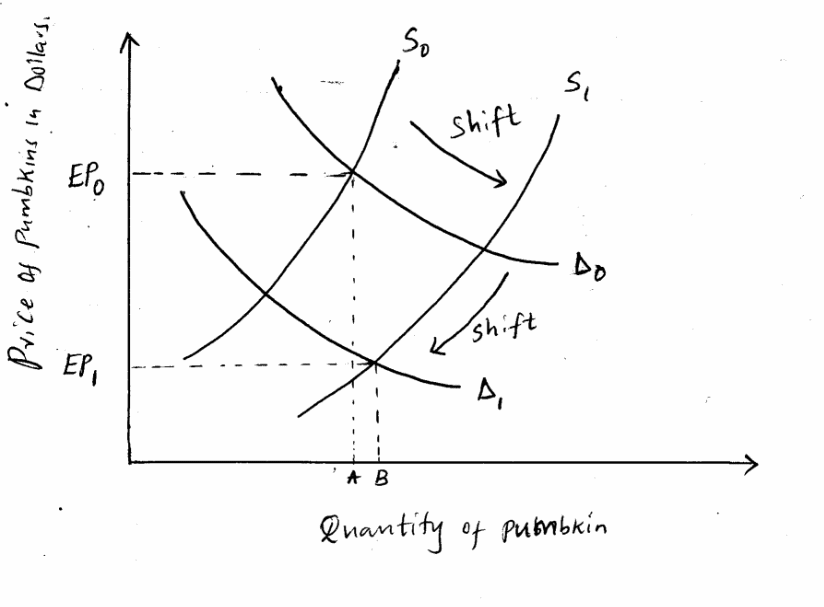
A technological breakthrough in the market is among other factors that affect the demand and supply for products and services. If this makes the importation of pumpkins to be allowed in Australia, the equilibrium price of the local market of the pumpkins will be affected. Some consumers may shift to the use of imported pumpkins and therefore substitute them for the local pumpkins as shown in the graph below:

- D1- represents the new demand curve S1-New Supply curve.
- D0- represents the original demand curve S0- Original Supply curve.
- A- Original Equilibrium Quantity EP1 – New Equilibrium price.
- B- New Equilibrium Quantity EP0- Original Equilibrium price.
- EP1 – New Equilibrium price EP0- Original Equilibrium price.
It can be seen clearly that the quantity supplied shifts to the right, from S0 to S1. This implies that the supply increases and therefore consumers will decrease their demand in the local market as shown by a backward shift of demand from B to A. The demand in the local market decreases only when consumers know that the quality of the pumpkins imported is of the same quality. Technological developments can make it possible to produce similar goods in the market.
This affects the equilibrium price level by decreasing it from P0 (High) to P1 (low) as shown in the graph above. The equilibrium price is the price at which both the demand and supply curve intersect. The suppliers in the local market have to reduce their prices from the original price that they had been charging, to a lower price so that to avoid losing customers to the competitors. The suppliers in the local market may incur huge expenses in trying to promote their products and use differentiation strategies.
However, if consumers are uncertain regarding the quality of imported pumpkins, use the demand and supply analysis to explain the impact on the pumpkin soup market in the restaurant industry.
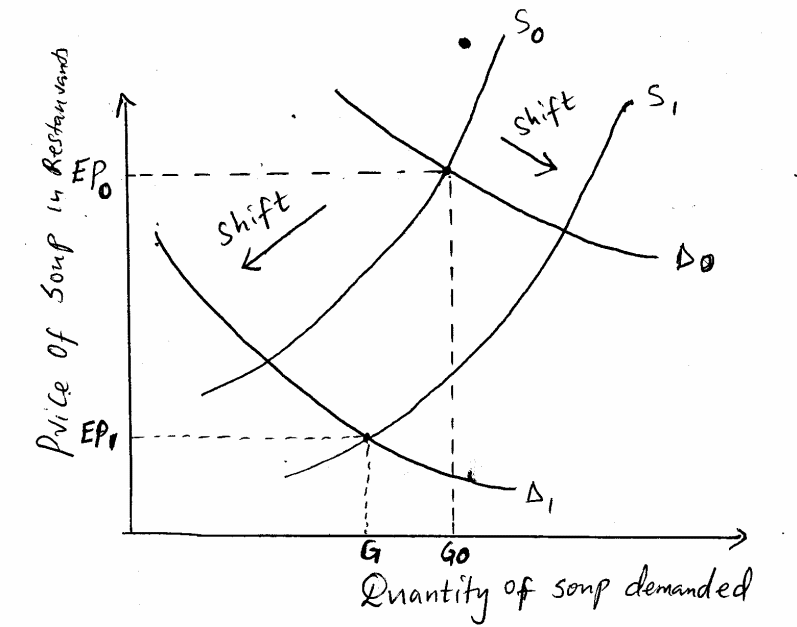
In the restaurant industry where the pumpkin soup is made, the effect of importing the pumpkins in Australia largely depends on the certainty of consumers on the quality of imported pumpkin. Most of the consumers may not continue eating in the restaurants as they are not sure of the quality. Therefore, in the short term, the demand for pumpkins soup in the restaurants is likely to fall as shown in the graph below:

- G- New Equilibrium Quantity.
- G0 – Original Equilibrium Quantity.
The demand for the soup will shift to the left due to the decrease in demand level as shown from D0 to D1. Therefore, there will be a high supply that is more than what is demanded (Haydir & Sloman 2010). The excess supply is (G0-G) i.e. the difference between the two equilibrium quantity levels in the market. Eventually, the suppliers or restaurants will have to decrease the prices until they stabilize at a new equilibrium price of EP 1, which is lower than the previous price (P0). This will continue until the customers or consumers are certain that the pumpkins produced both locally and the imported one have are of the same quality.
Referring to the determinants of price elasticity of demand as they apply to pineapples analyze the likely impact on the market if the government imposes a retail price ceiling of $40 a box on pineapples. Specify any assumptions you have made
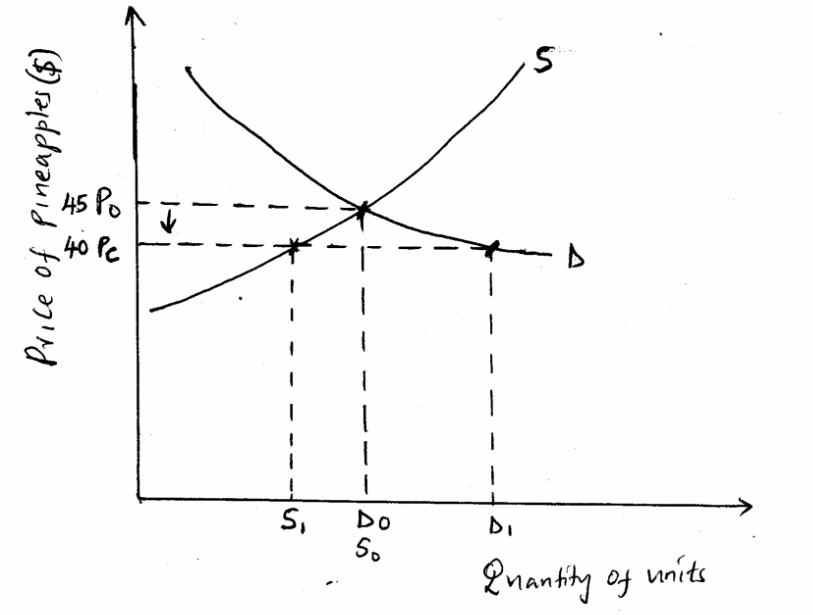
A price ceiling is a maximum price imposed by the government requiring that the producers or suppliers should not charge beyond that price (Gans & Mankiw 2010). Assuming that the price of a box of pineapples was previously trading at $45, and the government imposes a retail price ceiling of $40, the impact in the pineapples market will be as follows:

- Pc – Price ceiling
- P0- Original Price
- S-Supply curve
- D- Demand curve
- S1- new supply quantity
- S0- Original supply quantity
- D0-Original quantity demanded
- D1- New quantity demanded.
The change in price due to government intervention will have a direct effect on the number of pineapples demanded or supplied in the market. It has been shown from the graph above that due to the reduction in the price level, the quantity demanded increases from D0 to D1. So there will be a movement along the demand curve from left to right. However, the suppliers will reduce the supply of pineapples and instead increase the supply for other fruits where there is no price ceiling imposed. The suppliers also want to get more revenue and hence the supply will reduce from S0 to S1. It can be seen clearly from the graph that the quantity supplied moves along the curve from right to left due to the decrease in supply level (Varian 2006).
Suppliers will only be willing to supply at the ceiling price so that they can at least get good returns from the sale of pineapples.
References
Gans, J & Mankiw, G 2010, Principles of microeconomics, Pearson Education Australia, Sydney.
Haydir, A & Sloman, J 2010, Principles of economic student study guide, Pearson Education Australia, Sydney.
Jerry, R & Whinston, M 1995, Microeconomic theory, Oxford University Press, USA.
Slavin, S 2004, Economics: a self teaching guide, Wiley, USA.
Varian, H 2006, Microeconomic analysis, Norton and Company USA, New York.