The quantitative elements selected include revenue generated per year by Apple Inc. and the total number of stores the company has in total. Apple Inc. is planning to unveil new products in the market, such as the fifth generation iPad, which uses 5G and M1 cheap, and the third generation iPhone SE, which uses an A15 chip with a 5G network. The company’s expansion requires insight into future demand to ensure that the company prepares well for the upcoming changes which may affect the supply chain, products, and the company finance.
Subjective Data and Actual Demand Outcome
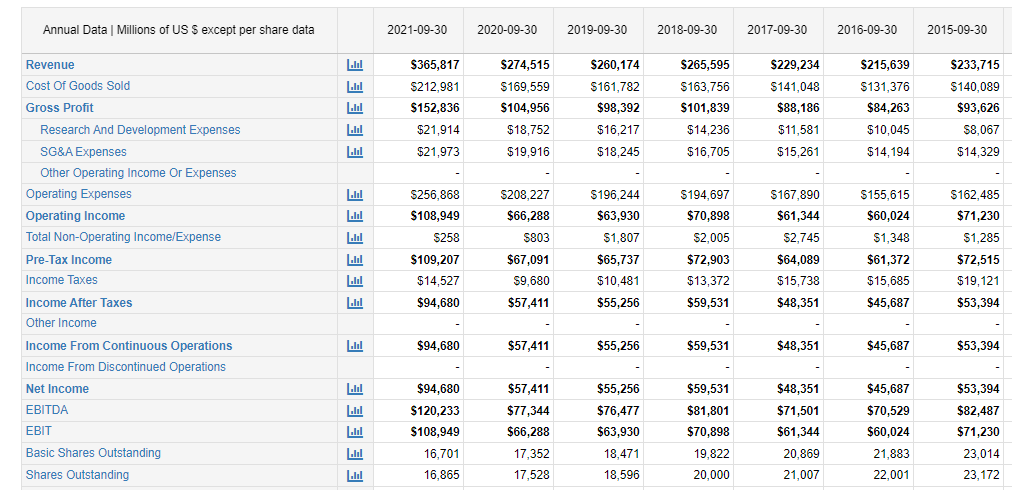
Subjective data is based on other people’s opinions, feelings or attitudes on a particular topic. This data is essential for Apple Inc. as it will enable the company to identify areas that require improvement. Apple Inc.’s market share is smaller than its main competitor, Samsung (Dea, 2022). In 2021 the company had a total of 511 stores worldwide with a revenue generation of $365,817 million, implying that the increase in the number of stores has a positive impact on Apple Inc.’s revenue growth. Figure 1.0 below Apple Inc.’s revenue generation in the last seven years.

Forecasting Method
The operation plan uses regression analysis as the preferred forecasting method. The regression model predicts Apple Inc.’s revenue based on parameter analysis. This method only applies to quantitative data where dependent (Yi) and independent variables (Xi) are present. This method shows the relationship between two variables i.e. dependent and independent. The regression model used in this analysis is Yi = β0 + βxi + ei. In this analysis, the Yi is the revenue forecasted by the independent variable xi that represents the number of stores.
Trends and Seasonality
The trend in the Apple Inc. data shows an increasing revenue as the number of stores also increases. For the last five years, Apple Inc. has been experiencing an upward trend in its revenue. For example, in 2017, the company’s revenue was $233,715.00, and in 2021 it was $365,817.00. The seasonality is portrayed by the smooth jump in Apple revenue. This implies that increasing the number of Apple stores has a positive impact on the sales of Apple Inc. products.
Future Demand Forecasting
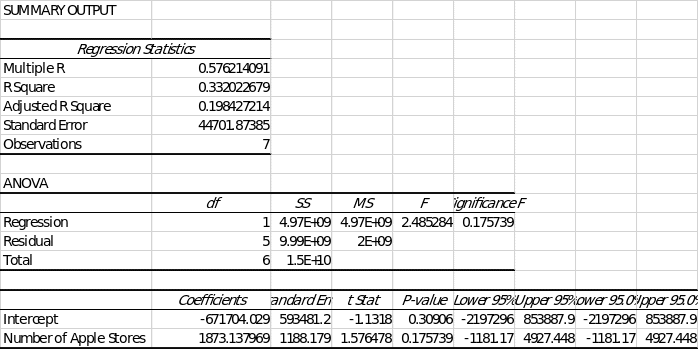
The data below shows the actual data of Apple Inc. from 2015 to 2021 and the regression analysis for the predicted demand forecast.
Table 1.0: Apple Inc. stores and revenue


Decisions
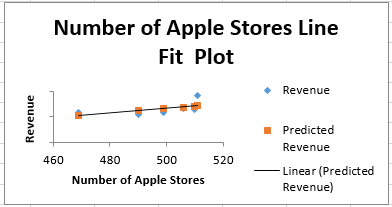
Based on the regression analysis results, Apple Inc. needs to open new retail stores to increase its revenue. The forecast in figure 2.0 above shows that the company’s revenue will increase with an increased number of retail stores. This will enable the company to compete effectively with its competitors, such as Samsung. Adding more retail stores promotes Apple Inc.’s supply chain, enabling them to serve offline clients.
References
Apple Income Statement 2009-2022 | AAPL. (2022). Macrotrends. Web.
Dea, S. (2022). global-market-share-of-apple-iphone. Statista. Web.