Lab 6/7
Exercise 1
Using pyMi to read certain image shapes and obtain the Fourier transformations
Variety of sine waves can be combined to form all kinds of shapes and images. Fourier transformation is instrumental in breaking down of the image into various sine waves that combines to form it. Moreover, it can plot frequencies which merge to make up that shape or image. For instance, when a circular image is cut into two similar halves and then flipped in order to appear like a square wave, several sine waves can then be utilized to reform it. In this case, majority of that image (square) can be demonstrated by use of a single low frequency sine wave. On the other hand, high frequency sine waves can be used to fill extra spaces. The figures below illustrate this:
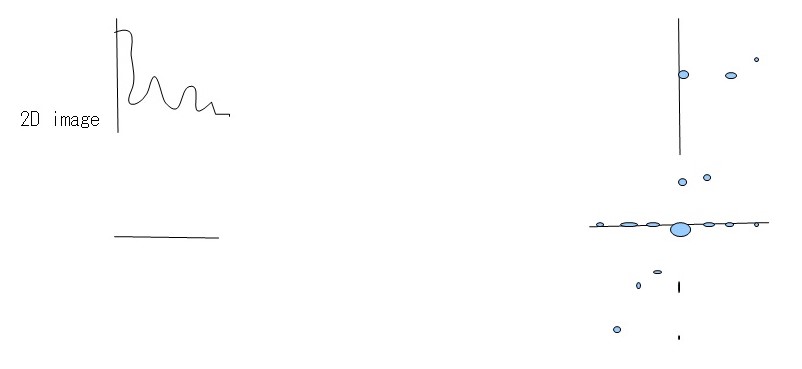
low freq high freq which can be plotted as
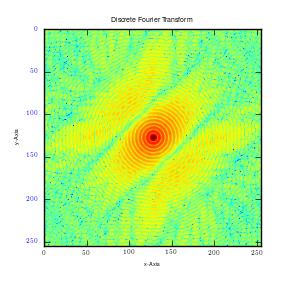
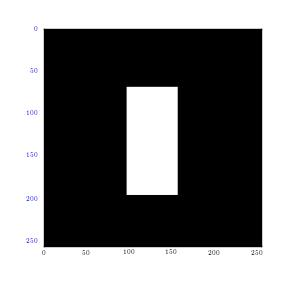
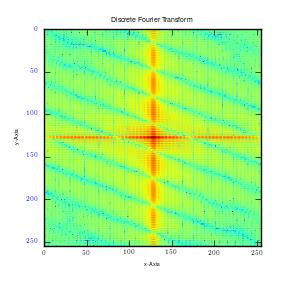
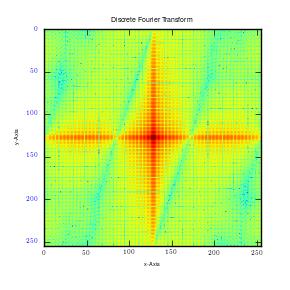
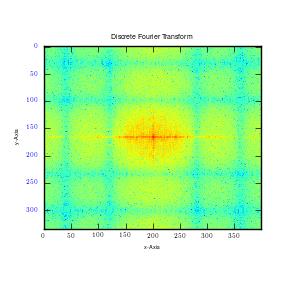
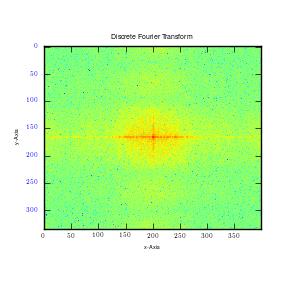
From the results, it can be observed that there is high intensity of lower frequencies since the shapes were made from low frequency waves which are large. The small points observed shows extra frequencies (high frequencies) utilized to fill that square. This is clearly shown in the second graph above (2D graph), where large points represent large sine waves with lower frequencies. Moreover, the first graph above is in one dimension (x-axis). In case the image is cut in all planes, for instance x, y axis, at 450, it would give numerous points, which are plotted in all the planes. This will happen irrespective of the point of cut since a circle is symmetrical. It gives a frequency graphs that seems to rotate about an axis. Therefore in case numerous points are cut (thousands), the resultant image would appear like rings as shown in the first figure (circle image-Fourier transformation). It can also be observed that a cut in x axis for a rectangular image produces higher frequency than that made on y axis of the same image. This is as illustrated below:

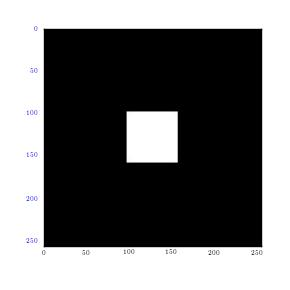
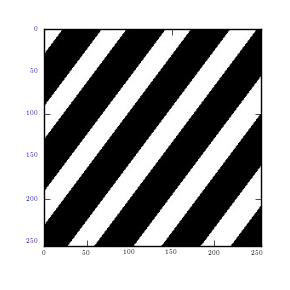
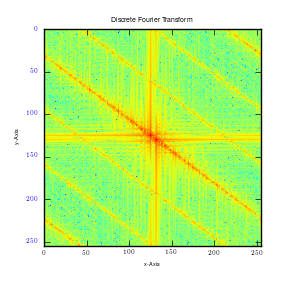
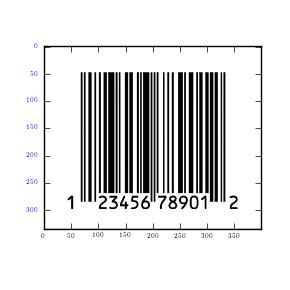
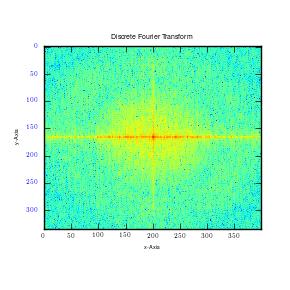
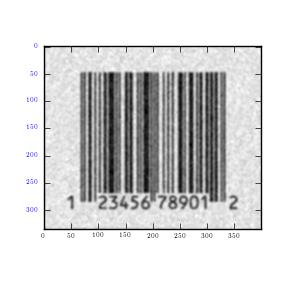
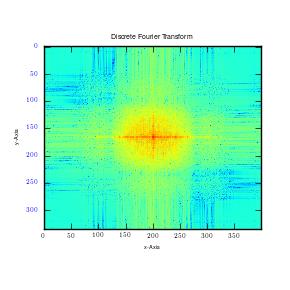
This results in clustering of low frequencies towards the centre in y axis and dispersal of high frequencies on the x axis. It is also quite important to note that when this is done on a square image, it produces similar plots on both axes. Moreover, when stripes are used, edges that run parallel will not be detected. Instead, Fourier transformations only detect frequencies of edges that are perpendicular to the image. This is mainly because Fourier transformations give lines which run in opposite directions. In addition, majority of information is usually in low frequency. This is because it is at the centre.
Exercise 2
Irregular images
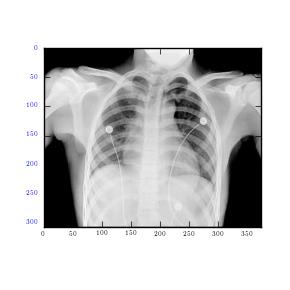
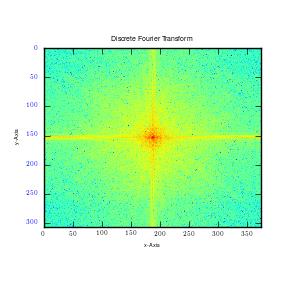
The images are predominated by Low frequencies. In fact, transformation of a rectangular image is similar to that of a train image. Moreover, high frequency sine waves are found near the edges. This is mainly because the sine waves are usually utilized at the edges of the train to fill it along its sharp ends. The Fourier transformation that results from a rectangular image is similar to that of the x-ray image. As can be observed, very few high frequency sine waves appear. Low frequency sine waves dominate the image. This is mainly because of its smooth edges which are undefined.
Exercise 3
Adding noise to images and observing the Fourier transformations.
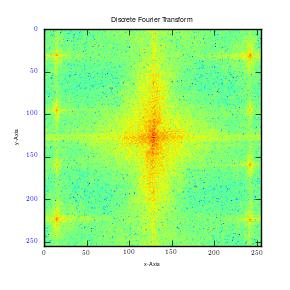
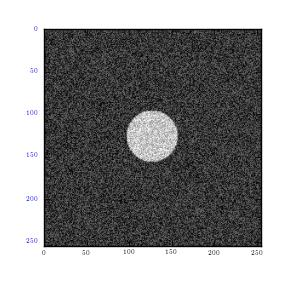
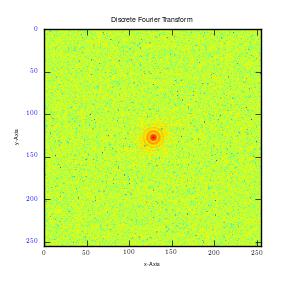
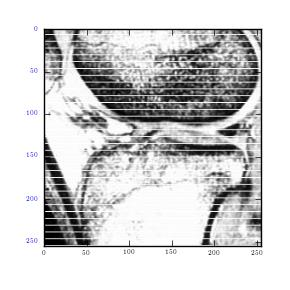
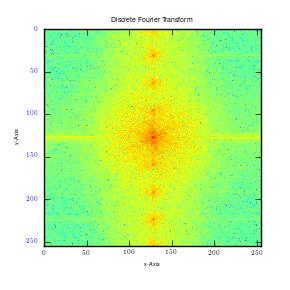
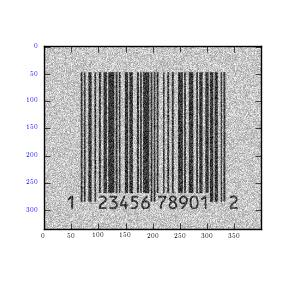
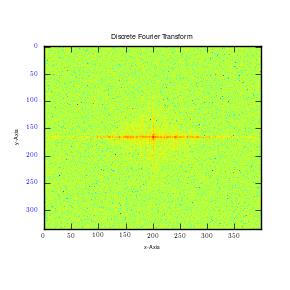
It can be observed that noise is random in the circle image. This includes both the high and low frequencies. The random noise, which is of high magnitude, is well spread over the transformation. This is because it draws a large part of frequency plot from Fourier transformation. On the other hand, MRI image utilizes coherent noise which is the explanation behind clustering of plots at the centre. It is also important to note that horizontal noise lines can be seen as darkened dots in y axis. Therefore they do not constitute interference to the image.
Exercise 4
Using the Gaussian and Butterfield filter to remove coherent noise for the MRI image used in the previous exercise.
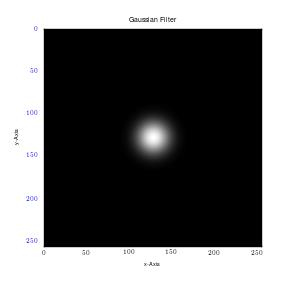
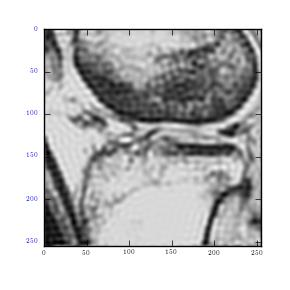
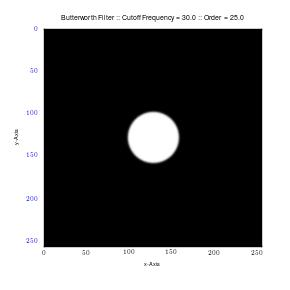
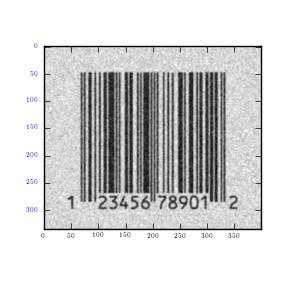
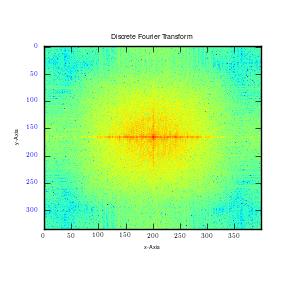
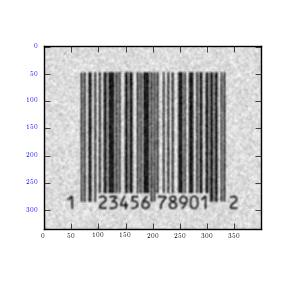
The Gaussian filters decreased noise by lowering its standard deviation. Nonetheless, it had a negative effect on the image as it became blurred. In order to increase sharpness, one has to increase standard deviation; however, this only works to increase noise. Therefore, in order to preserve image quality as well as reduce noise, use of Butterworth filter is encouraged given the results it gave above.
Exercise 5
Using spatial domain filters to achieve the best noise reduction image.
By utilizing Box car filter and then followed by Convolution filter, the result was much better than that of Butterworth. In this case, random noise shows low frequency spread as well as random high over the whole image. When the resulting image is compared to the original, it is clear that noise has been removed by the 3 filters. Moreover, Box car and Convolution filters worked better than Butterworth filter in removing noise as well as preserving image quality. It is also quite notable that high frequencies were removed even though this is not the same as removing low frequencies since the latter may cause image degradation. Consequently, the last image gave a booming scan although this can be improved further by histogram equalisation.

