Introduction
The importance of statistics in clinical research can be explained by a multitude of factors; in clinical management, it is used for monitoring the patients’ conditions, the quality of health care provided, and other indicators.
The correlations between length of hospital stay and costs have been of interest to researchers back in the early 2000s and continue to preoccupy them currently. One such research established the median costs of hospitalization for adult patient with viral pneumonia as $5,942, with similar hospitalization and care pattern used by different hospitals (Fine et al., 2000). If the patients were discharged a day earlier, they could have saved an average amount of $680.
Another research was more focused on the methodology and data analysis than on the actual outcomes; at any rate, the researchers came to acknowledge that hospitalization costs constitute a significant part of all patients’ expenses on their health care (Polverejan, Gardiner, Bradley, Holmes-Rovner, & Rovner, 2003). A more recent research established the positive association between shorter length of stay and early readmission, with subsequent cost increase: the patients – or their payers – had to fund the initial hospitalization and the readmission. At that, the cost of hospitalization and readmission taken together was 65% higher than that of longer hospital stay in days (Carey, 2015).
Despite the constant development of the field of medical sciences for the sake of common good, hospital readmissions are a persistent issue in contemporary medical care. Of course, the overwhelming majority of the patients do not want to return to the hospitals, and, to boost the medical institutions’ measure-taking activities, Medicare practices the system of penalties for the unplanned readmissions.
But even though medical institutions are struggling to prevent their patients from unplanned readmissions, the statistical data for patients experiencing readmissions is rather humbling. The problem of our current interest, that is analyzing the hospitalization costs, is not any less pressing than the prevention of readmission in geriatric patients. In 2015, of the total 25,593 geriatric beneficiaries using the services of FFS Medicare, a mean 4.1% experienced at least one readmission within 30 days after the discharge (Gorina, Pratt, Kramarow, & Elgaddal, 2015).
As one can see, the subject of hospital stay costs is critical in clinical research and management. The relevance of the subject is the main reason such research is needed; the findings may serve as a baseline for further investigation to create a more effective management system to reduce hospitalization costs and provide higher quality health care.
Variables
The variables for this analysis include length of stay in days, number of days in the intensive care unit, patient’s age, sex (male or female), and total charges during hospital stay. They can be described as follows:
Table 1 – Variable list.
It is known that categorical variables can only have values that are subject to categories (Levine, Stephan, & Szabat, 2014). These can be measured using nominal and ordinal scales. For example, the “sex” scale can only use two categories with no ranking. Continuous variables such as age, total charges during the stay, and total charges for drugs, lab analyses, imaging, and respiratory therapy should be measured using ratio scales where the difference in numerical value of the variables includes a zero point (Statistical Language – What Are Variables? 2013). Discrete variables such as length of stay in days and length of stay in intensive care unit should be measured with interval scales: the diversity has a meaning but not in correspondence with a zero point (Osborn, 2008).
Questions
The overall goal of statistically analyzing such data can be to create a model predicting the average sum a geriatric patient can be charged upon their discharge. Additionally, one can hypothesize that there is some correlation between the length of stay and the patient’s age. To achieve this goal and test the hypothesis, several questions should be answered, namely:
- What is the average age of the patients?
- What is the average cost of stay per patient?
- Is there any correlation between the age and the cost of stay? Does the patient’s age affect the length or cost of stay?
To answer these questions, descriptive statistical method and ratio scales appear the most appropriate. Descriptive method is used to define the data and assess its representativeness. To determine the value between the sexes, ratio will be used. When one uses ratio, the x and y variables (male and female) are independent. The variables also have to be tested as to the correlation between them.
Results
The summary of data concerning the mean age of the patients can be presented descriptively as in Table 2:
Table 2 – Descriptive Summary: Age.
The mean age of the patients, therefore, is X = 75, SD = 12.1 years. To estimate the value between sexes, one has to keep in mind that sex is a dichotomous variable, which is why a formula for ratio is to be used as follows:
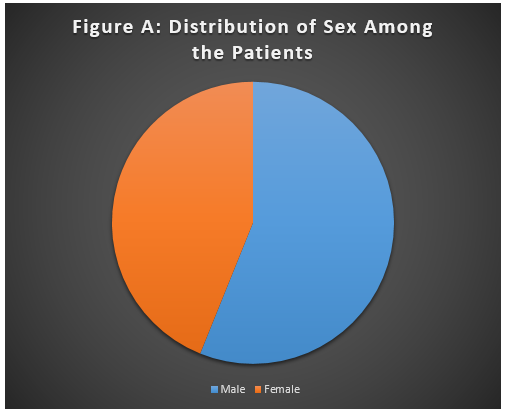
where x (female) = 61, y (male) = 78, with the total number of participants n = 139, as demonstrated in Figure A:

The fraction was reduced for y to equal 1, which produced the rate of 1.28 males to every female in the hospital. To calculate the proportion of males to females, a formula can be used as follows:
If the fraction is reduced for either x or y to equal 1, the result is.56 males.
The total charges can be put in a descriptive summary:
Table 3 – Total Charges.
With the total cost during the stay $887,192.85, the average for each person is calculated in a simple formula:
Figure B depicts the length of stay with the average length of stay equaling 4 days.

No correlation between the variables was found.
Conclusion
To summarize the findings, one can state that the mean age of the patients in Freedom hospital is X = 75, SD = 12.1. Additionally, the average hospitalization cost per patient is $6428.93. The failure of the research to establish the correlation between the variables can indicate the lack of data and the necessity to conduct additional research with more data used.
References
Carey, K. (2015). Measuring the Hospital Length of Stay/Readmission Cost Trade-Off Under a Bundled Payment Mechanism. Health Economics, 27(7), 790-802.
Fine, M. J., Pratt, H. M., Obrosky, D. S., Lave, J. R., McIntosh, L. J., Singer, D. E., Coley, C. M., & Kapoor, W. N. (2000). Relation between length of hospital stay and costs of care for patients with community-acquired pneumonia. The American Journal of Medicine, 109(5), 378-85.
Gorina, Y., Pratt, L. A., Kramarow, E. A., & Elgaddal, N. (2015). Hospitalization, Readmission, and Death Experience of Noninstitutionalized Medicare Fee-for-service Beneficiaries Aged 65 and Over. National Health Statistics Reports, 84, 1-24. Web.
Levine, D. M., Stephan, D., & Szabat, K. A. (2014). Statistics for managers using Microsoft Excel (7th ed.). Boston: Pearson.
Osborn, C. E. (2008). Essentials of Statistics in Health Information Technology. New York, NY: Jones & Bartlett Learning.
Polverejan, E., Gardiner, J. C., Bradley, C. J., Holmes-Rovner, M., & Rovner, D. (2003). Estimating mean hospital cost as a function of length of stay and patient characteristics. Health Economics, 12(11), 937-947.
Statistical Language – What Are Variables? (2013). Web.