Introduction
The mind and the body always get exhausted after day’s activities, be it a work or a learning activity. It is for this reason that people across different areas, professions, academic backgrounds, age, as well as gender get to engage in social pastime activities in one way or another. Some people may choose active leisure activities such as athletics or playing ball games while others tend to enjoy passive social activities such as playing video games.
It must be emphasized that social activities can be viewed in terms of the habits of the person’s mind, a practical approach to life that encourages individual explorative initiatives, as per Costa and Kallick. This promotes elements of self-regulation in learning and problem solving at work place in the knowledge-based global economy, as Costa and Kallick further state. Indeed, the significance of habits of the mind vis-à-vis the trends in the gaming industry is envisaged in the approaches lies in their applicability to the continuous pursuit of new skills, innovation along with lifelong-learning.
Activity based explorative initiatives have previously been favored by experts because of their health benefits as Costa and Kallick highlight. However, passive social activities such as chilling out with friends or video games seem to be increasingly gaining prominence among various people and populations. “In 2011, mobile gaming took 13% of all time spent on games worldwide, totaling more than 130 million hours a day, and 9% of total money spent on games, grossing $5.8bn,” according to a Newzoo 2012 Mobile Games Trend Report.
In the U.S. alone, a 2012 Statistical Abstract of the United States of the U.S. Census Bureau reported that an estimated 87.5 million people representing a frequency of 38.3 percent of the sample population, “entertained friends and relatives at home” in the 12-month period between December 2009 and the December 2010. Does this mean that passive social activities are fast gaining preference over active social activities?
This research was, therefore, motivated not only by statistics but also by the increasing number of adult people who participate frequently in video gaming as their favorite social activities. The growing availability of portable handheld electronic gadgets and gaming consoles as well as expanded internet accessibility has largely contributed to the surge in the number of adult video gaming enthusiasts.
The Newzoo 2012 Mobile Games Trend Report indicated that “the total number of Americans that play games on their smartphone, tablet or iPod Touch has now surpassed the 100 million mark, a year-on-year increase of 35%.” The research points out the different aspects of active and passive social activities with the objective of analyzing the current video gaming trends and preferences amongst the broader population.
Research Questions
We were interested in understanding the patterns of social activities among students and employed people as well as their patterns of behavior when playing video games. We particularly wanted to know and get answers to the following issues:
- Did respondents hold positive opinion of social activities and how often did they engage in physical activities?
- How many respondents considered volunteer work to be a social activity and how many of them participate in volunteer work?
- How frequently did respondents attend friends’ gatherings and outings in their social routines?
- How many respondents preferred video games over going out and how many hours per day did they spend on playing video games?
- What do respondents do if bedtime comes up but they continue to play a game?
Methodology
The research design involved the use of a written questionnaire that targeted a convenience sample of respondents within the college population. The respondents were categorized in three groups comprising both students and employees. The two groups totaled 50 participants with each group consisting of a minimum of nine participants of either gender, single or married, and aged above 18 years. Data were collected through questionnaires over a period of seven days with the objective of enhancing quality reprisal. Questionnaires were handed out to 50 respondents, 41 students and nine employees with the expectations of a response rate of 80 percent. Surprisingly, the respondents returned a response rate of 100 percent.
The determination of significant differences between the three main focus groups was attained by applying a design that allowed the drawing of repeated measures to track variations as stated by Trochin and Donnelly. Query clusters were constructed to determine a likely outcome and their occurrences with responses ranging from frequencies of activities to outright yes or no answers. The subject of the research was validated by redefining the important functional aspects of leisure activities. As such, references were made from information databases including books and web sites.
Results
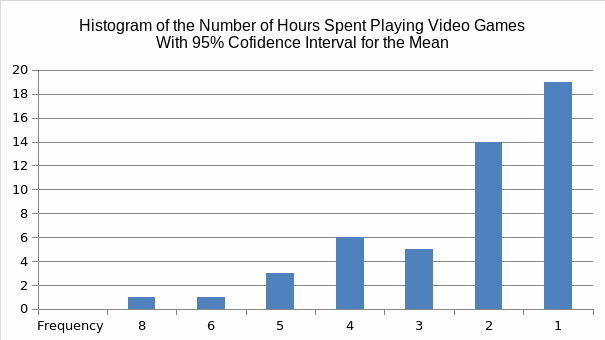
The average number of hours spent playing video games by the respondents is 2.32 + 1.25 giving a 95% confidence interval. The standard deviation for the sample is 1.57. See Figure 1.

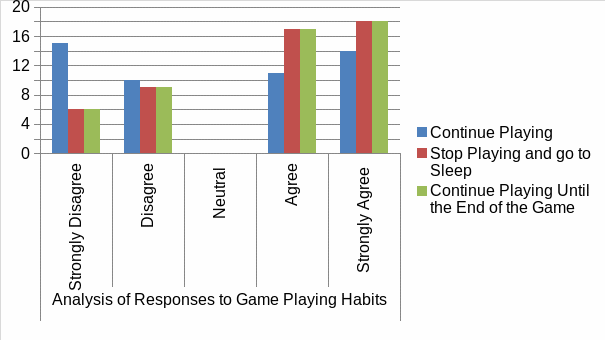
The results were subjected to a five-point scale similar to Likert, which comprise “Strongly Disagree” to “Strongly Agree.” Three statements of varying degrees of habits were subjected to the respondents with the aim of measuring their game playing habits. 36% of the respondents confirmed that they continued playing until the end of the game when bed time comes up. Another 36% of respondents confirmed that they stopped playing and went to bed while 28% indicated that they just stopped playing. All respondents answered the questions.
Figure 2 shows vivid summaries of these results with the remainder of the questions being captured by Table 1.

Table 1: Analysis of Responses to Video Game Habits.
The average of responses of the respondents to their game playing habits when bed time came would average 2.0 in the Likert scale even if distribution of the responses was experienced. The calculated p-value of 0.000 together with a Chi-value of 33.3 led to our conclusion that the data showed some degree of uniform distribution considering that the size of the sample was bigger than the Chi-square value required for the achievement of minimum response rates.
When respondents were asked about the number of times per week they gather with their friends, 40% of them answered 1-3 times while 30% and 28% answered 4-5 times and everyday respectively. Only one respondent did not spend time with friends at all. When asked about the number of times per week people engaged in physical activities, 30% of the respondents answered that the number amounted to1-3 times, with another 10% of the respondents going out approximately 4-5 times, 12 percent of respondents went out on a daily basis while 18 percent of the respondents did not engage in physical activities at all.
So, the question on volunteer work was forthright as respondents were required to answer either yes or no. When the respondents were asked if they had participated in volunteer work, 64% answered “no” while only 36% of them answered “yes”. In terms of the mean and standard deviation for the two groups, there was a clear difference that indicated less preference for fiscal past-time activities.
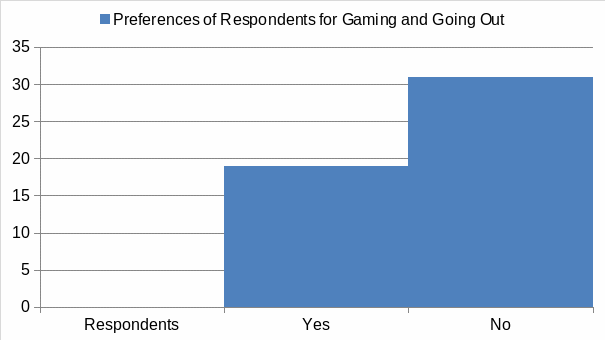
Of the 50 respondents, 19 (38%) preferred to play video games rather than going out while 31(62%) of them preferred going out rather then playing video games. Responses to this question showed some interesting relationship between two variables, namely yes and no, that was not exhibited by the responses to the other questions. The mean for respondents with preferences of either playing video games or going out is 25. The sample exhibited a standard deviation of 8.49, as demonstrated in figure 3.

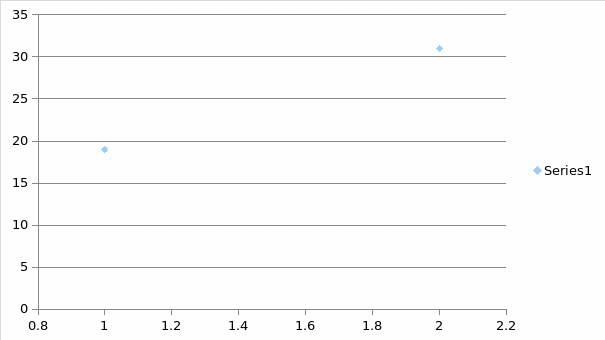
The relationship between the number of respondents who prefer video games and those who prefer going out produced a Pearson r of 0.99 as demonstrated by figure 4. This result underlined a positive relationship between the two variables because Pearson values which are closer to 1 show that any increments on the variables occur concurrently.

Conclusion
Thus, we reliably established that students and employees spent quite a considerable amount of their time on leisure activities. There was a 36 percentage tie in the number of respondents who stopped playing and went to sleep and those who continued playing until they finished the game when the bedtime came up. The gravity of our research problem was confirmed by the fact that only 36% of the respondents were engaged in active physical exercises compared to 64% who preferred video games and other passive social activities.
Therefore, it must be summarized that the analytical process has addressed this research problem by examining all the quotients that are related to the behavioral aspects of respondents towards leisure. The data analysis has given clear discrepancies that exist between active exercises and passive past time activities. The convenience data sample comprising full-time students, part-time students, and full-time employees adequately served the purpose of portraying a representative sample of the entire population.
References
- A. Costa and B. Kallick, Habits of Mind. A Developmental Series. Alexandria, VA: ASCD, 2000.
- W. Trochin and J. P. Donnelly, The Research Methods Knowledge Base, 3e, Atomic Dog, 2007.
- U.S. Census Bureau, Statistical Abstract of the United States (2012). Web.
- Newzoo, Mobile Games Trend Report (2012). Web.