Introduction and Purpose
This paper is a data analysis project. Here data collected from secondary sources are interpreted using statistical tools and then are analyzed to answer questions related to the economy as a whole and more micro-level issues termed as personal questions. Economic data presents a lot of information and if analyzed properly can answer many unknown questions. Analysis of economic data helps us to identify the trend of change in economic indicators and the way they would affect daily business practices and us personally. This paper aims at unearthing this tool of data interpretation. Indicators like gasoline price, unemployment rate, real gross domestic product (GDP), and inflation rate provide a distinct view regarding certain general queries about the economy as a whole and personal queries on a micro-level. The paper has four parts. First, a discussion of the source and collection method has been described. Then an analysis of the collected data is undertaken and they are illustrated using diagrams and tables. The third part will answer the general questions regarding the economic indicators and the fourth part will answer a few personal questions.
Data Source and Collection
The data for the report has been collected from an online database of economic time series data available at Ergonomics.com. The data which has been queried from the database are related to gasoline prices in California, the unemployment rate in the US, the inflation rate in the US, and Real GDP. The data that has been gathered is quarterly data from the first quarter of 2000 to the last quarter of 2006. In the case of gasoline prices in California, the data was derived from the Department of Energy data, which had been provided as weekly data. This was then transformed into average monthly data, which was then transformed into quarterly averages. The data recorded was quarterly averages 2000 to 2006. The second indicator, which was quarried, was the unemployment rate. This was derived from the Bureau of Labor Statistics. The quarterly data recorded was transformed from monthly data for 2000 to 2006. The inflation rate was documented by recording the Consumer price index was derived as a percentage change in quarter-to-quarter form. This was done by transforming the data from quarterly averages into percentage change quarter-to-quarter. The fourth indicator recorded was the growth rate. This data was derived from the Department of Commerce. This was done by recording the real GDP chained to 1996 prices. The data was recorded as quarterly data on real GDP and its growth rate from the first quarter of 2000 to the fourth quarter of 2006.
Data Analysis and Illustration
Figure 1 shows the quarterly gasoline prices in California. The data is provided in the appendix (Table 1). This shows that gasoline prices have been going through a rise and fall throughout the period. In 2000, gasoline prices increased constantly.
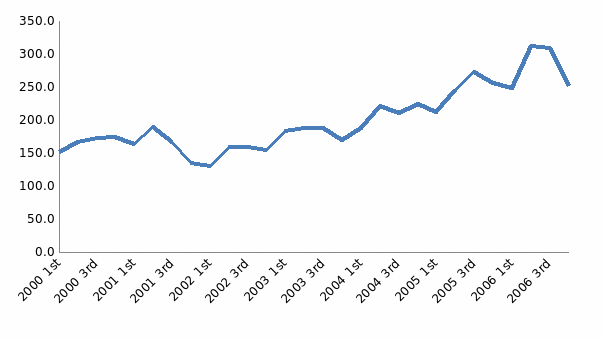
Table 1:
In 2001, the price fell in the 1st quarter, then rose for the next two quarters and fell by 18 percent in 4th quarter of 2001. It fell further in 1st quarter of 2002 and then again started rising. There has been intermittent rise and fall in the price of gasoline throughout the period. However, it can be said that the gasoline prices in 2006 are considerably higher (more than 65 percent) than what it was in 2000. In general, there has been a price increase in gasoline over the period. The maximum price that was attained in the period was 312.8 and the lowest was 130.6 cents per gallon. The average price for the whole period is 200 cents per gallon and there is an immense deviation in the prices of gasoline in the period, thus, the standard deviation comes to 48.9.
The rate of unemployment in the four quarters from 2000 to 2006 has been shown in Figure 2. The data shows that unemployment rate had increased from the 1st quarter of 2000 trough 2nd quarter of 2002 and then remained almost stable before it started declining in 4th quarter of 2003. The average unemployment rate for the whole period is 5.1, which is marginally higher than the natural unemployment rate of 5. Thus, overall the unemployment rate for the period was not very high.
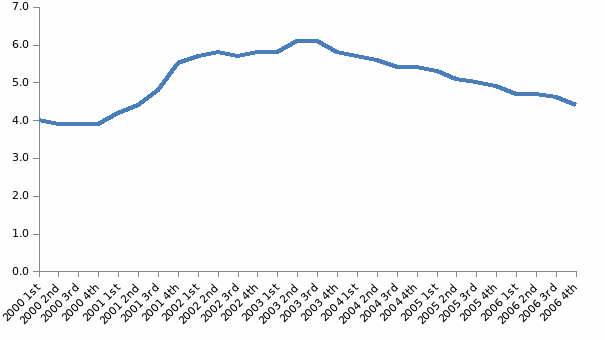
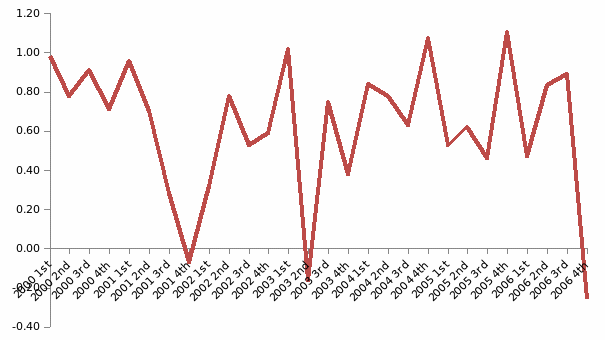
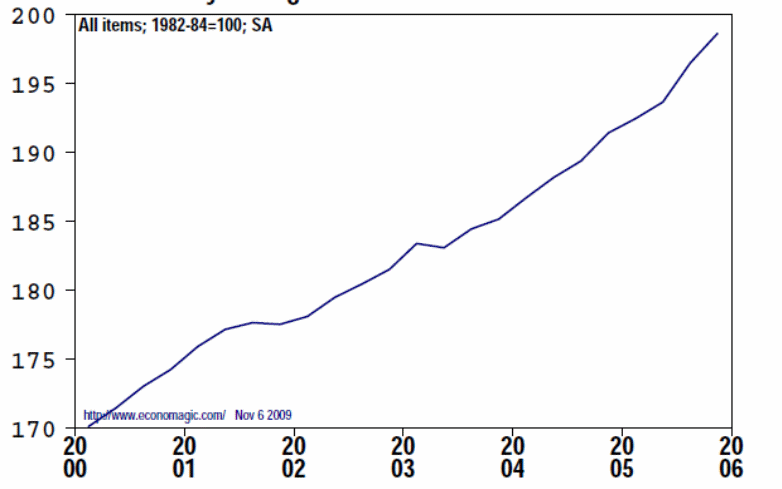
Figure 3 represents the quarterly change in the inflation rate, which is taken to be the consumer price index (CPI). The percentage change as shown in the figure shows that the inflation rate has been changing sporadically. There were constant rises and falls in inflation, which followed no specific pattern. The CPI quarterly average for urban areas shows that it constantly increased over the period of 2000 to 2006 (see Figure 4).
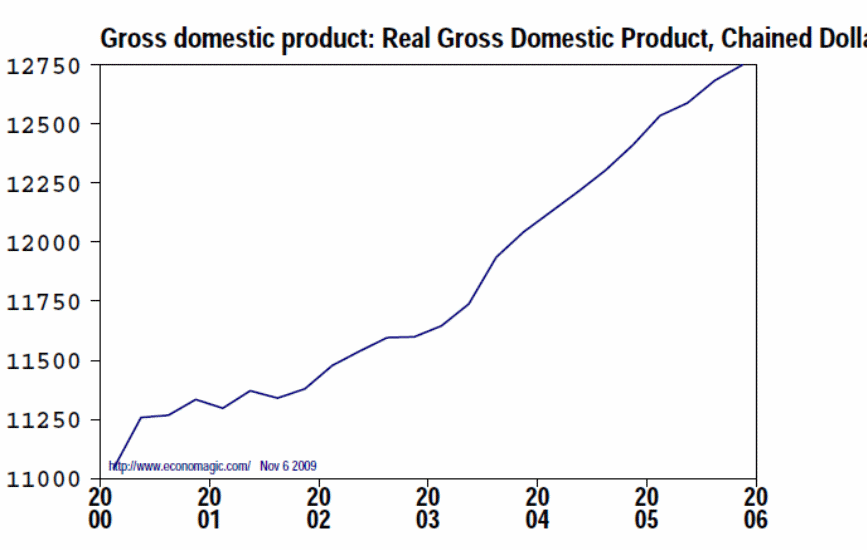
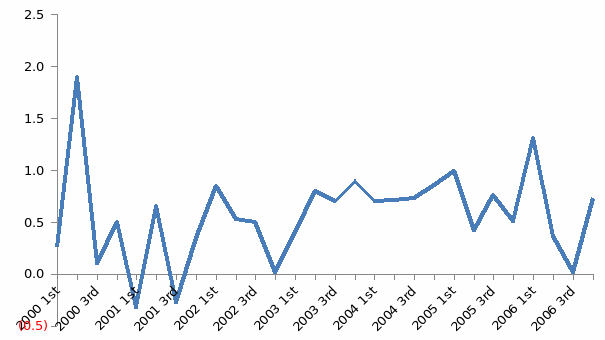
Real GDP as shown in Figure 5 has increased over the period of 2000 to 2006. The rate of economic growth in the period on a quarterly basis has risen and fallen as can be observed from Figure 6. The percentage change in real GDP from quarter to quarter has been increasing very abruptly or falling sharply – as could be observed in 2nd quarter of 2000 when the growth rate rose while in 3rd quarter of 2000, it again fell abruptly.
General Question
The first question is related to gasoline prices rise and fall. What will be the effect of the rise and fall in gasoline prices on production cost and profitability of business? Gasoline is an important raw material for all businesses as it is required for various purposes. Thus, an increase in gasoline prices will increase the cost of production, as it will add up to the company’s manufacturing cost. As the cost of the business will rise up, revenue remaining same, the profit earned will reduce. Thus, an increase in gasoline prices will affect business adversely. Thus, gasoline prices are directly related to production costs and negatively related to profitability of business.
The unemployment rate is an important indicator as it shows the percentage of the labor force, which is not working. It is critical to provide work to the labor force as it increases the efficiency of the economy, and more employed people increase the gross domestic product of the country. However, in case of the data analyzed, it can be observed that a correlation between real GDP and unemployment rate is positive though the correlation is very low i.e. 0.15, indicating a weak relation.
A higher inflation indicates the prices of commodities become higher. This indicates that the cost of production for businesses will become higher. This will again give a push to the average prices in the economy. Inflation is a critical indicator as it shows how the prices in the economy are moving.
A steady economic growth is required; as a fall in the growth rate will increase inflation, which will increases average prices in the economy. Further, a steady economic growth indicates strong fundamentals, which is reflected in the businesses of the economy.
Correlation Analysis
Personal question
With an increase in gasoline prices, my monthly expense budget will increase, as I will have to spend more on fuel for my vehicle. Apart from this gasoline, prices are also related to the production cost of other products, and hence affecting the prices of commodities that I purchase from the market. This can be observed by correlating the quarterly prices of gasoline to the percentage change in quarterly CPI, which has a correlation of 0.18. This indicates that the as the price of gasoline increases there is an increase in the rate of inflation, thus increasing my expenses.
As unemployment rate increases, my chances of getting a job will depend on the salary I am willing to take. This is so because unemployment rate increases when there is excess supply of labor. Thus, the economy will come to equilibrium when the supply and demand decline and the wage rates will decline to match with the supply of labor at that wage rate which the businesses can accommodate. Therefore I may be able to get a job, but at a lower salary.
As there is an increase in inflation, it will increase the prices in the economy by increasing the CPI. This will increase the cost of production for most companies and thus affect their profitability. Companies will try to cut costs and by doing so they may want to reduce the pay packages they offer to new hires. This will adversely affect my wages or salary.
A sustainable growth indicates higher employment rate, which will provide better opportunities for me. Further, it also indicates a healthier business environment where businesses are thriving. Therefore, it will help me to get a better job. As the job opportunities are more, production is more, businesses are making more profit, they are willing to hire talent at a higher price – indicating higher salaries for me.
Reference
Economagic.com. Economic Time Series Page. 2009. Web.