AVR and Generator Output Voltage Data
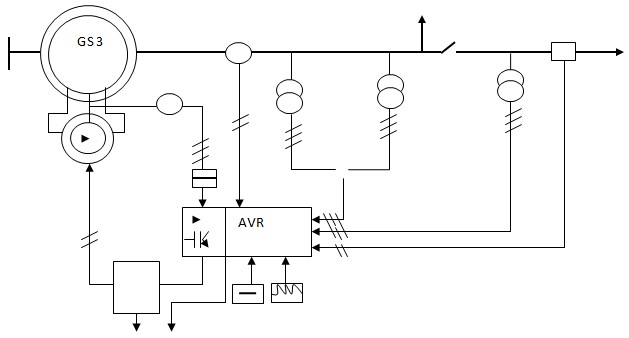
The major function of the GEC automatic voltage regulator (AVR) is to control the voltage rates in a synchronous generator and to prevent the voltage output from exceeding the set standards (Mahmodd, 2008). The desired values of the generator voltage output are set as default data to the automatic voltage regulator, while the measured data are obtained in the process illustrated by Figure 1:

Thus, it is obvious that automatic voltage regulator is an integral part of the synchronous generator circuit. The means in which the automatic voltage regulator controls and reports the voltage output of the generator range from the excitation system control to the field winding measurement techniques (Mahmodd, 2008).
Operational Amplifier Circuit and Deviation Signal
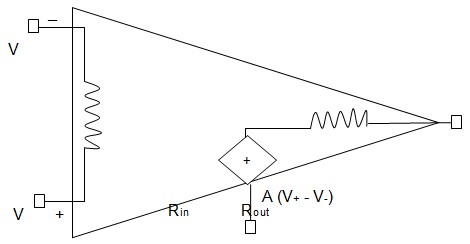
Traditionally, to produce the deviations signals operational amplifier circuits are used in the marine electrical engineering (Mahmodd, 2008). Figure 2 illustrates the conventional operational amplifier circuit diagram:

The point about the deviations signals is that operational amplifier circuits are conventionally equipped with the deviation signals’ generator circuits producing deviation signals in case of the errors observed in the supply of voltage, excessive or lacking voltage (Mahmodd, 2008). Accordingly, operational amplifier circuits can produce deviation signals to point to the deviation of the voltage value measured by the automatic voltage regulator from the so-called digital command value. As well, Mahmodd (2008) argues that operational amplifier circuits base their deviation signals on data about the inexpensive and simple configuration circuits.
K1 and K2 Coefficient from Operational Amplifier Circuit
Further on, it is important to consider the numerical and equation data about the signal deviation calculations and the work of the operational amplifier circuits in this process. According to Mahmodd (2008), signal deviation value is measured with the help of the following equation:
DEV = – [K1DV + K2MV]
In the above equation, DEV represents the deviation value, while K1 and K2 are the coefficients that illustrate the limitations of the signal deviations (Mahmodd, 2008). To derive the meaning of both coefficients K1 and K2, the equation should be modified to allow subtracting one of the coefficients from the deviation signal total meaning and then the K1 or K2 meaning to be parted from the K1DV relation (Mahmodd, 2008):
K1DV = DEV – (-K2MV)
K1 = DEV – (-K2MV)/DV or
K2MV = DEV – (-K1DV)
K2 = DEV – (-K1DV)/MV
Range of Measured Value Signal
The concepts of the measured value signal and the deviation signal are interrelated when they concern the performance of the operational amplifier circuits or the automatic voltage regulator. According to Mahmodd (2008) and Servowatch (2009), the deviation (d) signal is calculated as a difference between the average (x) and the sum of particular measured value signals (x1). At the same time, the average measured value is the sum of the particular measured values divided by the number of measurements (n) (Mahmodd, 2008). The necessary formulas to calculate the range of measured value signals include:
d = x – x1
x = x1 + x2/n
So, referring to the average measured value signal as the difference between the particular measured value signals, this range can be characterized by the difference between deviation signals limits of 0V to 10V. Therefore, when the deviation signal is 0V, the measured value signal range starts at 0:
d = x – x1= 0
x1 = 0
If the deviation signal is 10V, therefore x2 can be referred to as 10, and the result is the ability to calculate the average measured value signal or the range of the measured value signal:
x = x1 + x2/n
x = 0 + 10/2 = 5
Therefore, the range of the measured value signal is from 0 to 10, and the average measured value signal equals 5.
AVR Response to Generator Output Voltage Changes
The automatic voltage regulator is the device used to stabilize and maintain the voltage output in a generator. Therefore, it is natural when the automatic voltage regulator reacts to the changes in the generator’s voltage output. As Mahmodd (2008) argues, the automatic voltage regulator is connected to the generator through the main stator and field exciter windings that report the current-voltage output of the generator and allow the automatic voltage regulator to provide the lacking voltage amount to the generator (Mahmodd, 2008). Accordingly, when the voltage output of a generator is changed, the automatic voltage regulator reacts by the initial lack of voltage provided to the generator and by the subsequent need to feed more voltage into the generator through the stator and field exciter windings.
Thyristor Conduction Control
The thyristor is a semiconductor device consisting of two pairs of diodes labeled p-n. The process of checking and controlling the conduction in a thyristor involves two major varieties of the process, i. e. when a thyristor is active or blocked and consists of the following stages as described by Mahmodd (2008):
- When a thyristor is blocked it is necessary to figure out the anode-cathode voltage and relate it to the maximum allowed voltage for the thyristor turn-on procedure. In case if the calculated voltage exceeds the voltage norm, then conductivity is damaged.
- Next, it is necessary to relate the voltage meaning to the firing pulse value by comparing the voltages of the synchronizing and control generators.
- Finally, see if the firing pulse is reached by the voltage. If so, the thyristor is active and its conductivity conforms to the standard.
Bond Servoline Data Acquisition Unit: Types of Signal and Range
The device titled Bond Servoline Data Acquisition Unit is used to monitor the winding temperature of the generator stator. To connect the generator stator to the Bond Servoline Data Acquisition Unit and to be able to interpret the Unit’s data, it is necessary to use a specific type of temperature transducer. As Mahmodd (2008) argues, transducers are divided according to the data they can convert and report. Drawing from this, to monitor the temperature data, it is necessary to use the sensor transducer. As a rule, such a transducer is compatible with either direct-current or low-voltage signals, while the variety of operable ranges includes over 30 types among which split, full, multi-mode ranges are dominant.
Signal Conditioning Card to Interface Transducer with Bond Servoline Data Acquisition Unit
The proper connection and interfacing of the transducer with the Bond Servoline Data Acquisition Unit become possible due to the performance of the fitting signal conditioning card. The most appropriate signal conditioning card for the transducer discussed above is the Multi-Voltage Input Card with its two varieties being A high and B low cards (Servowatch, 2009). The point here is that the Multi-Voltage Input Card allows the transducer to be interfaced with the Bond Servoline Data Acquisition Unit and operate in the voltage range of 0 to 5 or even 10V, which is of crucial importance for a generator with possible voltage deviations and the range of the measured value signal being 0V to 10V.
Signal Conditioning Required
Considering the topic of data acquisition units it is also necessary to understand that signal conditioning is currently a must for the data acquisition procedures. First, Servowatch (2009) argues that signal conditioning facilitates the quality and precision of measurement in data acquisition practices. Signal conditioning also helps to amplify the signal and avoid additional effort associated with the recognition of the signal in the noisy environment. Finally, signal conditioning is of great use for accuracy increase in sensor measurement and the work of transducers interfaced with the Bond Servoline Data Acquisition Units.
Circuit Signal Conditioning
Finally, to successfully implement signal conditioning, it should be interfaced with the help of a circuit. To achieve this, the signal conditioning system must operate at the full-range voltage in the levels between 10mV and 100mV. As well, the creation of the signal conditioning circuit requires three types of amplifiers including the differential and two instrumentation amplifiers. These amplifiers handle the input voltage and facilitate the feeding of the circuit (Mahmodd, 2008; Servowatch, 2009). Finally, resistor matching is needed for the circuit to operate at the changing voltage rates.
Works Cited
Mahmodd, Abdelalah. “Design of Antiwindup AVR for Synchronous Generator Using Matlab Simulation.” Electric Engineering Department (2008).
Servowatch. “B101 DAU.” Data Acquisition Unit (2009).