Introduction
The figures below show correlation results between cases of asthma admission and environmental variables in Abu Dhabi’s 12 government hospitals between June 1st, 2011, and May 31st, 2013. The correlation shows the results after removing data from July and August. It is shown that the number of patients decreases during the summer. The decrease is attributed to the fact that most people travel during this period. That is why the two months have been excluded. A scientific comparison is made between the previous correlation (before exclusion of July and August) and after removing them.
Analysis of Data
Humidex (Temperature and Humidity)
The data for this section was sourced from SEHA.
Temperature
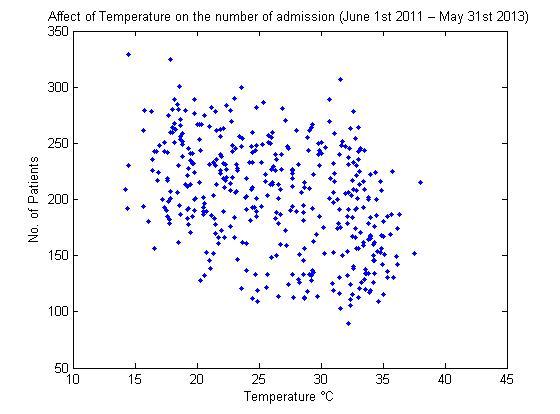
Linear Correlation = – 0.4069
P Value = 4.2656e-18 (< 0.05)
From the graph above, it is seen that there is a negative correlation between change in temperatures and the number of admission cases recorded in Abu Dhabi. As such, the increase in temperature does not result in a rise in the number of hospitalization cases. On the contrary, higher cases are reported during cold weather. In this case, a large proportion of the population is reported to come down with asthma during the winter season. As observed from the graph, the largest number of persons suffering from the medical condition is recorded at temperatures slightly below 15°C. At the time, over 330 persons were reported to have been suffering from the condition.
The results of July and August are excluded. During the two months, there is a decrease in the number of persons in Abu Dhabi. Most people travel away to spend summer holidays in different tourist destinations across the world to escape the heat experienced at the time. The exclusion of the two months provides a clearer picture of the effect of environmental conditions on asthma cases reported in the area. The reason is that the data is only obtained from the actual inhabitants of the city. People travel back to Abu Dhabi towards the end of August.
The variations in correlation between the effect of temperatures and the number of asthma cases when the two months are included and upon exclusion are minimal. The reason is that the region is hot throughout the year. Unlike other parts of the world, the average temperatures recorded during the winter season are generally high at about 24°C. As a result, there are no significant differences in correlation even after excluding July and August.
However, it is important to note that the exclusion of the two months has resulted in a change in the values of linear correlation. The reason is that they are considered the hottest months. As such, the number of asthma cases reported is significantly lower compared to those in the other months. The high prevalence of the health condition is associated with low temperatures. As such, excluding the months has led to a slight increase in correlation.
Humidity
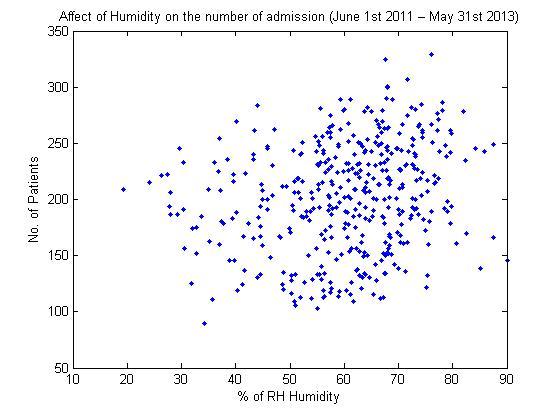
Linear Correlation = 0.2172
P Value = 7.4017e-06 (< 0.05)
The graph shows a positive correlation between changes in humidity and asthma admissions. The increase in the amount of moisture content in the environment translates to a rise in the number of patients suffering from the health condition. The highest number of admissions was recorded at humidity levels of between 65 and 75 percent. The exclusion of data collected in July and August adversely affects the correlation. The values remain positive. However, there is a slight decrease in the level of correlation. The reason is that the two months are warmer compared to the rest of the year. Little or no precipitation is experienced at the time. As a result, the area is generally dry with little moisture, leading to an increase in the levels of relative humidity. The element is not factored in after the exclusion. As a result, there is a deficit in data showing that lower humidity is associated with a decreased prevalence of asthma in the region. Another factor that resulted in a decrease in correlation with regards to the effects of humidity on admissions following the exclusion of July and August is the increase in population experienced in the two months. People tend to travel away from the region. As such, fewer persons are reporting the health condition.
All the other months of the year are cooler compared to July and August. The area experiences little amounts of rainfall at the time, especially during winter. The season spans from November to March. The water evaporates rapidly as a result of the high temperatures experienced throughout the year. Consequently, the atmosphere at the time has higher amounts of moisture compared to July and August. Higher cases of asthma are reported at the time. The variation is, however, of little magnitude.
Humidex
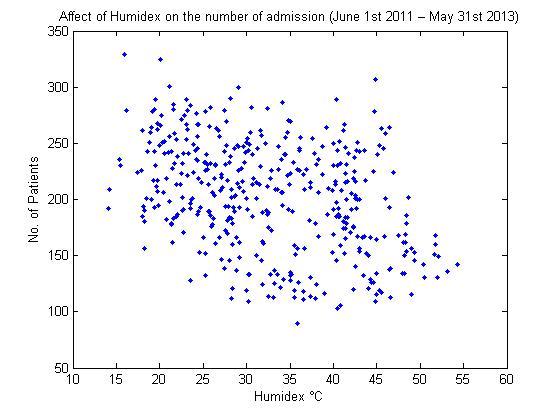
Linear Correlation = – 0.3885
P Value = 1.6641e-16 (< 0.05)
Even with the exclusion of data from July and August, there is a negative correlation between humidex and the number of asthma admissions recorded in Abu Dhabi. An increase in humidex (°C) levels does not translate to a rise in asthma admissions. The reason why the value of the linear correlation between the two variables remains negative even after the exclusion of July and August is that the data left out does not hurt the final results of the study. During the two months, the humidex is higher compared to other times of the year. However, the difference is not very significant. The reason is that the humidex of the city is high throughout the year. It ranges between 15 and 55°C. Low levels are experienced during the winter season. It is associated with a high prevalence of asthma as a result of the cold temperatures. High levels of humidex are experienced during summer, especially during July and August. The situation is associated with lower asthma cases. However, most of the people in the region have traveled out of the city during this time. As a result, the data collected during the two months is not reliable. It does not give a true reflection of the effects of environmental factors on the prevalence of asthma.
Exclusion of the two months leads to a deficit in data showing that low asthma cases are recorded during the summer season. The data was previously vital in lowering the level of correlation between humidex and asthma conditions to – 0.5951. However, it increased to – 0.3885 with the exclusion of the months. The reason is that a significant amount of data linking high humidex to lower cases of asthma admissions has been left out.
Vegetation Index (NDVI)
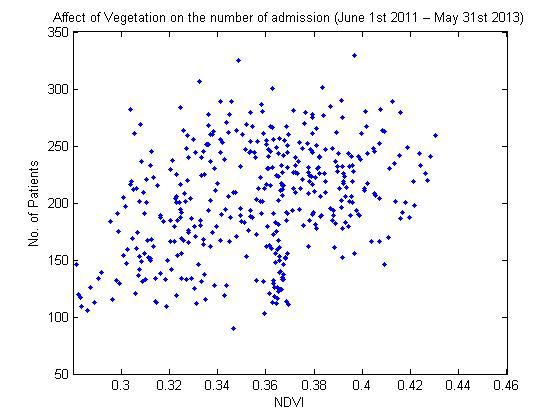
Linear Correlation = 0.3434
P Value = 5.2157e-13 (< 0.05)
The graph shows a positive correlation between NDVI and the number of asthma admission cases. The results were obtained even after the exclusion of July and August. It is important to note that an increase in NDVI is associated with precipitation. In the region, rainfall is recorded during the winter season. During the time, plants are green. The development increases NDVI. Little or no rainfall is experienced during the summer season. As a result, plants die off. Only a few species of drought-resistant desert plants survive the harsh conditions. As a result, the value of NDVI reduces significantly.
Correlation between NDVI and asthma cases reduced from 0.5306 to 0.3434. The change indicates that there is a significant reduction in the amount of data that was initially used to support the correlation. As the previous results had shown, high levels of NDVI are associated with an increase in the number of asthma cases reported across Abu Dhabi. The reason is that the vegetation at the time tends to grow and reproduce at a fast rate. Flowers are produced by the plants at the time to promote reproduction. The flowers are a source of pollen, one of the allergens known to trigger asthma attacks. Lower cases of asthma, on the other hand, are associated with reduced levels of NDVI. Little or no pollen is produced at the time. As a result, the concentration of the allergen in the atmosphere is lowered.
Temperatures are usually high during July and August in Abu Dhabi. During the time, there is a reduction in the levels of NDVI recorded. The reason is that most plants die off due to lack of water. The few surviving green plants produce little or no pollen since lack of water decreases their ability to reproduce. Consequently, few persons would develop asthma during the period even if the size of the population remained constant throughout the year. Failure to include the data obtained from the two months has led to a decrease in correlation since there is inadequate information showing the effect of low NDVI on the prevalence of asthma. As a result, the researcher has limited information to compare prevalence rates of the condition when NDVI is high and when it is low. Since the data is showing that low NDVI is associated with decreased numbers of admissions, its shortage will lead to a reduction in the correlation value.
Air Quality Concentration in Abu Dhabi
Air quality concentration (PM10, PM2.5, NO2, SO2, H2S, CO, O3) for the period between June 2011 and May 2013 was determined. The data for this section was obtained from the Environmental Agency of Abu Dhabi. The information was collected using air quality detention stations distributed across Abu Dhabi. Data for July and August were excluded from the final results.
Concentration of PM10
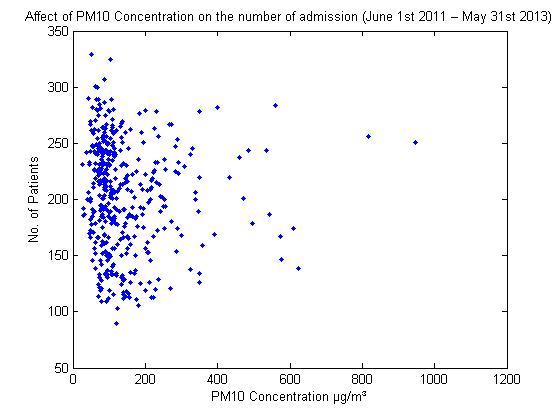
Linear Correlation = – 0.0498
P Value = 0.3102 (> 0.05)
Even with the exclusion of July and August, there is a negative linear correlation between the concentration of PM10 particles and the number of asthma admission cases. The increase in the concentration of the particles does not result in a rise in the number of admission cases. The highest number of cases is reported when the concentration of the PM10 particles is low. The number of admissions, on the other hand, decreases with an increase in the concentration of the PM10 particles.
With the exclusion of July and August, the value of the linear correlation between the two variables is seen to shift towards the positive direction. It changes from -0.1636 to -0.0498. The shift indicates that the data collected show a closer relationship between the concentration of the particles and the number of cases reported in Abu Dhabi hospitals. The shift is attributed to the exclusion of the summer holiday since most of the population in Abu Dhabi is reported to have traveled away from the region. With July and August being the hottest and driest months of the year, the concentration of the PM 10 particles is high. The reason attributed to the increase in the particle concentration is the rise in the frequency at which sand storms occur within the area.
In the previous results, before the exclusion of July and August, the highest concentration of the PM10 particles was observed in the two months of the year. At the time, the lowest numbers of admission cases related to Asthma in Abu Dhabi were reported annually. The data sourced from the two months proved beyond a reasonable doubt that an increase in the concentration of the PM 10 particles leads to a decrease in the number of hospital admissions. The previous results had also succeeded in demonstrating that higher admission cases were reported when the concentration of the particles was lower. As such, the value of the linear correlation was negative. Failure to include the months of July and August, therefore, causes a deficit in data supporting a negative correlation between the two variables. The correlation value, therefore, tends to shift towards the positive side. However, the exclusion of the two months does not adversely affect the relationship between the two variables since the linear correlation value remains negative.
PM2.5
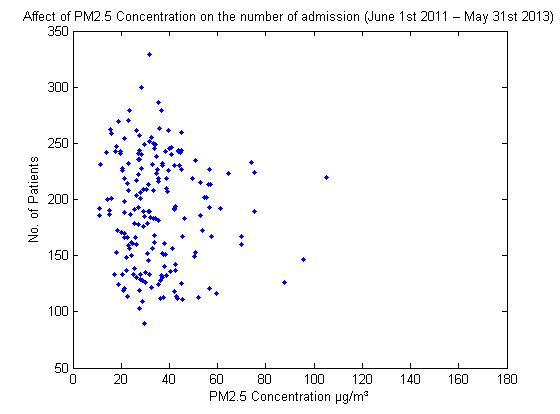
Linear Correlation = – 0.0652
P Value = 0.3742 (> 0.05)
The graph above shows that there is a negative correlation between the effect of the concentration of PM 2.5 particles and the number of persons admitted with asthma cases in the Abu Dhabi region. Looking at the graph, we are in a position to tell that an increase in the concentration of the particles does not result in a rise in the number of admissions and vice-versa. Lower concentrations of the PM 2.5 particles are seen to be increasing the number of hospitalization cases associated with asthma. The trend is similar to that which was recorded previously before data obtained in July and August were excluded. In this case, the exclusion did not adversely affect the results.
The linear correlation value of the two variables shifted towards the positive direction with the exclusion of data from the two months. It changed from – 0.3366 to – 0.0652. The value is close to zero which signifies no correlation. It is extremely difficult to establish the relationship that exists between changes in the concentration of PM 2.5 particles in the atmosphere and the number of asthma cases reported. The data seems to be extremely scattered. The shift in the correlation value from – 0.3366 to – 0.0652 can also be seen as an increase in correlation between the two valuables.
The reason for the shift in the value of the linear correlation between the two variables upon the exclusion of results from the two months is that there is a deficit in the amount of data showing the effect of high PM 2.5 on the number of asthma hospital admission cases. From the previous results, it was clear that the two months are associated with a high concentration of the particles in the atmosphere. Normally, the increase in the concentration of the particles would result in a rise in the prevalence rate of the health condition. However, most of the people living in the area have traveled to other parts of the world during the two months. The population left behind is small although the proportion of the population suffering from the health condition is high. In this case, the results obtained previously would be interpreted to mean that an increase in PM 2.5 concentration lowers the number of admission cases. With the exclusion of the two months, this data is left out. As such, there will be a deficit in data showing that the two phenomena are not positively correlated. The linear correlation value is therefore expected to shift towards the positive direction.
NO2
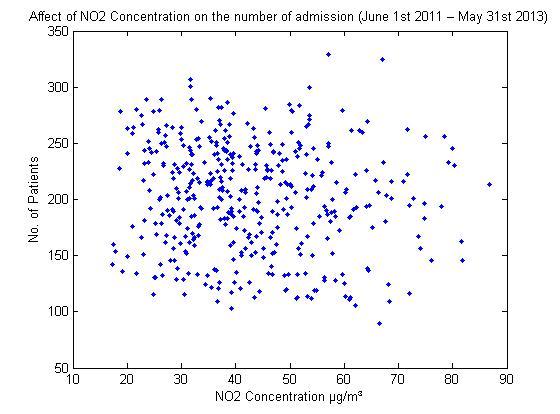
Linear Correlation = – 0.0981
P Value = 0.0451 (< 0.05)
From the graph above, we can establish that there is a negative correlation between the effect of the concentration of nitrogen dioxide gas and the number of individuals admitted to Abu Dhabi hospitals for suffering from asthma. In this case, the graph shows that an increase in the concentration of the gas does not result in a rise in the number of persons found to be suffering from the medical condition and vice-versa. From the previous results, we were in a position to establish that the concentration of the gas in Abu Dhabi is high throughout the year. The reason behind this is that the gas is produced daily both at the household and local level. At the household level, the gas is produced from cooking gas and kerosene. The two are the most common source of heating in the city since they are readily available. The reason behind this is that the area is known to hold some of the world’s largest oil and gas reserves. Industrial activities in the city are also associated with the high concentration of the gas.
With the exclusion of results obtained from July and August, the value of the linear correlation between the effect of nitrogen dioxide gas and asthma admission cases shifts to the negative side. It changes from 0.1252 to – 0.0981. During the two months, the concentration of the gas was found to be slightly lower compared to other parts of the year as per the previous results. The number of persons admitted to Abu Dhabi hospitals for having being found to be suffering from asthma was found to be declining. The reason behind this was found to be that most of the city’s population had traveled to other parts of the world to enjoy summer at the beginning of July only to return towards the End of August. The decrease in the levels of nitrogen dioxide at the time was attributed to a reduction in the population which resulted in lower human activities. Data from the two months was crucial in demonstrating that low concentrations of the gas were associated with a decreasing number of asthma admission cases. Since no other months show the effects of a decrease in the concentration of the gas on the number of asthma admissions this clearly. As a result, the exclusion of data from the two months results in a reduction in the values of linear correlation that exists among the two phenomena.
SO2
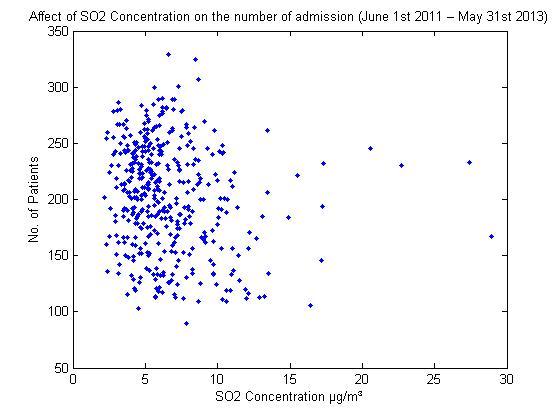
Linear Correlation = – 0.1681
P Value = 5.5995e-04 (<0.05)
The graph above shows that there is a negative correlation between the effect of the concentration of sulfur dioxide gas and the number of hospital admissions recorded in Abu Dhabi. In this case, a rise in the concentration of the gas in the atmosphere did not signify an increase in the number of admission cases relating to the health condition and vice-versa. The highest number of admission cases is recorded when the concentration of the gas was as low as 7µg/m3. From previous results, we were able to establish that higher concentrations of the gas of up to 28µg/m3 are associated with much lower numbers of admissions recorded. In the graph, it is important to note that the results of July and august have been excluded. The two months just like other times of the year in Abu Dhabi experience high concentrations of the gas. The concentration is however lower compared to that of other months of the year. The reason behind this is that it emanates naturally from the earth’s crust as a result of several activities, such as volcanic eruptions and the extraction of natural gas. The concentration tends to vary irregularly throughout the year. As a result, it is impossible to establish a trend.
With the exclusion of results obtained in July and August, there is a shift in the value of the correlation existing among the phenomena towards the negative direction. It changes from – 0.0775 to – 0.1681. The change shows that results showing higher levels of negative correlation are obtained with the exclusion of the two months. The reason behind this is that the concentration of the gas during the two months is lower compared to other times of the year. At the time, most of the city’s population has traveled to other parts of the world. As a result, fewer cases of asthma admissions will be reported following the reduction in population size. In the previous results, this was interpreted as a decrease in the concentration of the gas resulted in a reduction in the number of admission cases reported. The results, therefore, introduced an element of correlation in the previous results. The exclusion of these results will therefore result in a higher degree of negative correlation.
H2S
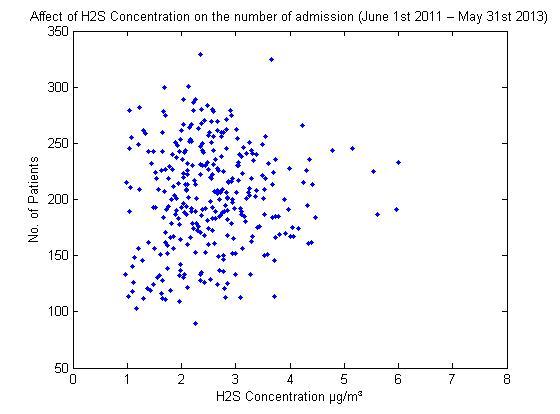
Linear Correlation = 0.0805
P Value = 0.1535 (>0.05)
The graph above shows that there is a positive correlation between the effect of the concentration of hydrogen sulfide gas and the number of asthma-related admission cases in Abu Dhabi. In this case, an increase in the concentration of the gas translates to a higher number of admissions in hospitals located in the area and vice-versa. The concentration of gas in the city was high throughout the year as shown from the previous results. The concentration of the gas in the atmosphere was dependent on environmental factors. It was mainly influenced by activities, such as the extraction of natural gas and bacterial decomposition of organic matter. Previous results also showed great variations in the concentration of the gas all year round. An increase in the concentration of the gas was associated with a lower number of persons suffering from asthma.
With the exclusion of results recorded in July and August in the graph, there is a shift in the value of the linear correlation between the two variables towards the positive direction. It changed from – 6.9101e-04 to 0.0805. The two months were associated with an increase in the concentration of the gas compared to other times of the year. However, there was a low prevalence of asthma during both months. The reason behind this is that a significantly large number of the city’s inhabitants have traveled away. The data for the two months therefore introduced an element of negative linear correlation in the previous results. With the exclusion of the two months, the element is removed. As a result, there is a shift in correlation value towards the positive direction as is observed in current results.
CO
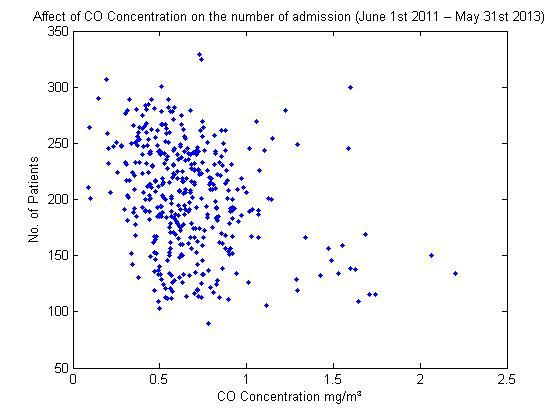
Linear Correlation = – 0.2874
P Value = 3.5003e-09 (< 0.05)
The current results show a negative correlation between the effect of carbon monoxide concentration and the number of persons suffering from asthma in Abu Dhabi. In this case, an increase in the concentration of the gas resulted in a decrease in the number of persons suffering from the health condition. From the previous results, we were able to establish that the area is associated with a high concentration of the gas throughout the year. The reason behind this is that the city is the capital of the United Arab Emirates (UAE) and the Abu Dhabi Emirates. As a result, the gas is emitted in large volumes as a result of incomplete combustion of carbon in motor vehicles and industrial plants located within the city.
In the current results, data for July and August have been excluded. The exclusion has resulted in a shift in the linear correlation value for the two variables towards the positive direction. It value changes from – 0.3205 to – 0.2874. The change signifies a decrease in the value of negative correlation. The reason behind this is that a high concentration of carbon monoxide is associated with a lower number of asthma admissions. Both July and August experience higher concentrations of the gas than other parts of the year. As a result, lower numbers of admission cases are expected. The presence of a lower population in the city at the time causes a further reduction in the number of asthma admissions. The situation increased the level of negative correlation in the previous results. The exclusion of the two months from the current results has therefore resulted in a reduction in the degree of negative correlation from – 0.3205 to – 0.2874.
O3
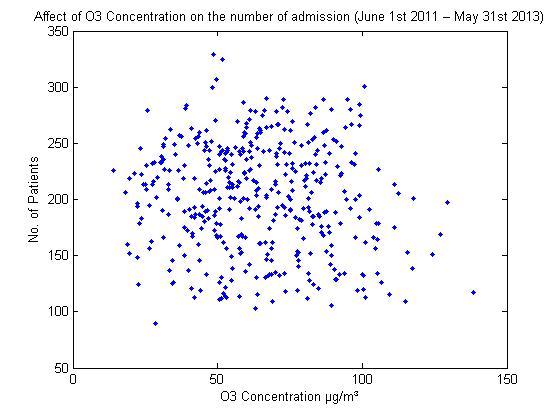
Linear Correlation = – 0.0921
P Value = 0.0600 (> 0.05)
From the graph above, it is clear that there is a negative correlation between the effect of the concentration of ozone on the number of asthma admission cases in the hospitals found within the city of Abu Dhabi. It is clear from the previous results that an increase in the levels of the gas in the atmosphere results in a decrease in the number of asthma admissions reported in the city. The concentration of the gas is higher in Abu Dhabi compared to most parts of the world.
In the current results, data obtained in July and August have been excluded. The change has resulted in a shift in the value of linear correlation for the two variables towards the negative direction. It was found to change from – 0.0235 to – 0.0921. To determine the reason for the shift, it is important to analyze the previous concentration of the gas for the two months and its resultant effects. The two months are associated with low concentrations of the gas. The number of asthma admission cases reported within the two months reduces as a result of a large number of persons traveling out of the city during summer. The results for the two months therefore introduced an element of positive correlation whereby the number of admissions reduces upon lowering the concentration of ozone. The exclusion of the two months results in the expulsion of data showing a bit of a positive correlation. As a result, there is an increase in the magnitude of negative linear correlation. As a result, the link between the two phenomena reduces from -0.0235 to -0.0921.
Bibliography
W. Elshorbagy, and M. Abdulkarim, “Chlorination byproducts in drinking water produced from thermal desalination in United Arab Emirates,” Environ. Mon. and Assessment, vol. 123, no. 3, pp. 313-331, 2006.
C. Davidson, The United Arab Emirates: A Study in Survival. Boulder, Colo: Lynne Rienner Publishers, 2005.
J. MacDonald, and S. Farah, “Environmental risks to public health in the United Arab Emirates: A quantitative assessment and strategic plan,” Environ. Health Perspect., vol. 120, no. 2, pp. 681–686, 2012.
C. Pope, “Respiratory hospital admissions associated with PM10 pollution in Utah, Salt Lake, and Cache Valleys,” Archives of Environ. Health, vol. 46, no. 3, pp. 90-97, 2006.
D. Nash, and D. Leith, “Ultrafine particle sampling with the UNC passive aerosol sampler,” Aero. Sci. and Tech., vol. 44, no. 1, pp. 1059-1064, 2010.
J. Heinrich, “Air pollution, asthma and allergies in children,” Occup. and Environ. Med., vol. 67, no. 3, pp. 290-291, 2010.
M. Kazim, “Assessments of primary energy consumption and its environmental consequences in the United Arab Emirates,” Ren. and Sust. Ener. Reviews, vol. 11, no. 2, pp. 426-446, 2007.