Introduction
Abu Dhabi is the capital of Abu Dhabi emirate. It is also considered to be the United Arab Emirates (UAE) capital. As such, it accounts for close to two-thirds of the UAE’s total economy. Research shows that it is the second-most populous city in the UAE. It has approximately 1 million people. It is situated in a desert environment and is dry throughout the year. It experiences summer between June and September. Winter occurs between November and March. It is hot and humid throughout the year. The environment is conducive for the development of various health complications, such as asthma. In this section, the author will provide the results collected from the Abu Dhabi region. The section seeks to provide a scientific description of the data presented in the figures generated through analysis.
Results
Correlation results between Asthma Admissions and Environmental Variables in Abu Dhabi’s Governmental Hospitals between June 1st, 2011, and May 31st, 2013.
Humidex (Temperature and Humidity)
Temperature
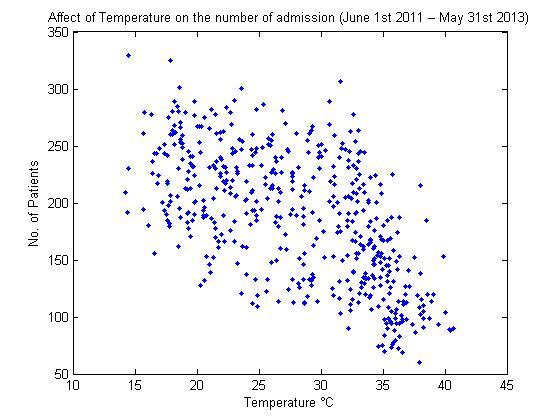
Linear Correlation = – 0.6009
P Value = 2.6734e-50 (< 0.05)
There is a negative correlation between the change in temperature and the number of asthma admissions in Abu Dhabi hospitals. With an increase in temperatures, the number of asthma cases reported within the city tends to go down. The reason behind this is that the high prevalence of the health condition is usually associated with low temperatures, especially during winter. In this case, even the variation in temperatures between the summer and winter season does not have much influence on the prevalence of the health condition. The reason behind this would be that the area is hot throughout the year.
The P-value for the correlation between the two variables is 2.6734e-50. In this case, it is lower than the significance level of 0.05. The value indicates that the correlation is statistically significant. Unlike most areas across the world, the city remains warm even during the winter season recording average temperatures of about 24°C. However, there tend to be fluctuations in temperatures throughout the year. During winter, cooler temperatures of up to below 15°C are experienced. With the population of Abu Dhabi being used to hot weather throughout the year, the change triggers asthma. As a result, asthma cases in Abu Dhabi tend to increase with a decrease in temperatures which explains the negative correlation between the two variables.
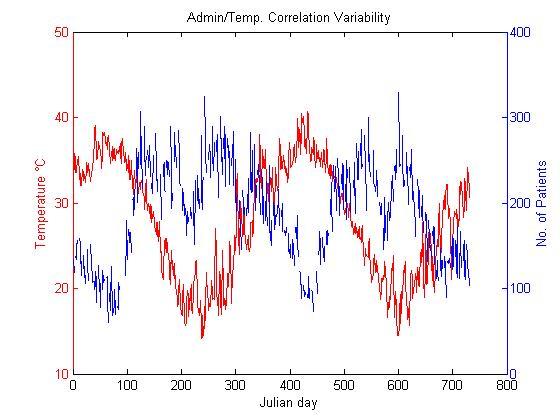
Asthma cases are distributed throughout the year. The number of hospital admissions however seems to be dependent on seasons. The highest temperatures in the city within the year are recorded between June and September. The graph shows clearly that at the time, temperatures as high as 40°C can be achieved. Low cases of asthma admissions are recorded within this duration. The reason behind this is that high temperatures do not create an environment that is conducive to the development of the health condition.
During October, the temperatures within the city begin to drop. The summer season is finally coming to an end. At the time, the number of asthma cases begins to rise gradually. The change can be attributed to the decrease in temperatures. By the start of November, it can be seen from the graph above that the temperatures are very low. The situation persists until March. The temperatures of the area can go to a low of 15°C. At the time, the number of asthma hospital admission cases tends to increase drastically. The numbers remain high until the beginning of April when temperatures within the area begin to increase in anticipation for the beginning of the summer season.
Humidity
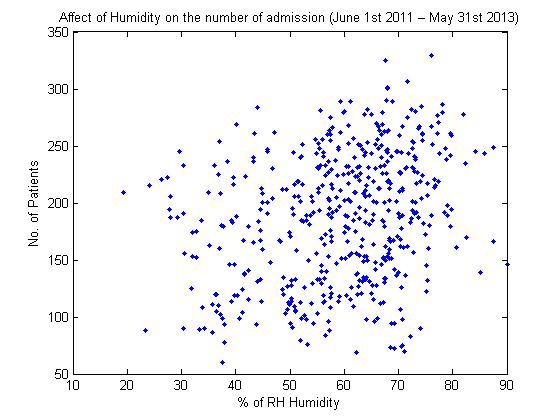
Linear Correlation = 0.2677
P Value = 1.2227e-09 (< 0.05)
There is a positive correlation between the number of asthma admission cases reported in Abu Dhabi and changes in humidity. A change in humidity translates to a change in the number of patients admitted to hospitals in the area for suffering from asthma. The two phenomena are directly related such that when one increases, the other follows suit. The P-value for the correlation between humidity and the number of asthma admission cases in the hospitals situated in Abu Dhabi is 1.2227e-09. The value is lower than the significance level of 0.05. The value indicates that the correlation is statistically significant. One of the main reasons behind this is that air that has high amounts of moisture is heavy. As a result, it is difficult to breathe. The condition is likely to trigger repeat attacks among persons who have already been diagnosed to be suffering from the health condition. Water vapor is also deposited within the respiratory tract resulting in its obstruction. Humid air also provides a favorable condition for the growth of organisms that are known to trigger asthma attacks. Such organisms include fungi and molds.
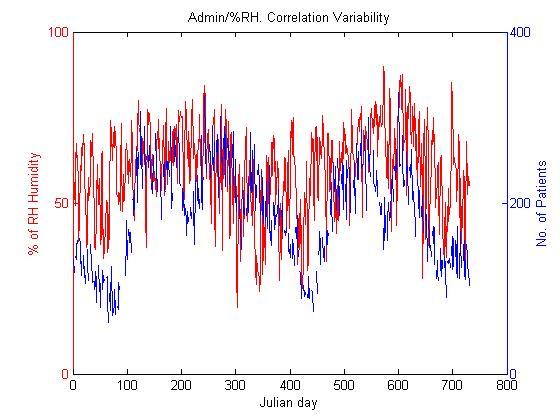
From the figure above, it is evident that there is a significant variation in the percentage of relative humidity throughout the year in Abu Dhabi. The change in this element can be attributed to the variations in seasons within the area. Between June and September, the percentage of relative humidity in the city is usually very low compared to the rest of the year. At the time, the city is experiencing the summer season. There is little or no rainfall recorded within the period. As a result, there is little moisture within the city’s atmosphere. At the time, the air in the city is also hot compared to the winter season. During the time, it has the potential to accommodate more moisture yet little is available in the environment. As a result of low humidity, the number of asthma admissions recorded is low. The situation however changes towards the end of October.
With the onset of winter, humidity levels increase gradually. The increase is attributed to the onset of the winter season. Higher rainfall is recorded at the time between November and March. The water evaporates forming vapor which causes an increase in the percentage of relative humidity within the area. Higher cases of asthma are therefore recorded at the time. The winter season is also characterized by extreme cold. The air cannot accommodate a large number of water molecules causing high humidity levels.
Humidex
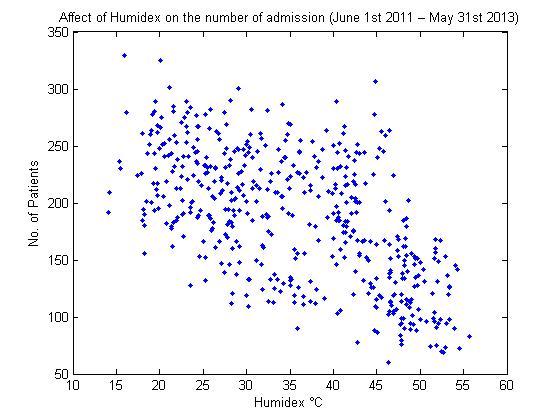
Linear Correlation = – 0.5951
P Value = 3.8660e-49 (< 0.05)
There is a negative correlation between the effects of humidex on the number of asthma admissions recorded across hospitals in Abu Dhabi. In the graph, we can appreciate the fact that an increase in the humidex (°C) did not contribute to an increase in the number of patients who were admitted. The P-value for the correlation between humidex and the number of asthma hospital admission is 3.8660e-49. It indicates that the correlation is statistically significant since it is lesser than 0.05. The reason behind this is that Humidex is viewed as perceived temperatures. Humid heat is perceived as hotter. However, it is not an indication of the actual temperatures of the air. Drier air on the other hand tends to feel cooler. However, this is not the case since more asthma cases are likely to be reported on the humid days, during the winter.
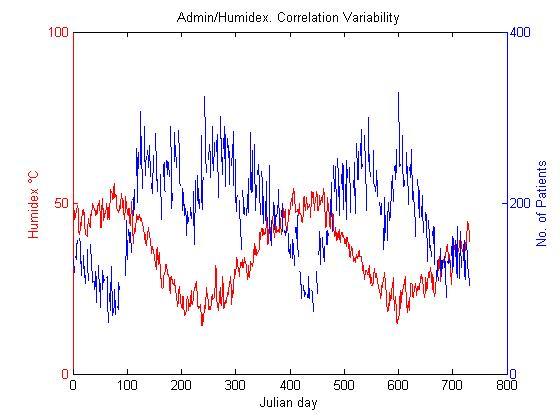
There is a negative correlation between the levels of humidex within Abu Dhabi and the number of asthma cases recorded in the region. However, there is a great relationship between actual temperatures and the levels of humidex recorded in the region. The reason behind this is that the value of humidex tends to be the perceived temperatures about the area’s humidity. The number of patients suffering from asthma increases with a decrease in the levels of humidex. The reason behind this is that warmer temperatures are characterized by lower cases of asthma. Lower humidex levels on the other hand are associated with a higher number of persons admitted in Abu Dhabi hospitals and clinics following the development of asthma. The reason behind this is that in a real sense, the temperatures of the area are lower than the perceived. Cooler temperatures result in a high asthma incidence.
Vegetation Index
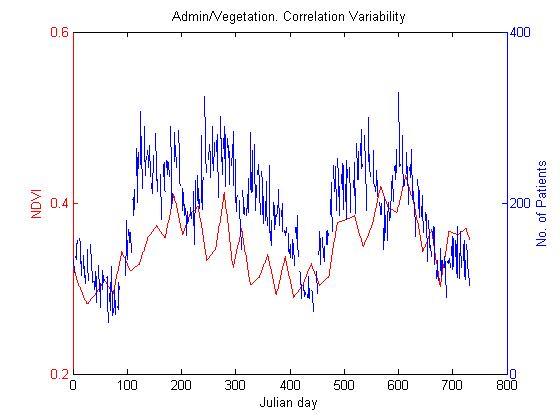
From the graph above, it is evident that the levels of normalized difference vegetation index (NDVI) vary throughout the year. We can also appreciate the correlation that exists between the value of NDVI recorded and the number of patients admitted for suffering from asthma within Abu Dhabi. The highest levels of NDVI are recorded within the winter season, between November and March. At the time, the number of patients suffering from asthma is high. The high number of asthma cases reported at the time can be associated with the production of pollen from the plants at the time. It is important to note that pollen grains are a common allergen known for causing health conditions in children and immune-suppressed persons. During the hotter months of the year, between June and September, the value of NDVI recorded in Abu Dhabi is low. The reason behind this is that most plants are drying up following water shortage and high temperatures. At the time, asthma admissions are low since little pollen is released into the environment from the vegetation.
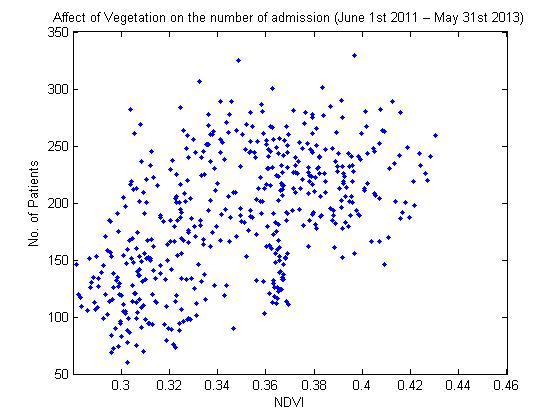
Linear Correlation = 0.5306
P Value = 1.4162e-37 (< 0.05)
There is a moderate correlation between the levels of normalized difference vegetation index (NDVI) and the number of patients suffering from asthma. An increase in NDVI levels was coupled with an increase in the number of patients. The correlation value is statistically significant. The reason behind this is that the P-value for the correlation between NDVI and the number of persons admitted in Abu Dhabi hospitals suffering from asthma is 1.4162e-37 which is lesser than 0.05. The reason behind this is that vegetation is a major source of allergens triggering asthma attacks. A good example of the triggering agents is pollen. The pollen is produced during the flowering season of the plants. At the time, the plants are green. As a result, the vegetation is associated with high NDVI. Lower cases of asthma are reported when the level of NDVI is low. The reason behind this is that most of the plants in Abu Dhabi are drying up. As a result, there is very little green vegetation as depicted by satellites from space used for remote sensing. The drying plants have already released their pollen into the environment. The plants are scheduled to flower and produce the allergen, pollen the following rainy season during the winter.
Air Quality Concentration (PM10, PM2.5, NO2, SO2, H2S, CO, O3)
PM10
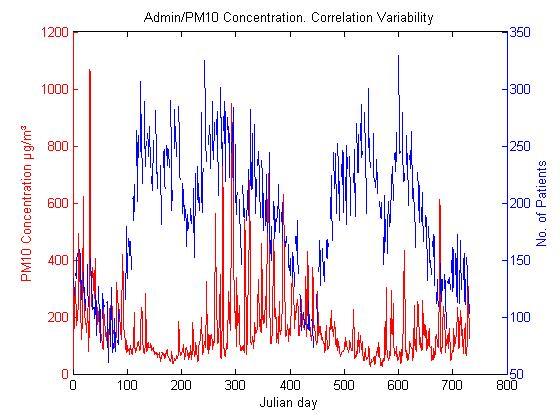
From the figure above, it is evident that there are high concentrations of PM 10 in the Abu Dhabi atmosphere throughout the year. The area has its PM 10 concentration as high as 1050 µg/m3 while that of an average city in the United Kingdom is 20-25 µg/m3. The reason behind this is because the area experiences a lot of desert storms which results in a lot of sand being carried into the city by strong winds. The sandstorms are frequent and occur throughout the year even so their intensities tend to vary with season. Research has shown that the largest compositions of the PM10 particles present in the Abu Dhabi atmosphere are soil particles. The reason behind this can be attributed to the nature of the soil that covers Abu Dhabi. The area is located within a desert. As a result, most of the sand located within the area is sand. It is often loosely packed. The reason behind this is that it is low in soil organic matter that binds the particles together. As a result, it is easily displaced even by winds of the smallest magnitude.
Even though the concentration of PM 10 in Abu Dhabi can be said to be high compared to that of other places across the world, we can observe from the graph above that it varies greatly throughout the year. At sometimes of the year, the concentration goes to a high of 1050 µg/m3 while in others it is as low as 30µg/m3. The reason behind this is that the intensities of the winds tend to increase at certain parts of the year. From the graph, it is evident that the concentration of PM 10 is high during the summer season that spans between June and September. At the time, the number of asthma admissions in Abu Dhabi hospitals is low. On the other hand, during the winter season, the concentration of these particles is lower. However, the number of asthma hospital admissions is at its peak.
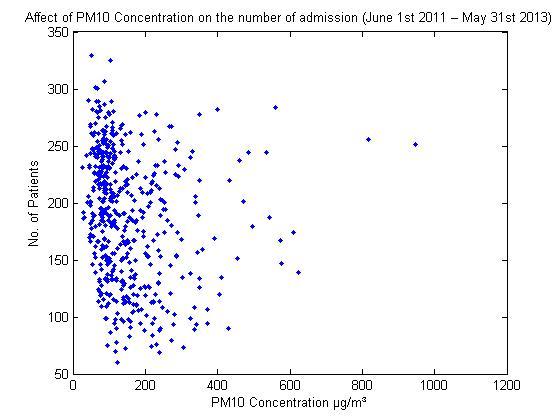
Linear Correlation = – 0.1636
P Value = 2.4226e-04 (< 0.05)
There is a negative correlation between the PM 10 concentration and the number of asthma admission cases within Abu Dhabi. The P-value for the correlation between humidity and the number of asthma admission cases in the hospitals situated in Abu Dhabi is 2.4226e-04. The value is lower than the significance level of 0.05. The value indicates that the correlation is statistically significant. It is however important to note that the correlation value is at – 0.1636 which close to zero. The zero value signifies no correlation. The reason behind this can be said to be that the concentration of PM 10 in Abu Dhabi is high throughout the year. As such, it is difficult to determine the influence the concentration of these particles has on the prevalence of asthma within the city. Also, the particles are large. As such, they get to settle down on the ground at a faster rate following the gravitational pull. In this case, the particles tend to settle easily within minutes rather than remain suspended in the atmosphere for long durations.
PM2.5
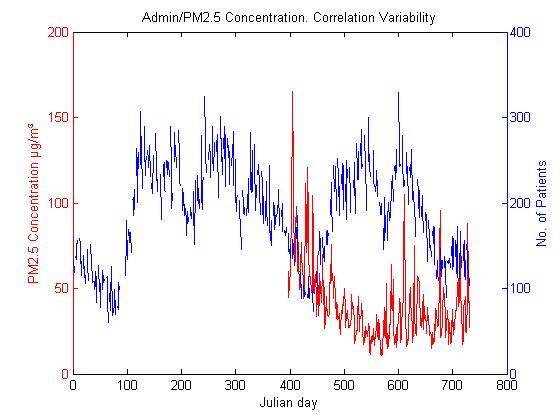
PM 2.5 particles are also a form of particulate matter. They are however of a smaller size compared to those of PM 10. In Abu Dhabi, there is a higher concentration of PM 2.5 molecules compared to other cities across the world. The concentration of these particles also tends to vary throughout the year. They are produced as a result of several processes. In Abu Dhabi, desert storms are also responsible for the high concentration of particles in the atmosphere. They are of a higher concentration during the summer season. At the time, the soils are dry and are loosely packed. When the winds come, they can displace a large proportion of the topsoil in the area. Once they are in the atmosphere, the particles remain there for a longer time than those of PM 10. The reason behind this is that the PM 2.5 particles are smaller and lighter. As a result, the effect of gravitational pull on them is not intense. The concentration of the PM 2.5 particles in the atmosphere during the winter season on the other hand is considerably lower. The reason behind this is that the particles tend to be dissolved in rainwater during the cold season. The soil is also wet at the time. The moisture binds the soil particles together making it difficult for them to be dispersed easily even when violent winds sweep the area.
The concentration of the PM 2.5 particles tends to be high during the summer season. At the time, the number of asthma admissions is low. Although PM2.5 particles have been proven to be a lead cause of respiratory problems, such as asthma, this is usually not the case in Abu Dhabi. The main reason behind this is that other factors, such as humidity, temperatures, and humidex play a greater role in influencing the prevalence of the health condition. During the cold season, the concentration of the particles is low yet the number of asthma cases reported is high. The reason behind this is the temperatures at the time are low and the humidity high. The two conditions translate to higher prevalence rates of the health condition.
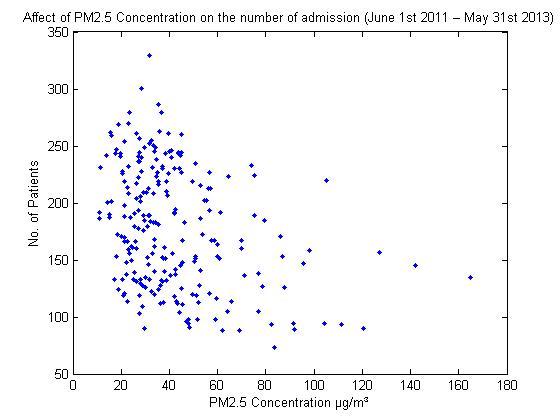
Linear Correlation = – 0.3366
P Value = 1.6893e-07 (< 0.05)
There is a negative correlation between the concentration of PM 2.5 and the number of persons suffering from asthma in Abu Dhabi. In this case, we cannot establish that an increase in PM 2.5 concentration automatically translates to an increase in the number of hospital admissions. On the contrary, it is associated with a decrease in the number of asthma admissions reported across the city. We can also establish that the correlation value is statistically significant. The reason behind this is that the P-value for the correlation between PM2.5 concentration and the number of persons admitted in Abu Dhabi hospitals suffering from asthma is 1.6893e-07 which is lesser than 0.05. Research has proven that the increase in the concentration of PM2.5 should result in a rise in the number of asthma hospital admissions. However, this is not the case observed in Abu Dhabi. The main reason behind this is that temperature and humidity which are the major environmental factors affecting the prevalence of the health condition are not favorable. The decrease in the concentration of the particles during winter on the other hand is associated with an increase in the number of asthma admissions.
NO2
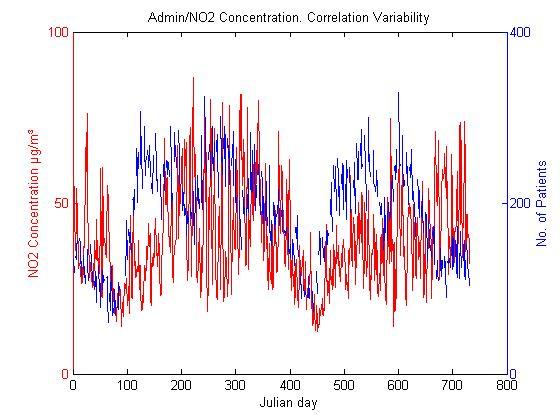
Nitrogen dioxide in Abu Dhabi is produced throughout the year. The gas is considered to be one of the triggering agents for asthma attacks. The reason behind this is that the gas is produced from a wide range of sources daily. All households in the city are likely to produce small quantities of gas every day. Such sources include cooking gas. Others include industrial processes. It is noted that smoke produced from the burning of fuelwood and kerosene is also a source of the gas. Although the gas is produced all year round, its concentration tends to vary from time to time. From the graph above, it is evident that the concentration of nitrogen dioxide is highest during the summer season. It is considered to be one of the most common greenhouse gasses.
The high concentration of the gas during summer is attributed to the fact that there is little green vegetation cover to absorb it. As a result, its concentration continues to increase in the atmosphere. The number of asthma admissions within the city, therefore, increase during the summer season. On the other hand, the concentration of the gas during the winter season is low. The reason behind this is that green vegetation is abundant at the time. As a result, it absorbs the gas from the atmosphere at the same time reducing the number of asthma admissions recorded.
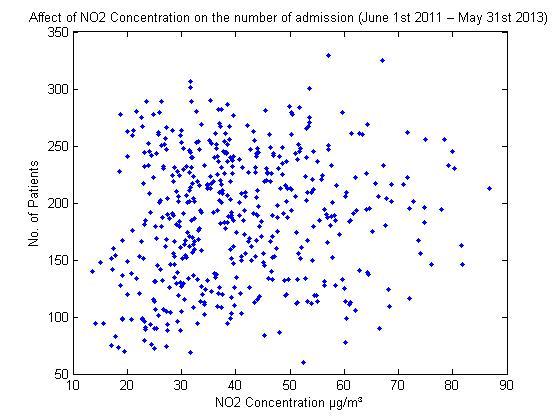
Linear Correlation = 0.1252
P Value = 0.0051 (< 0.05)
There is a positive correlation between the concentration of nitrogen dioxide gas and the number of asthma admission cases reported in Abu Dhabi. The increase in the concentration of the gas contributes to an increase in the number of asthma admission cases within the city of Abu Dhabi. The correlation value is statistically significant. The reason behind this is that the P-value for the correlation between the concentration of NO2 and the number of persons admitted in Abu Dhabi hospitals suffering from asthma is 0.0051. The value is lesser than 0.05 which is the significance level. The gas is mainly known to cause respiratory obstruction among children. In most households, the concentration of the gas is higher indoors than outdoors. The reason behind this is that it is produced by a large number of household appliances, such as gas cookers, stoves, and fireplaces. The concentration of the gas outside households is also fairly high. The city is the region’s capital. A lot of commercial activities take place there daily. They include manufacturing and high traffic in the cities road system. A decrease in the concentration of the gas leads to a reduction in the number of asthma admission throughout the city.
SO2
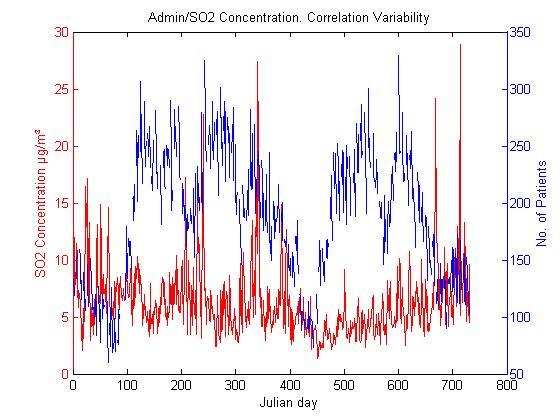
From the graph above, it is evident that sulfur dioxide gas is abundant throughout the year in Abu Dhabi. However, the concentration of the gas varies throughout the year. The changes in the concentration of the gas are irregular. No particular trend can be identified. It varies throughout the year. The concentration is at times as high as 28µg/m3. The lowest recorded in Abu Dhabi is 2µg/m3. The number of asthma admission also varies throughout the year. From the graph, we can be in a position to establish that the change in sulfur dioxide concentration does not directly affect the number of asthma cases. The number of patients has been noted to change throughout the year inconsistently with highs and lows of 27 and 2 respectively being recorded.
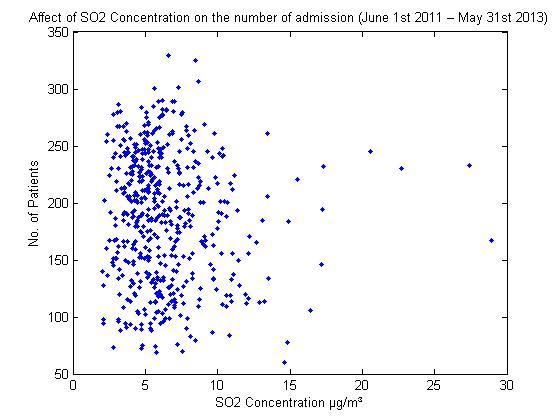
Linear Correlation = – 0.0775
P Value = 0.0837 (> 0.05)
The graph above shows us that there is a negative correlation between the concentrations of sulfur dioxide gas and the number of asthma admissions in Abu Dhabi. However, there is no statistical significance in the correlation between the two variables. The reason behind this is that the P- the value of the correlation between the two variables is 0.0051. The value is higher than 0.05 which marks the significant level. The reason behind this is that changes in gas concentration have an unknown effect on the number of patients. The main reason behind this is that the gas exists naturally. It is mainly released from the earth’s crust through activities such as volcanic action and oil extraction. In Abu Dhabi, numerous oil extraction activities contribute to the levels of gas being high throughout the year. Only the sharp increases in the concentration of the gas in the cities atmosphere contribute to rising cases of asthma admissions.
H2S
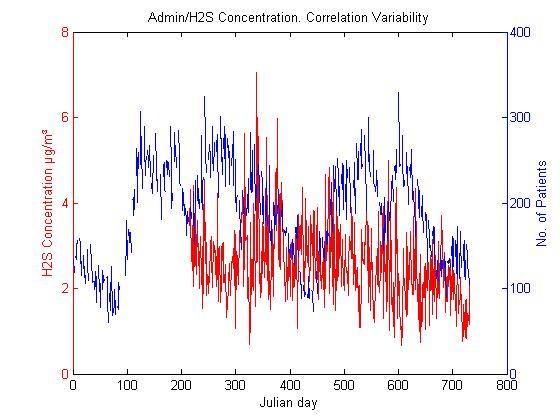
The concentration of hydrogen sulfide gas is high throughout the year. The main reason behind this is that gas is produced naturally within the environment. Major sources of the gas in the environment include bacterial activities on organic matter, volcanic action, and natural gas. All these sources are abundant throughout Abu Dhabi. The concentration of the gas has however been noted to vary within the region. The changes in concentration can be attributed to changes in the production levels of natural gas in the region. The reason behind this is that the region is one of the major sources of natural gas across the world. The high levels of hydrogen sulfide are therefore mainly attributed to the extraction of natural gas. The changes in the concentration of Hydrogen Sulfide gas in Abu Dhabi are inconsistent. They cannot be attributed to any season. The only logical explanation would be a variation in the release of the gas from its natural sources. The number of asthma admission cases recorded also varies greatly throughout the year. No clear relationship can be established between the change in the concentration of the gas and the number of patients.
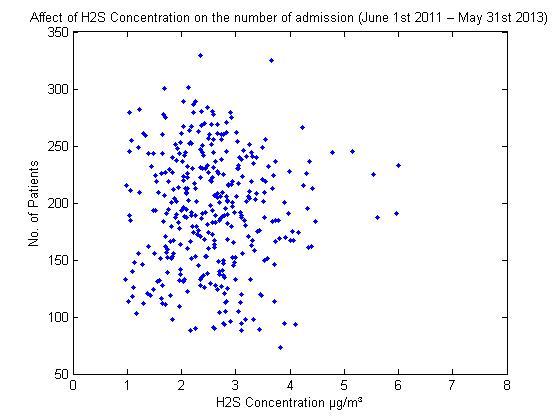
Linear Correlation = -6.9101e-04
P Value = 0.9896 (> 0.05)
There is a negative correlation between the concentration of hydrogen sulfide gas and the number of asthma admission cases recorded in Abu Dhabi throughout the year. It is also evident that the correlation between the two variables is not statistically significant. The reason behind this is that the P-value is at 0.9896 which is much higher than 0.5 which marks the significance level. There are some possible reasons for the trend. To begin with, the gas is abundant in the environment. Only extremely high concentrations would result in an n increase in the number of asthma admission cases in Abu Dhabi. The gas is also produced by bacteria residing inside the human lungs. As a result, it is to some extent considered to be a biological gas rather than a harmful one.
CO
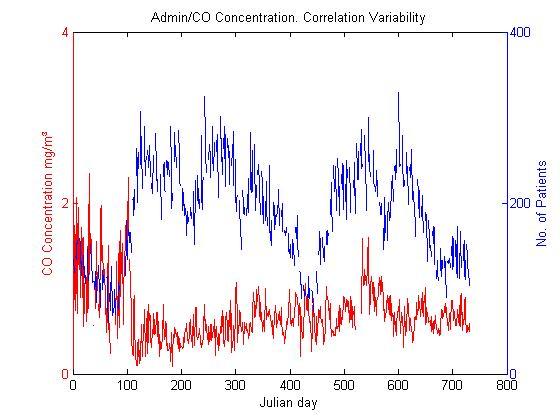
The concentration of carbon monoxide gas in Abu Dhabi is high throughout the year. The reason behind this is that its sources are widespread. The gas results from the incomplete combustion of carbon-containing substances. Industries and motor vehicles are the main sources of gas in any urban setting. With Abu Dhabi being the region’s capital, the volume of carbon monoxide produced is high. There are variations in the concentration of the gas in the region. The changes are dependent on the sources rather than the seasons. The number of asthma admissions in Abu Dhabi also tends to vary throughout the year. When the concentration of the gas in the region is high, a lower number of asthma cases are reported. The graph also shows that lower concentrations of gas are associated with a high number of patients.
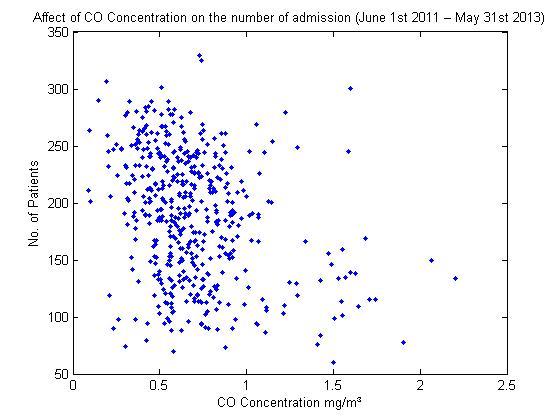
Linear Correlation = -0.3205
P Value = 7.4391e-13 (< 0.05)
There is a negative correlation between the concentration of carbon monoxide and the number of asthma admission cases recorded in Abu Dhabi. The correlation value is statistically significant. The reason behind this is that the P-value for the correlation between NDVI and the number of persons admitted in Abu Dhabi hospitals suffering from asthma is 7.4391e-13 which is lesser than 0.05, the significance level. There is no doubt that a high concentration of gas triggers asthma attacks. However, this is not the case reported in Abu Dhabi. The most reasonable explanation behind this is that several environmental factors have a greater influence on the incidence of asthma in the region. For example, humidity and temperature are viewed to play a greater role in the incidence of health conditions.
O3
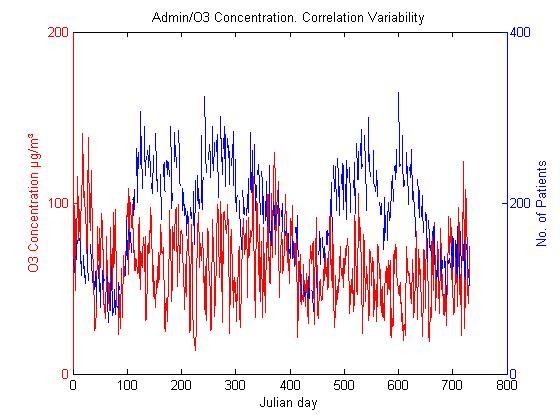
The concentration of ozone gas in Abu Dhabi is consistent throughout the year. However, there exist slight variations. The gas exists naturally in the upper atmosphere. However, it is highly unstable and is rapidly converted to oxygen. In Abu Dhabi, it is impossible to determine the trends associated with the concentration of the gas. It varies continuously throughout the year. The numbers of asthma admissions also vary. It is however difficult to determine the effect of the concentration of ozone on the prevalence of asthma.
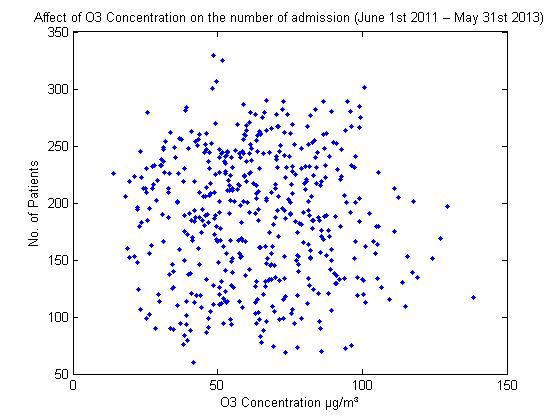
Linear Correlation = – 0.0235
P Value = 0.6010 (> 0.05)
There is a negative correlation between the concentration of ozone and the number of asthma admission cases in the region. It is also evident that the correlation between the two variables is not statistically significant. The reason behind this is that the P-value is at 0.6010. The value is higher than 0.5 which marks the significance level. The reason behind this is that research has shown that gas is associated with high cases of asthma. However, other factors, such as humidex, humidity, and temperatures play a greater role in determining the prevalence of the health condition. Ozone is also a rare gas. It is difficult to find gas in high concentrations.
Conclusion
From the analysis of the results provided in this section, it is clear that there is a significant relationship between human health and the environment. To this end, the environment can promote or endanger the wellbeing of a population. In Abu Dhabi, the environment has promoted the spread of respiratory complications. One of the common conditions includes asthma. Some environmental factors promote the onset of the condition. They include humidity, temperature, and humidex. Knowledge regarding interactions between health and environment is important as it helps authorities anticipate health issues that may arise. As such, they can plan for the conditions in advance.
Bibliography
H. Frumkin, Environmental Health: From Global to Local. San Francisco, CA, USA: Jossey-Bass, 2005.
J. MacDonald and S. Farah, “Environmental risks to public health in the United Arab Emirates: A quantitative assessment and strategic plan,” Environ. Health Perspect., vol. 120, no. 2, pp. 681–686, 2012.
C. Davidson, The United Arab Emirates: A Study in Survival. Boulder, Colo: Lynne Rienner Publishers, 2005.
S. Barnett and T. Nurmagambetov, “Costs of asthma in the United States: 2002-2007,” J. Allergy Clin. Immunol., vol. 127, no. 1, pp. 145-152, 2011.
C. Pope, “Respiratory hospital admissions associated with PM10 pollution in Utah, Salt Lake, and Cache Valleys,” Arch. of Environ. Health, vol. 46, no. 3, pp. 90-97, 2006.
M. Kazim, “Assessments of primary energy consumption and its environmental consequences in the United Arab Emirates,” Ren. and Sust. Ener. Rev., vol. 11, no. 2, pp. 426-446, 2007.
D. Ott and T. Peters, “A shelter to protect a passive sampler for coarse particulate matter, PM10-2.5,” Aero. Sci. and Tech., vol. 42, no. 7, pp. 299-309, 2008.
J. Heinrich, “Air pollution, asthma and allergies in children,” Occup. and Environ. Med., vol. 67, no. 3, pp. 290-291, 2010.
A. Pickett and M. Bell, “Assessment of indoor air pollution in homes with infants,” Intl. J. of Environ. Res. and Pub. Health, vol. 8, no. 2, pp. 4502-4520, 2011.
D. Nash and D. Leith, “Ultrafine particle sampling with the UNC passive aerosol sampler,” Aero. Sci. and Tech., vol. 44, no. 1, pp. 1059-1064, 2010.
W. Elshorbagy and M. Abdulkarim, “Chlorination byproducts in drinking water produced from thermal desalination in United Arab Emirates,” Environ. Monitoring and Assessment, vol. 123, no. 3, pp. 313-331, 2006.