Background
This report focuses on the analysis of the financial performance of Highlands Hospital located in Oakland, CA. Evaluation of the financial strength is crucial for healthcare managers, as it helps to understand if the hospital’s financial performance is in line with the goals and KPIs. First, this report provides background information about the hospital, including its size, mission, goals, and objectives. Second, the report analyzes the hospital’s balance sheet, income statement, and summary of financial and utilization. Third, the report focuses on patient population the hospital serves. Fourth, hospital’s financial ratios are calculated and compared to the national averages. Finally, projections about the hospital’s financial performance are made. The report is concluded with a summary of findings.
Hospital Information
Highlands Hospital is known as is Alameda Health System’s flagship, as it is the largest hospital in the system with the widest specter of services (Alameda Health System n.d.). Almeda Health System’ mission is “Caring, Healing, Teaching, Serving All” (Alameda Health System 2021). The company’s vision it to be “recognized as a world-class patient and family centered system of care that promotes wellness, eliminates disparities and optimizes the health of our diverse communities” (Alameda Health System 2021). Alameda Health System’s goals include improve community health, serve all, train, teach and lead healthcare professionals, enable people to care for themselves, and build a strong community (Alameda Health System 2021). Highland Hospital supports Alameda Health System’s goals, objectives, mission, and vision.
The hospital is classified as a general acute care hospital that provides a large variety of services included but not limited to adult immunology clinic, cardiology, pediatrics, emergency care, orthopedics, respiratory care, surgery, and wound care (Alameda Health System n.d.). The hospital has 236 inpatient beds and provides state-of-the-art primary, specialty, and multi-specialty care (Alameda Health System n.d.). Its new Acute Care Tower is host to topflight maternal child services and other advanced care (Alameda Health System n.d.). While the hospital is known for its highly qualified staff, Alameda Health System does not disclose the number of the employees in the hospital. It is a public hospital run by a Governing board consisting of nine members.
Yearly Trends
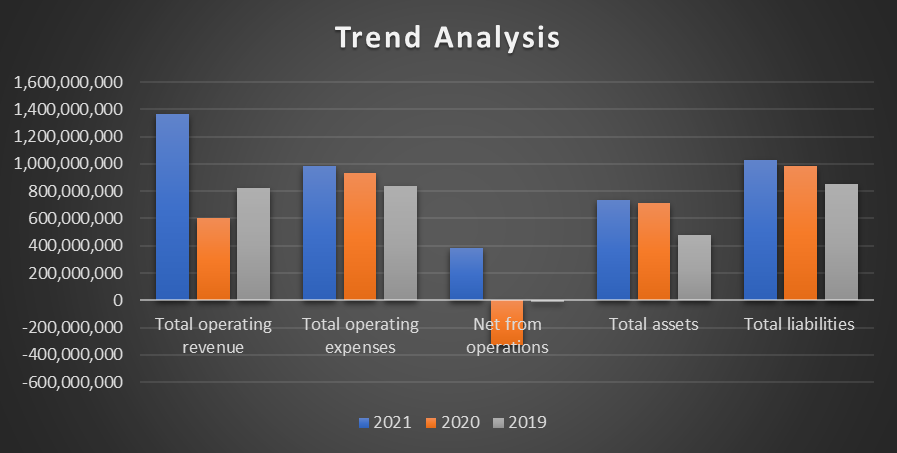
Highland Hospital is a safety net hospital, which had a varying financial performance during the past three years. In particular, the hospital experienced a significant drop in financial performance in 2020, which was associated with the pandemic (HCAI 2021). In 2020, despite the increased utilization of the hospital services, its liabilities kept growing with significant negative net income from operations (HCAI 2021). The three-year trends in terms of financial performance are summarized in Figure 1 below.

Figure 1 above demonstrates that the hospital experienced a significant rise n operating revenue in 2021 in comparison with previous years. In particular, its total revenue in 2021 was $1,362,787,341 in comparison with 2020’s $603,370,321 and 2019’s 822,144,793. At the same time, hospital’s operating expenses were growing steadily from $837,631,081 in 2019 to $981,368,761 in 2021. As a result, in 2021, the hospital’s net from operations was positive for the first time in three years, climbing from -$329,515,575 in 2020 to $381,418,580 in 2021. As for the balance sheet, it should be noted that the hospital’s equity was negative during the past three years, as total assets were lower than total liabilities. In 2019, total assets were $481,912,543 in comparison with the liabilities of $855,982,648, while, 2021, the total assets were $734,963,322 in comparison with $1,030,795,658 in total liabilities. The analysis demonstrates that the hospital was able to improve its profitability in 2021, while the situation with shareholder equity remained troubling.
Table 1 below demonstrates the cost per unit results to see which of the services had positive and negative profitability.
Table 1. Cost per unit results
Table 1 above demonstrates that, in 2020, the majority of service had a negative profit per unit. The problem may have been associated with the fact that Highland Hospital is a safety net hospital, and many people were not able to pay for the services due to the financial crisis associated with the pandemic. However, the situation improved significantly in 2021, as the majority of provided services were profitable. However, there two significant concerns that should be mentioned. First, sub-acute care cost the company -$10,522.26 per unit, which was almost 10 times higher than the profitability of service of -$1,051.69per unit in 2020. Moreover, growing cost per unit for partial psychiatric hospitalization is also a matter of concern. However, in general, the hospital demonstrated positive trends in profitability per unit in 2021 in comparison with previous years.
Patient Population
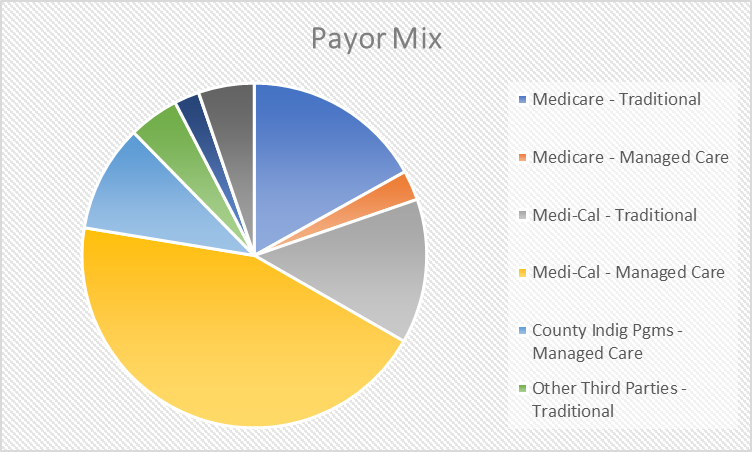
In 2021, the hospital served over 300,000 patients that had different ways of paying for the services. In particular, the payors can be subdivided into nine types, including Medicare – traditional, Medicare – managed care, Medi-Cal – traditional, Medi-Cal – managed care, county indigenous programs – managed care, other third parties – traditional, other third parties – managed care, other indigent, and other payors. The most of the patients used Medi-Cal to pay for the service, with 41,575 patients (13.6%) using Medi-Cal – traditional and 135,710 (44.3%) using Medi-Cal – managed care. Medicare was the second most popular method of paying for the hospital’s services with 51,828 (16.9%) using Medicare – traditional and 8,577 (2.8%) using Medicaid – managed care. County indigenous programs were also a significant part of payor mix, with 10.1% paying for services using these programs. Around 7% of all patients paid for the services using other third parties, and 5.2% were attributed to other payors. Figure 2 below visualizes the payor mix of the hospital.

The payor mix demonstrates than more than half of the patient population are Medicaid (Medi-Cal) patients. If we add the patients that utilize country indigenous programs, more than three thirds of the population that the hospital serves are patients with limited income. In other words, Highland Hospital has a poor payor mix, which explains the financial performance of the hospital. However, despite the poor patient mix, the hospital was able to stay profitable in 2021. The analysis of the payor mix and the profitability information revealed that outpatient services were the most profitable. At the same time, the most profitable procedures were associated with Clinical Laboratory Services ($91,893,811 in net profits), Computed Tomographic Scanner ($72,076,304 in net profits), and Medical/Surgical Acute Care ($46,161,592 in net profits).
Comparative Analysis
This section focuses on analysis of financial ratios of Highland Hospital. In particular, the section compares the hospital’s liquidity, profitability, financial gearing, inpatient, outpatient, and growth. The median values among US hospitals in 2018 were used as benchmark values. The results are summarized in Table 2 below.
Table 2. Comparative analysis
The analysis demonstrates that the hospital’s profitability was high in comparison with the benchmark. In particular, the hospital’s total margin was 28%, which was significantly above the benchmark of 1.61%. High margin was achieved due to tax benefits. However, cashflow margin was similar to that of the benchmark. Return on equity was negative, as the company’s net assets (equity) were negative. In summary, Highland’s hospital profitability was very high in 2021 in comparison with the benchmark values.
The hospital had a uncertain performance in terms of liquidity. On the one hand, the hospital’s current ratio was very low with 0.5 against the benchmark of 2.54. At the same time, the hospital had cash for 84 days, while the benchmark value was 75 days. The financial gearing ratios demonstrated that the hospitals liabilities were higher its assets, which led to negative equity financing ratio. At the same time, the hospital did not have any long-term debt, which implies that the most part of the hospital’s debt was associated with current liabilities.
The analysis also revealed that the hospital relied on revenues from inpatients rather than the revenue from outpatients. In particular, 60.38% from revenues in the Highland Hospital came from inpatients, while the benchmark was 37.13%. At the same time, 39.62% of revenues came from outpatients in caparison with the benchmark of 79.40%.
As for growth ratios, the results of the analysis demonstrated high growth of revenues and relatively low growth of expenses in comparison with the benchmark values. In particular, the hospital’s revenues grew in 2021 by 125.86% in comparison with 2020, while the benchmark value was 3.90%. At the same time, the hospital’s expenses grew only by 5.2% in 2021 in comparison with 2020, which was significantly lower than the benchmark value. In summary, Highland Hospital’s growth was significantly higher than the benchmark. However, the growth may be associated with the economic rebound after the pandemic.
Projections
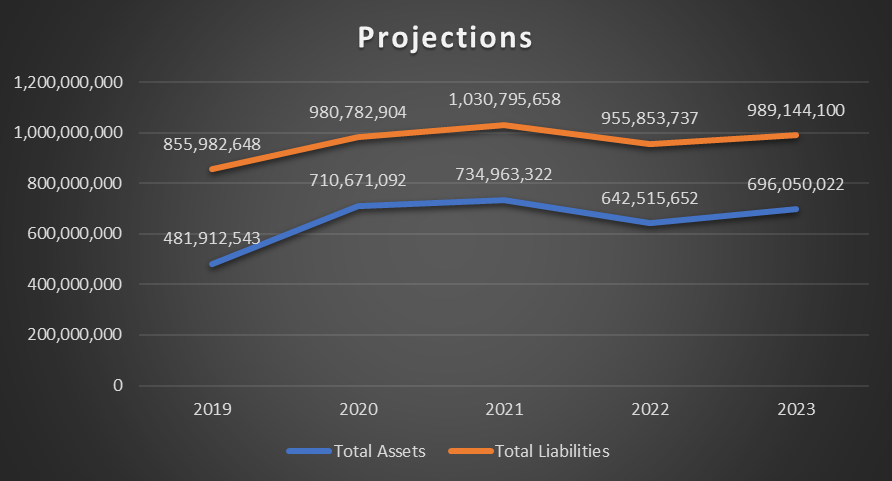
Moving average was used to make projections about current assets and current liabilities. Figure 3 below demonstrates the past and projected values.

The results demonstrate that, in 2022, total assets are expected to be around $642.5 million, while total liabilities will decrease to $955.9 million. In 2023, total liabilities are expected to be $989.1 million, while total assets are expected to be $696 million.
If patient Medicare and Medicaid population increases by 5% and other third-party payors decrease by 10%, the hospital’s revenues are expected to increase by $43 million. The calculations are provided in Table 3 below.
Table 3. Calculations of changes in patient population.
Thus, if projected changes occur in the population, total revenues will be $1,197 million, if the utilization rates remain the same.
References
Alameda Health System. n.d. “Highland Hospital.” AlamedaHealthSystem. Web.
Alameda Health System. 2021. “Audit results 2020.” AlamedaHealthSystem. Web.
California Department of Health Care Access and Information. 2023. Financial & Utilization Reports. OSHPD. Web.