Executive Summary
The aim of this report is to analyse the financial position of Hikma Pharmaceutical PLC and GlaxoSmithKline PLC. The report will examine the firm’s daily operating activities and compares its performance with the closest competitor, the GlaxoSmithKline PLC. First, the report provides the industry overview and the background of both firms. Second, the report provides the segmented analysis in terms of products and geographical regions in order to better understand the performance of both firms.
The report will then provide a financial ratio analysis of both firms in order to determine with certainty the best firm for investments The economic pressures including global crisis, price rise and increased rate of inflation and the general instability in the Eurozone affect both firms. The social, political and economic factors have a direct impact on the operating activities of both firms as well as their long-term growth decision plan. Finally After a careful examination of the financial ratios of both firms, Hikma Pharmaceutical PLC has come out to be the best firm to invest in compared with GlaxoSmithKline PLC. The reasons for such a conclusion can be seen in the report below.
Introduction
Industry overview
The pharmaceutical industry is one of the most competitive with small and large firms operating within the global marketplace. Besides, the industry is most affected by the external factors including the level of economic growth (Yahoo Finance, 2014). Despite the continuing macro-economic and global challenges, the need for medicines and healthcare remains a priority to the majority of the global citizens. Despite the global economic growth recorded in 2013, the industry is still being affected by the fallout from the international financial crisis that began in 2008. The current industry growth of 3% is slightly lower compared to the projected growth of 3.5% and 3.1% growth the industry recorded just before the financial crisis.
Within the Eurozone, which forms the largest market, the economy has remained weak over the years with an annual growth rate of 1.9%. The industry is yet to respond to the growth in the economy as predicted (Yahoo Finance, 2014). However, according to the industry information company (IMS), the sales in the pharmaceutical market have increased slightly from £499 billion in September, 2012 to £511 in September, 2013. The growth was primarily driven by the emerging markets including China and Asia Pacific regions, which recorded over 10% sales growth. The total sales from the Asia pacific were 22% up in 2013 financial year. The Eurozone sales remained unchanged while the North American sales remained at £219 billion representing 43% of the total global pharmaceuticals market.
The top therapeutic pharmaceutical categories remained unchanged over the period in terms of positioning. The Institute for Healthcare Informatics (IMS) predicted that the annual sales for prescription medicine will grow slight by 1.4% in the coming financial year majorly from the developed countries including Eurozone, North American and Japan. In emerging markets, the growth is expected to increase by over 10% in the next two years. From the industry trends it is clear that the firms should be focusing on the emerging markets where the markets are still growing.
Overview Hikma Pharmaceuticals
Hikma Pharmaceuticals is one of the largest pharmaceutical firms based in London. Hikma Pharmaceuticals deals in both branded and non-branded generic pharmaceutical products. Founded in Jordan, the firm is also involved in the production and exportation of in-licensed pharmaceuticals (Hikma Pharmaceuticals, 2013). The firm is among the top listed companies on the London Stock Exchange (LSE).

The firm is the largest among the Pharmaceutical firms in the MENA region. Hikma Pharmaceuticals market its products mainly in Europe, Middle East and USA. However, the firm targets other markets including sub-Saharan Africa and the Far East. The firm has seen the continuous growth since its listing in the LSE (Hikma Pharmaceuticals, 2013). In the last financial period, the firm recorded over 23% growth in revenue with an expanded sales and product coverage. Besides, the firm is boasting of over $1365 million in revenue with over $413 billion in operating income (Hikma Pharmaceuticals, 2013). Currently, the firm is having over 6000 employees spread across all its operating firms worldwide.

The firm has expanded rapidly after its listing in the LSE in 2005. The firm’s expansion strategy includes acquisitions of similar firms in the industry within the target market. The recent acquisitions range from the Instituto Biochimico Pavese Pharma an Italian firm to Multi-Source Injectables a US firm (Hikma Pharmaceuticals, 2013). The largest acquisition is the takeover of Baxter Healthcare Corporations, one of the largest US generic injectables firm. In terms of products, the firm’s known brands include Amoclan, Prograf and Suprax as well as other brands, which are sold in over 50 countries mainly in Europe, Middle East and US.

GlaxoSmithKline overview

GlaxoSmithKline (GSK) is a multinational pharmaceutical firm that researches and develops a variety of innovative pharmaceutical products based on three categories that include pharmaceuticals, vaccines and consumer healthcare (Glaxosmithkline, 2013). GlaxoSmithKline is operating over 86 manufacturing firms in 36 countries and have registered its presence in over 150 markets. The firm has recorded an increased profit growth of 1% from the last financial period amounting to $26.5 billion.

The pharmaceuticals business develops and manufactures a wide variety of medicines applied in the treatments of broad range of acute and chronic diseases. The firm deals in large assortment of medicinal products in which the majority the firm has exclusive rights. The firm also manufactures a wide variety of both paediatric and adult vaccines (Glaxosmithkline, 2013). Moreover, the firm develops a wide variety of innovative consumer healthcare products. Among the known brands are categorised into four main portfolios including total wellness, oral care as well as nutrition and skin health. Such brands include Panadol, Sensodyne and Horlicks.

Segmentation analysis
The segmentation analysis will tend to analyse the contribution of each segments contributions on the firms, general sales growth. The firms are segmented in terms of products being offered and the regions.
Product contribution towards sales
Hikma product portfolio is divided into Branded, Injectables and the Generic. Each group of the products is sold differently and contributes towards the overall sales margins and revenue. In the current financial period the revenue for the generic products increased by over 158% contributing to about 41% of the total sales growth. The general and adjusted operating margin of the generic products increased contributing to 15% of the overall growth in the operating margin of the firm.
The global injectables market is expected to benefit from the key drivers of the generic growth and patent expiries of several highly valued of injectable products. The revenue growth for the global injectables market was 14%. The injectables amounted to £536 million in the 2013 financial year up from £470 million in 2012. The injectables performances according to the region is indicated in the table below
The injectable gross profit increased by 29% while the corresponding margin grew significantly by over 52.6%. The operating profit of the injectables increased by over 34% while the corresponding margin increased by 26.2%. The overall contribution to the sales margin was over 51%
The branded products’ revenue increased by 5% in 2013 equivalent to £554 million compared with £529 million in 2012. The branded revenue contribution to the total sales revenue of 8% indicate a significant performances across the key markets

GlaxoSmithKline categorises its products into pharmaceuticals vaccines and consumer health. Under each category are a number of products that contributes individually to the overall sales of the firm. In the last financial period the pharmaceuticals contributed over 67% of the total sales turnover amounting to £17.9 billion while vaccines contributed 13% of the total sales turnover equivalent of £3.4 billion. The consumer health products contributed overall 20% in the total sales turnover amounting to over £5.2 billion turnover.
Hikma and GlaxoSmithKline financial analysis
Growth Ratios
The growth ratios of Hikma have indicated positive improvements over the last two financial years under considerations. The sales grew by over 23% in 2013 financial year up from £1109 billion in 2012 to £1365 billion in 2013 (Hikma Pharmaceuticals, 2013). The growth has been mainly driven by increased sales especially on the new products that were introduced into the market. The increased growth in sales has ensured a tremendous expansion in other growth ratios.
The gross profit grew by over 51% in the 2013 financial period compared with the previous financial year. Similarly, the operating profits grew by over 110% in the same financial period compared with the previous financial year (Hikma Pharmaceuticals, 2013). The growths in the gross and operating profits are mainly driven by reduced cost of sales. The net profit also recorded a similar growth in the same period compared with the previous financial year. In fact, the net profit grew by over 101% and mainly driven by increased sales and reduced cost of sales as well as the general expenses (Li & Li, 2006).
However, compared with GSK, the slim growth recorded in GSK are mainly due to increased cost of operations. The GSK sales growth increased by just over 0.28% primary due to the increased cost of sales. The cost of sales in the 2013 financial period was 34.4% of the total sales compared with 30.0% in 2012. The growth in the cost of sales negatively affected the sales growth. The decreased sales also have a negative effect on the growth of the profitability ratios.
In fact, the gross and operating profits recorded negative growths in the current financial period compared with the previous periods. The gross profits grew by -1.78% in the current period. The operating profit was hard hit by the increasing cost of operations recording a negative growth of 3.73% (Glaxosmithkline, 2013). Nevertheless, the decrease in the sales and general expenses and the recorded gains in some of the segments caused an increase in the net profit growth. The net profit grew by over 20% in the current period compared with the previous period.
Even though GSK indicates stability and the capability of countering the external shocks in the economy, it did not perform well in the last financial period (Rajan & Zingales, 2005). On the other hand, the Hikmas’ young entrepreneurial attributes as well as strategies contributed hugely towards its sales growth. The increased sales enabled the firm to weather economic shocks such as the rising inflation as well as the economic cyclical within the European Union (Glaxosmithkline, 2013).
Profitability Ratios
Hikma pharmaceutical has also experienced unprecedented increase in the profitability margins from the last financial period to the current period. The gross profit margin of the firm has risen by over 55% in the current period compared with the 45% recorded in the previous financial year (Hikma Pharmaceuticals, 2013). Similarly, the operating profit margin has improved by over 10% from the 15.06% in 2012 to 26.74% in 2013.
The reduced cost of operations in the major subsidiaries as well as improvement in the sales turnover in the injectables group of products is the major cause of the increases in the margins. The new acquisitions and expansion into the new markets resulted into increased sales (Ross, Westerfield & Jaffe, 2010). Besides, the consolidation of the operations o the firm also reduced resulted in the reduction of the cost of sales. Similar improvements are also observable in the net profit margins.
The improvements in the return on equity and the returns on the capital employed indicate that the firm is generating enough returns on the shareholders’ investments (Stulz, 2010). The returns on the capital employed and on equity increased by almost similar margins from the last financial period (Hikma Pharmaceuticals, 2013). The returns on equity increased from 12.62% in 2012 to 20.89% in 2013. Similarly, the returns on capital employed also improved from 10.82% in 2012 financial year to 22.98% in 2013.
Comparing the margins with GlaxoSmithKline PLC, the gross margins of GlaxoSmithKline is high compared with Hikma. However, GlaxoSmithKline indicates slight reductions in its gross and operating margins from the previous financial period. The firm’s gross profit margin reduced from 73.1% in 2012 to 71.52% in the following financial period. Similarly, the operating profit margin decreased from 27.63% in 2012 financial year to 26.52% in 2013 accounting period (Glaxosmithkline, 2013). The economic tantrums in the most of the operating markets including increased global inflation rates have caused the increases in the operation costs. However, the firm recorded improvements in the net profit margin.
The mixed results are also indicated in the returns on investments and capital employed. While the returns on equity indicate a slight increase, the returns on capital employed reduced slightly. However, the firm is still within the scope of generating enough returns for the investments (Glaxosmithkline, 2013). Both the returns on capital employed and equity are higher compared with Hikma. Nevertheless, the changes in the profit margins are less compared with that of Hikma
Efficiency Ratios
The efficiency ratios indicate the rate at which the firm turns its assets into sales (Weetman, 2010). The improvements in the efficiency ratios of Hikma indicate that the firm is very efficient in turning its assets into sales the asset turnover ratio of Hikma improved from 0.64 in 2012 to 0.71 in 2013 financial years (Hikma Pharmaceuticals, 2013). Similar improvements is also indicated in the fixed asset turnover, which improved slightly from 1.17 in 2012 financial period to 1.32 in the 2013 financial period. Even though the improvements were positive, the indication is that the firm was not efficient enough in turning its fixed assets into sales.
This also indicated in the slight improvements the firm takes to turn its inventories into sales. The number of days the firm take to turn the inventories into sales improved by 3 days (Hikma Pharmaceuticals, 2013). However, the number of days the firm take to offset its creditors indicated by the creditors payment period improved. The indication is that the firm holds enough liquidity to offset its short-term liabilities. In other words, the firm is having an effective credit policy.
On the similar note, GlaxoSmithKline’s efficiency ratios indicate mixed results. However, the increases and reduction margins are almost similar to those of Hikma. The asset turnover of GlaxoSmithKline decreased from 0.64 in the previous financial period to 0.63 in the current period (Glaxosmithkline, 2013). However, fixed asset turnover improved from 0.95 in 2012 financial period to 0.99 in the current period. The slight decreases in the fixed asset were majorly due to the changes in the amortisation of the fixed assets, which did not primarily affect the fixed asset turnovers. Besides the number of days the firm takes to turn its inventories into sales decreased significantly from 183 to166 in the 2012 and 2013 financial years respectively.
Similar mixed results are also indicated in the firm’s credit policy (Weißenberger & Angelkort, 2011). In fact, the number of days the firm takes to collect its debts increased from 72 to 78 which is not a good indicator. However, the number of days the firm takes to pay of its creditors reduced significantly from 371 days in the previous financial period to 354 in the current period (Glaxosmithkline, 2013). The reduction in the number of days indicates that the firm is holding enough liquidity to offset its short term loans.
Gearing Ratios
Hikma indicated slight decreases in its long-term debts and improvements in the shareholders equity. The dropping of the long-tern debts the firm holds and the improvements in the shareholders’ equity resulted in the decrease of the debt to equity ratio from 43.87% in the 2012 financial period to 25.44% in the 2013 financial year. The amount of long-tern debt the firm holds in the 2012 financial period was 372 compared with 263 in the current period. Similarly the amount of shareholders equity increased from 848 in the previous financial period to 1034 in the current period. The increases in the equity also caused the changes observed in the gearing ratios which improved from 30.49% to 20.28%. The interest coverage ratio of the firm also improved from 347 to 805 in the 2012 and 2013 financial years respectively.
The GlaxoSmithKline’s debtors and interest coverage ratios increased from the previous periods. The increases in the ratios are due to the large amount of debts that firm holds. In fact, the amount of long-term debt increased from 14671 from the previous period to 15456 in the current period (Glaxosmithkline, 2013). Even though the shareholders equity increased from 6737 from the previous period to7812 in the current period, the changes in the shareholders equity had little impact on both the debtors and the interest coverage ratios. The indication is that the firm cannot easily offset its debts using the shareholders equity. The firm’s debtor’s ratio increased from 45.92 in the previous financial period to the 50.54 in the current financial period. The interest coverage ratios also increased from 9.05 to 9.41 in the financial period 2012 and 2013 respectively.
Investor’s ratios
The earnings per share improved for both firms. The significant growth in EPS is observable in the Hikma compared with GlaxoSmithKline. The EPS in Hikma grew from 51.1 in the previous period to 107.6 in the current period. However, the firm indicated a decrease in the price earnings ratio from 0.99 in the previous financial period to 0.47 in the current financial period. Similar mixed results are indicated by the GlaxoSmithKline investors’ ratios with slight increases and reductions. The indication is that the share prices, which are the major determinant of the ratios, are affected by the external factors instead of the internal operations of the firms (Chang, Dasgupta & Hilary, 2006).
Conclusions and recommendations
The financial analysis indicates the performances of the firms both at the corporate and industry levels. At the corporate level, Hikma Pharmaceutical has come out to be the best performing firm. The performances of the firm are attributed to its financial strategies as well as its market positioning. The firm is the largest in the Mena region capturing the largest share. In addition, the expansion strategy of the firm also enabled it to increase its sales in new markets such as the North American and other emerging markets. Besides, the takeovers and acquisitions have resulted in the reduced cost of operations, which in effect increased the profit margins. Hikma also has the growth prospects in the industry compared with GlaxoSmithKline.
On the other hand GlaxoSmithKline appears to be financially weak in terms of gross margins and growth ratios. However, the firm is the most stable given its global outlook and the manner in which it manages its debts. GlaxoSmithKline remains to be firm in hard economic times. However, for savvy investors, Hikma Pharmaceutical is the firm to invest in given the highest possibility the firm has for the returns on the investments. As indicated in the financial ratios analysis, Hikma Pharmaceutical PLC has come out to be the best firm to invest in compared with GlaxoSmithKline PLC.
References
Campbell, JY 2006, “Understanding risk and return,” Journal of Political Economy, vol. 104 no. 2, pp. 298–345.
Chang, X, Dasgupta, S & Hilary, G 2006, “Analyst coverage and financing decisions,” The Journal of Finance, vol. 61, pp. 3009–3048.
Collier, PM 2012, Accounting for managers: interpreting accounting information for decision-making, John Wiley and Sons.
Glaxosmithkline 2013, 2013 annual report. Web.
Hikma Pharmaceuticals 2013, 2013 annual report. Web.
Keloharju, M, Knüpfer, S & Linnainmaa, J 2012, “Do investors buy what they know? Product market choices and investment decisions,” Review Finance Study, vol. 25 no.10, pp. 2921-2958.
Li, DD & Li, C 2006, “A theory of corporate scope and financial structure,” Journal of Finance, vol. 51 no.3, pp.691–709.
Rajan, R & Zingales, L 2005, “What do we know about capital structure? Some evidence from international data,” Journal of Finance, vol. 50 no.2, pp. 1421–1460.
Ross, SA, Westerfield, R & Jaffe, JF 2010, Corporate finance, McGraw-Hill, New York, NY.
Stulz, RM 2010, “Managerial discretion and optimal financing policies,” Journal of Financial Economics, vol. 26 no.9, pp 3–27.
Weetman, P 2010, Financial and management accounting: an introduction, FT Prentice Hall, London.
Weißenberger, BE & Angelkort, H 2011, “Integration of financial and management accounting systems: The mediating influence of a consistent financial language on controllership effectiveness,” Management Accounting Research, vo. 22 no.3, pp.160-180.
Yahoo Finance 2014, Hikma Pharmaceutical PLC stocks quotes. Web.
Appendices
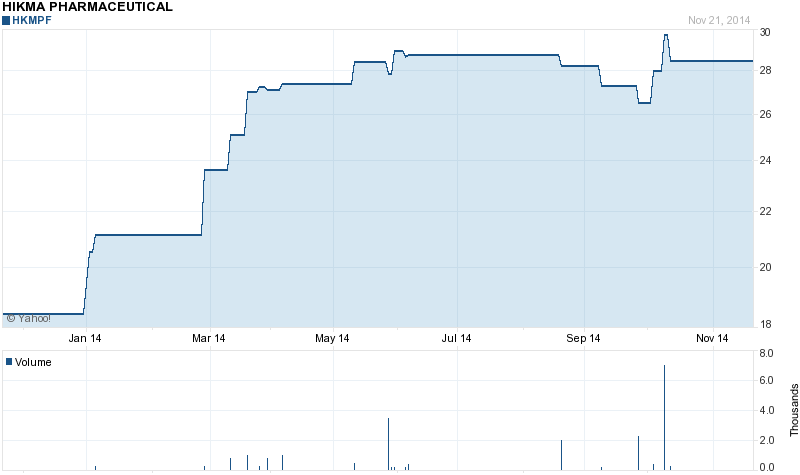
Appendix 1

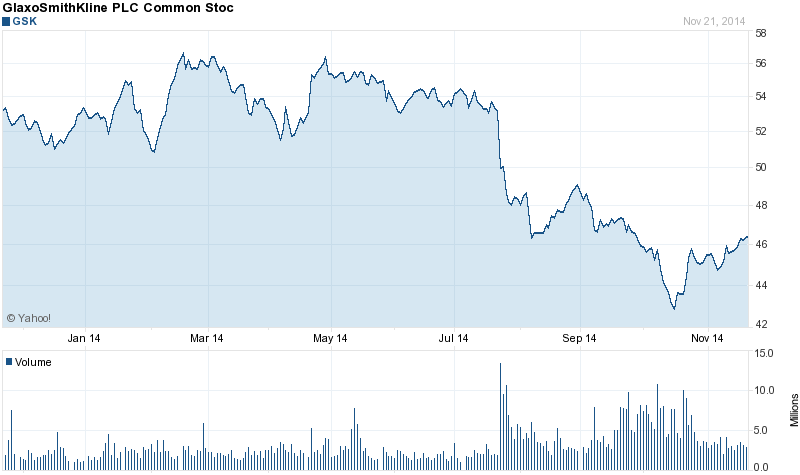
Appendix 2 gsk share prices
