History of Aluminium
In their natural state, components of Aluminium were used many years ago mostly in Rome, Egypt, and Greece. Aluminum Sulphate, for example, was considered to be an aid in dying procedures, while hydrated Aluminium silicates came in handy in pottery since they were used as a source of clay. This metal was first discovered by a man called Humphry Davy in 1808 and was named Aluminum, to be later converted to what we know as Aluminium. Seventeen years down the line Hans Christian Orsted, an expert in chemistry and physics from Denmark, realized that an impure form of the metal could be made by initiating a chemical reaction between potassium and anhydrous chloride. Later on a geologist from France who was also a mining engineer known as Pierre Berthier set out to develop Aluminium from bauxite ore and this proved successful. Then, towards the end of the 1880 era, Paul Heroult from France and Charles Martin from the United States discovered a simpler way of producing commercially viable Aluminium through a procedure commonly known as the Hall-Heroult process. This is the method that is used across the universe to date and this owes to its economical advantages.
There are two varieties of names that are used when referring to this compound and these are aluminum and Aluminum. Both names are accepted by the International Union of pure and Applied Chemistry with the former being the first one to be used and the latter being adopted three years down the line. Even though these names are both used in the periodic table, IUPAC mostly uses Aluminium in its internal documentation, while most public documents use aluminum as well.
Mathematical Formula for Determining Currents, Melt Velocities, Current Efficiency, Magnetic Fields and Melt Topography in Hall-Heroult Cells
A very high percentage of Aluminium produced in the United States is processed using the Hall-Heroult Cell. In this process, the Aluminium oxide is broken into melted cryolite electrolytes which are reduced to metal in an electrolytic way. The electricity of approximately 11.4 Gigawatts is used in this process and this creates a need to improve the productivity of the cell.
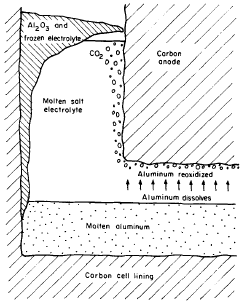
Figure 1 indicates part of a cell in the process of producing Aluminium. From this, it is visible that cryolite in the molten state is a float in a mass of liquid Aluminium. Carbon anode deeps into the cryolite while the cathode is made from the surface of the molten Aluminium, at this point the metal is formed and carbon dioxide is produced by the anode reaction. The productivity of the cell is highly altered by the electromagnetic force inside the liquid Aluminium and cryolite. Under perfect conditions, a cell would carry a current of between 100 and 200 kA principally moving downwards from the positively charged to the negatively charged electrodes. This current, alongside the currents in the adjoining cell apparatus, produces a high level of the magnetic field of up to 10mT moving in a parallel direction. The coming together of these currents and magnetic fields with speeds of about 10cm/s results in the circulation of the Aluminium metal and the cryolite. The circulation, on the other hand, leads to wearing out of the lining in the carbon cell and the same effect reduces current productivity of the cell.
The wearing out effect is a result of the Aluminium metal produced dissolving it in liquid cryolite at a very low rate. The same compound is moved in the direction of the positively charged electrode and here it is de-oxidized by carbon dioxide bubbles. This is the process demonstrated in fig.1 above and can be considered as a major reason behind a decline in current productivity which should go up to between 85 percent and 95 percent in a normal cell. The movement of the suspended Aluminium is catalyzed by the disturbance within the cryolite which is a result of the electromagnetic movements. In the process of developing this investigation, one of the main agendas is to determine the extent of the relationship between electromagnetic movements and the current productivity from the initial principles. This brings about an idea of how high levels of current efficiencies can be achieved hence improving the performance and design of the cell.
The second most important agenda is forecasting the topography of the interaction between the Aluminium metal and the electrolyte. The resultant electromagnetic forces bring about a distortion in this interaction, hence the interface becomes more at the cell’s center compared to that against the walls. Reducing the space between the positively charged electrodes and the interface causes a reduction in the resistance experienced in the cell voltage and this will eventually result in a lower level of energy consumption. Bringing the positively charged electrodes nearer to the Aluminium would be aided by a reduction in interface distortion.
This undertaking involves four steps, first calculating the magnetic fields and the currents as a function of the cell position to get the electromagnetic force circulation. The second phase is solving the turbulent liquid flow equations together with the previous force distribution to get the turbulence and speed levels in the cell. The liquid flow equations are computed to obtain weight distribution in the metal and electrolyte and this becomes useful for the computation of the topography of Aluminium-electrolyte interaction. The final phase involves computing the rate of movement of the Aluminium to the positively charged electrodes and the current efficiency. This is obtained from the turbulence energizing power distribution in the electrolyte.
Calculation of the Magnetic and Current Fields
Ohms law is the principle that was applied in the calculation of current distribution inside the cell as shown below.
J = –σ∇E [1]
Since the current is usually preserved inside the cell,
∇·J = 0 [2]
And as a result,
∇·σ∇E = 0 [3]
Where:
- J: current density vector
- E: electric potential
- σ : Electric conductivity
It should be noted that σ will vary in different cell locations and also that the equations (1-3) presented above are used in the description of both the ionic and electronic conduction in the liquid electrolyte and carbon lining, metal pools, and collector bars among others respectively. A disruption in the potential arises at the positively charged electrode-electrolyte interface, as well as at the Aluminium-electrolyte interface owing to the reactions occurring in these places which are electrolytic in nature.
The extent of these separations (from now referred to as the electrochemical potential drop) is shown in equation 2. The electric potential in equations 1 and 3 is in return described as the potential in relation to the collector bar end inside carbon lining, Aluminium pool, or collector bar potential. The cryolite, on the other hand, has the potential described as the potential difference needed to push the electrochemical reaction in the electrolyte; Aluminium reaction is deducted from the potential in relation to the collector bar end. It, therefore, indicates that the electric potential is continuous in all parts of the cell.
An accurate solution to equation 1 was supposed to be a three-dimensional solution with tolerance made to the flow of current in the stretched parallel dimension of the cell, portrayed as x-direction in Fig 2 below. As a matter of fact, current in this direction is minimal when compared to parallel current moving in the short dimension of the cell displayed as direction y and to even greater currents moving in the perpendicular direction, displayed in figure 2 as the z-direction. As a result, computer time can be saved significantly by using only two dimensions that are y and z to solve the equation. In addition to that, more time can be salvaged by making use of the cell’s symmetry, which is assuming y is a constant implying that there is no current flowing across that surface. The other periphery conditions considered in this computation include the assumption that electric potential E has a zero value at the end of the collector bar, while again the value of E is equated to the voltage drops for electrochemical deducted from the whole-cell voltage drop.
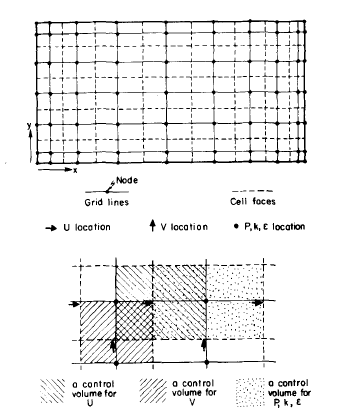
Reactions in the interaction between the solution and positively charged electrode eventually result in the top facade of the solution between the refractory and interface between carbon cell wall to be insulating which implies that they have zero inclination to the normal electric potential. The numerical approach used in these calculations was a predetermined element process of 747 knobs. The current concentration mass having been computed inside the cell, the magnetic field force and direction at any given point can be computed as well using an integral form of the Biot-Savart law as shown below:
Where (r – r’) represents the measure of radius from point (r) at which the vigor of transmitter H is computed up to a point (r’) where the current concentration is J. When integrating, the result is the total capacity elements in the cell as well as around it. Precisely, equation 4 cannot be used in calculating magnetic field input for the current transportation essentials outside the cell such as the ring bus among others. This owes to the fact that the inner walls of the cell are partially protected by the steel shield. In support of this claim, a reduction factor for the ring bus contribution is applied. From this, we realize that the solution of equation 3 was two-dimensional while the integration in equation 4 was developed in three dimensions. Once the current concentrations and magnetic forces have been computed at different points inside the cell, the electromagnetic moving force was determined using the formula
F = μJ·H [5]
Whereas:
- F: electromagnetic field vector
- μ: Magnetic permeableness.
Gas Bubble stratum Geometry
While a lot has been said concerning the development, growth, and movement of gas bubbles in liquid solutions, very little is identified about the character of bubbles created in molten substances or under nearly parallel surfaces. Most of the authors who have attempted to discuss this topic have not come across published information on the arithmetical representation of the derivative current allocation in the large-scale Aluminium metal cells, which are inclusive of a simulation of the gas bubbles. The most likely cause is the fact that most people have little knowledge of the behavior of bubbles. The extent of bubble formation around the positively charged electrodes which is said to vary in large-scale operations based on assumption is not clear.
Irrespective of this fact, the consequences of the gas bubbles in this process are included in some of the analyses carried out, a good example being a theory referred to as the fanning factors developed by Haupin (1). The other example is an explanation of the current pickup when new positively charged electrodes are set. A good number of arithmetic illustrations have been created while taking into consideration the outcome of gas bubbles from a universal point of view that is, the contact of the gas introduced bubbles with hydrokinetics of the cell, notwithstanding the nature of the electrolyte among others. Despite all these attempts, the major reference on the knowledge concerning gas bubbles in the metal cells seems to be the dimensions in physical representation.
Table1: Expected consideration concerning gas stimulated bubbles in large-scale Aluminium cells originating in references.
PM: data acquired through physical modeling.
M: Data acquired through measurements in large-scale production cells.
When carrying out electrolysis, bubbles are developed by the dissolution of gas from the highly saturated liquid along with the bubble’s surroundings. However, in low heat models, gas progression is determined by running gas through a permeable medium. These bubbles develop when gas directly enters a small bubble promoting the development of the larger ones. This is however not a very significant difference if concretion is the main method used in bubble development. The tiny bubbles developing on the surface of the anodes do not necessarily influence the movement of the larger ones.
A complete model designed like a two-dimensional cross-section through a 150kA half-baked Aluminium metal cell, just like illustrated in this paper, has been used successfully before. An anode-based gas progression was tested by letting air flow through permeable polythene and it was discovered that a very small part was enough to induce extensively the resilient movement of the bubbles. These bubbles were big with a dimension of between 2 and 128 cm. The frequency of production was found to be approximately 3 bubbles per second.
How Aluminium is manufactured in Hall-Heroult Cell
When producing Aluminium using this process, alumina is electrolyzed in liquid cryolite using carbon electrodes that conduct electricity. In the process, the anode is used at a rate of around 450kg/mT of metal produced in the reaction.
This process, however, does not pass without challenges and the main problem is brought about by the high cost of anodes used up in the process. The other problem is the number of impurities that remain in the molten metal, especially the one originating from petroleum cokes used in the fabrication process. Most of these impurities include silicon, titanium, nickel, sulfur, vanadium, and iron. Sulfur is a specific pollutant to the environment as it produces harmful gases during the oxidation process. The other impurities, specifically metals, contaminate the end product and they need more costly procedures in cases where pure Aluminium is needed. If by any chance carbon was not used in the reaction the equation would be 2Al2O3—>4Al+302 hence recovering the oxygen consumed. This would also reduce the level of contamination in the atmosphere as well as in the Aluminium metal.