Introduction
We reside in a 4-storrey building. Our one bedroom is situated on the second floor and in addition to the bedroom, it has a sitting room, a tiny kitchen and a bathroom. In this house, we live me, my wife and our 6-month-old son. For planning’s sake, the following method will be used to carry out water and energy consumption review for our house.
Procedure Part one
Every day’s consumption of water supply, electricity, cooking gas and hot water were observed and accurately tabulated starting from March, 5th 2010 at 00.00 am to March, 12th 2010 at 00.00am. Below is the recording of the amount of energy consumed by each of the above four mentioned energy-consuming units for a period of 8 days.
Table 1: hot water, electric, water and gas consumption
For easy of calculation, we convert hot water meter reading and gas reading into MJ where the conversion factor is 1m³(gas)=39.3MJ, 1Unit(hotwater)=3.60828MJ, 1kWh=3.6 MJ
Sydney water: 265 kWh/ML water supply= 0.265 kWh/kL water supply
The actual daily consumption in a period of 8 days of the above-mentioned utilities are calculated and recorded in the following table 2.
Table 2: showing actual consumption for 7 Days in standard units.
Since our son is only six months old, we can ignore her consumption and the compute for only two people. So the table below shows electric, hot water, water supply and gas consumption per head per day.
Table 2: utility consumptions in 7 days.
For the purposes of calculating the amount of energy consumed in one year, we compute the amount consumed per week as follows:
Table 3: consumption per week (kWh/person/week).
These consumptions can be represented graphically as follows:
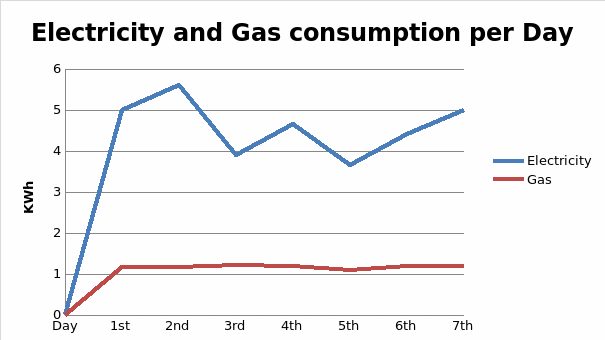
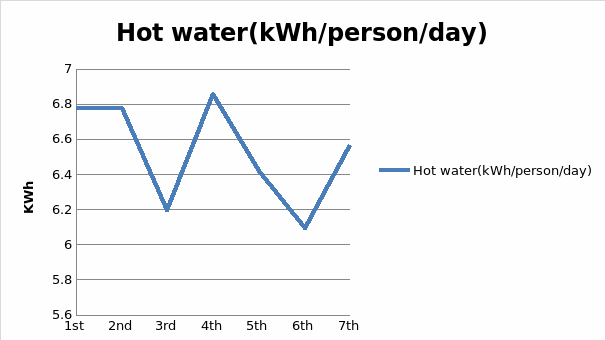
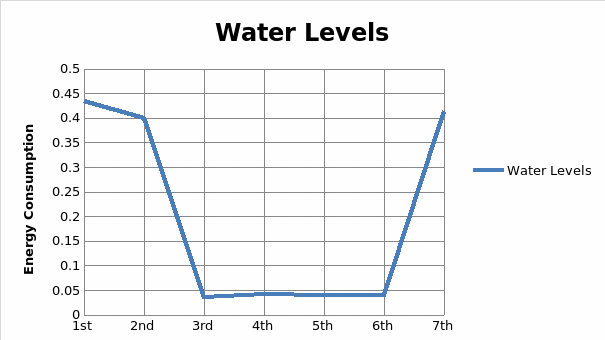
Assuming that the consumption remains the same for the rest of the year, we are able to determine the consumption for the four utilities as follows using the calculated values to remain constant. Therefore to calculate the amount of energy used in one year is as follows:
Amount of energy used in 1 year= [electric consumed/week + hot water used/week + gas used/week + water supply used/week] 52 weeks
Amount of energy used in 1 year=[33.2kwh/week+8.192kwh/week+45.675kwh/week +1.40404kwh/week] 52weeks
Amount of energy used in 1 year = 4600.49 kWh
As we know, for every 1 kWh consumed, 1.07 kg is emitted or produced of CO2- while for natural gas the emissions are 51.33 g CO2-e/MJ. Therefore we can calculate the approximate yearly greenhouse gas emission as follows:
Gas consumed by in a week per head= gasconsumedeveryweekXconversionfactor3.6
Gas consumed by in a week per head=8.198 X3.6=19.5128 MJ/ person
Hot water consumed every week= hot water consumed every week X conversion factor 3.6=45.675X3.6=164.43MJ/person
Therefore yearly green house gas emission is given as below:

= [33.2*(1000*1.07kg/kWh) + (19.5128MJ/week+164.4MJ/week)*45.675]*52 weeks
= [3552.4g/week +8400.21714g/week]*52weeks
=621536.06g/person or 621.54kg/person
Procedure Part two
We had a public holiday on a Tuesday which was on March 9th, 2011. Since we didn’t go to school, I was at home the entire day and therefore took an opportunity to record that day’s consumption and tabulate them as follows:
Table 4: Electricity, gas, water and hot water consumption during the 1 day
As indicated in the method part, we live three in the house but our six month son is excluded from the calculation. Therefore the actual amount of energy consumed in that day is given as below:
Table 5: energy consumption on a holiday, March 9, 2010
From the table, the energy consumption was determined by taking the difference between two readings for the different days. From table 5 we also calculate the amount of electricity used in kilowatts hour and the average power in kilowatts as follows:
Average power demand=amount of energy consumed (kWh)/60minutes
Or Average power demand= energyεkWh/time(h)
Table 6: average power demand
From the computed data in the table 6, we can draw bar graphs to as that we can compare power demand and power consumption. We specifically calculate the amount of energy consumed between 9.00 am and 4 pm. Water supply usage, hot water and electricity consumption for different set of period is show below:
A bar chart of electricity consumption in 24 hours
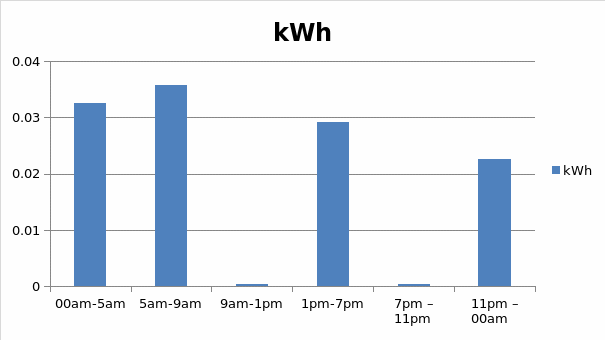
Bar Chart (a): Electricity consumption bar chart
A bar chart of water supply consumption in 24 hours
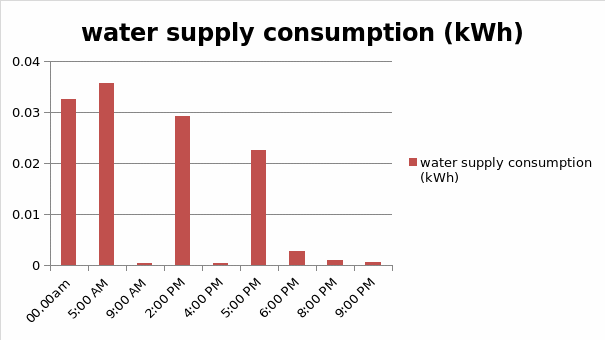
Bar Chart (b): water supply energy consumption
A bar chart of Hot water consumption over 24 hours
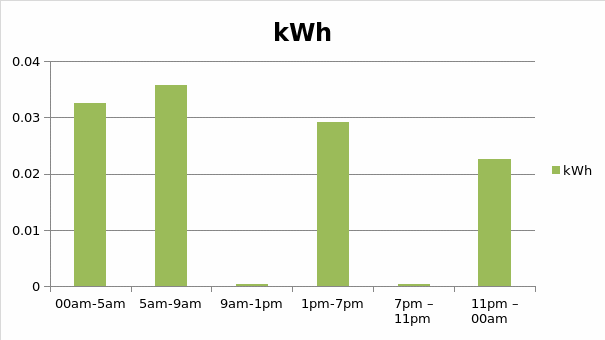
Bar Chart (c): Hot water energy consumption
Discussion
From the above calculations, it clear that the amount of energy used changes daily depending on the kind of gadgets being used. Take an example we when we compare day 3 i.e. March 7, 2010 and day 7 i.e. march 11, 2011. We see that amount of energy that was consumed on day 3 to be 7.8kwh for electricity while on day 7 it is 10kwh. This is because on Sunday, we indoors we and most of the electric appliances were in use. Also this day we washed using a washing machine.
Also when we check our usage of the gas, it also changes depending on the type of food being prepared. For instance day 3 we used 2.413 kwh while on day 7 we used 2.386kWh. its clear that on weekends we were around like on day 7, we used a lot of hot water and the consumption stood at 13.13 kwh while on weekdays for example on day 3 we used 12.39kwh. This is further evident when we exam our water supply usage. On day 7 when we were indoors, we used a lot of water and the amount of energy used comes to 0.82786 kWh unlike on day 3 when we used only 0.0718 kWh. From the above data, it is evident that use of hot water consumes a lot of energy and therefore we are working on the mechanism to reduce this. Higher amount of water supply can be pointed out at irresponsible behavior were we sometime left taps running. This is another area we are checking to improve on. From gas trend, gas usage variation was due to the type of food and time required to be well-cooked.
When we compare the theoretical (calculated) and practical (observed figure from recording) amount of energy consumed from part two, we see that for electricity there is a deviation. This difference is as a result of error in reading, error in calculation, equipment appliances or fault meter. Further the variation can be attributed to inability to measure the amount of electricity consumed by bulbs. From part 2, we see that the amount of water supply usage came to 0.87716kwh (theoretical) while practical one was 0.82786 kWh. The difference is as a result of other outlets such as taps and shower. The percentage difference comes to 5.620%.
General Questions
Based on the above audit of my family energy consumption which has turned out to be huge, set have decided to follow the following guidelines so that we can bring down energy costs and greenhouse gas emission.
The Greenhouse gas emission control measures
- We will harness solar energy and use it to heat water instead of using electricity
- Use electrical apparatus that are rated to be energy efficient
- At all times we switch of all machines that are not in use
- We activate standby mode for computers, TV sets among others
We shall reduce the amount of water usage by
- Washing utensils and clothing at once instead of washing in bits
- Closing all taps to eliminate the possibility of leakage and in the shower room we use shower restrictors
- We will be recycling water were necessary
What are the obstructions & possible solutions for all difficulties
- The cost of appliances: the barrier has been buying energy efficient appliance that will save energy and reduce emission. These appliances are slightly expensive but in the long-run are the best. We will purpose to be buying these appliances one by one until we replace all.
- Improper Operational conduct: this can be pointed out to the lack of accurate background information. A nationwide public campaign must be carried out to educate the general public on the importance of using well resources and the ways of reducing poor emission.
Additional emissions
We have many sources of emission and these include emission from burning municipal waste, industrial emission particularly by manufacturing industries, agricultural spraying, and motor vehicle among others. Things like old model refrigerators emit gas and therefore should be replaced with a modern one. Finally plastic paper bags have been cited as another source of gas emission.
Most of the emission can de reduce by minimizing the time the refrigerator and air conditioner is turned on, using gadgets that have energy star label meaning they use less energy and emit very little if any. We can also bring down emission by using biodiesel which is a natural fuel therefore no harmful emission. For plastic paper bags, we can use that have a heavy gauge so that we can recycle or alternatively not use plastic if we can.
Conclusion
From the above calculations of the energy consumption, we learn a lot when I to comes to being responsible in using the resources we have such as water, gas, and electricity. From the house audit, we have determined the amount of energy used for the four utilities and established which one is being misused. From the data, we have seen that electric consumption tops the while the gas coming as the last one. Basically by controlling the amount of energy used in our house, we are also control the amount of harmful gas we emit in the environment. We have learned on how to control energy and save some money.