Executive Summary
The review of literature concerning the improvement of employees’ work-life balance (WLB) revealed that three aspects might affect the WLB of the employees. They included management of workspace, communication with friends, and communication with family. Thus, three hypotheses were formulated:
- H1 = Effective space management has a significant effect on WLB during distant work after controlling for gender.
- H2 = Communication with co-workers has a significant effect on WLB during distant work after controlling for gender.
- H3 = Communication with the family has a significant effect on WLB during distant work after controlling for gender.
Multiple regression was used to test the hypotheses. The analysis found significant support for Hypothesis 1; however, Hypotheses 2 and 3 were rejected. Several recommendations were formulated based on the results of research and analysis of possible risk factors and ethical considerations. They included conducting workspace management training, disseminating the results of this study to attract attention to the training program, and ensuring the ethicality of the training process.
Hypothesis formulation
Identification of independent and dependent variables derived from the collected datasets
The purpose of the data analysis was to understand what processes could be implemented to help the employees maintain a healthy work-life balance (WLB) during periods of distant working. In order to formulate hypotheses, a literature review was conducted. The literature review helped to understand what practices and changes in the corporate culture could help to improve the work-life balance. These practices were introduced as independent variables that were expected to affect WLB, which was identified as the dependent variable.
Work-life balance is a significant concern for employees during the distant work period. During the COVID-19 pandemic, many companies were forced to move to distant work regimes to continue operations with minimal disruptions (Pathak, 2021). During this period, WLB became a significant concern, which encouraged the companies to implement immediate measures to improve the situation (Pathak, 2021).
Work-life balance is of extreme importance for both employers and employees. According to Irawanto, Novianti, and Roz (2021), WLB during the COVID-19 period was closely correlated with the employees’ satisfaction. Since employee satisfaction is closely correlated with the productivity and effectiveness of employees, it is of the employer’s major interest to help the employees maintain an adequate WLB (Irawanto, Novianti, and Roz, 2021).
Several factors were identified that may affect the WLB among employees. For instance, Udin (2021) stated that employees can maintain a good WLB if they are supported by both family and the employer. On the employer’s side, Udin (2021) suggested that the employer could support the employees by helping them to manage time, conducting stress management time, and teaching them about the effect of spending time with the family on WLB, workplace satisfaction, and work efficiency. On the family side, Udin (2021) recommends adapting family norms to ensure that the family members can work and live in the same place.
Another study was conducted by Caringal-Go et al. (2021) provided several strategies for maintaining an adequate WLB. These practices were divided into cognitive crafting strategies, physical crafting strategies, and relational crafting strategies. Physical crafting strategies included managing time, workspace, and work tasks adequately (Caringal-Go et al., 2021). Cognitive crafting strategies included enforcing health-related self-care practices and embracing fluidity between work, rest, and leisure (Caringal-Go et al., 2021). Relational crafting strategies included spending time with the family and connecting with co-workers online for leisure (Caringal-Go et al., 2021).
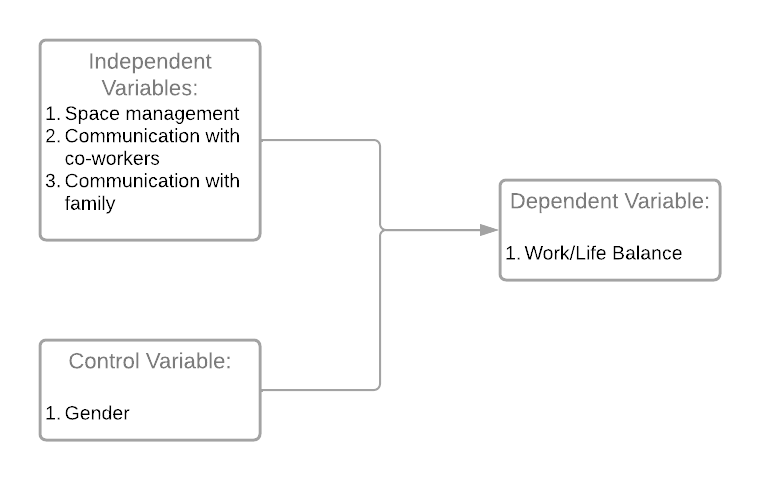
Considering the information provided above, several variables were considered. First, the dependent variable was the WLB, as this research was striving to single out strategies that could improve the WLB among employees during the period of distant working in Australia. Second, it was decided that space management was one of the possible independent variables that affected the WBL of Australian employees working from home, as it was suggested by Caringal-Go et al. (2021). Third, communication with co-workers was considered to be a possible independent variable (Caringal-Go et al., 2021; Udin, 2021). Fourth, communication with family was believed to be a significant practice that affected WLB (Caringal-Go et al., 2021; Udin, 2021). Finally, Udin (2021) suggested that strategies may be different for males and females; thus, gender was considered a control variable. The list of variables is provided in Table 2.1 below.
Table 2.1. Model variables
Design of a diagram showing relationships amongst the identified variables
Figure 1 below arranges all the variables in a diagram for the reader to be able to visualise the relationships among them. Creating such diagrams is of extreme importance for researchers, as these diagrams can be considered conceptual models that facilitate understanding of the intricate interrelationships among concepts and variables (Robinson et al., 2015). While the diagram provided below is fairly simple due to the limited number of variables, business research may identify numerous variables that may have very complicated inter-relations.
Design of a hypothesis
A total of three hypotheses were formulated to test the relationships between the variables.
H10 = Effective space management has no significant effect on WLB during the distant work period after controlling for gender.
H1A = Effective space management has a significant effect on WLB during distant work after controlling for gender.
H20 = Communication with co-workers has no significant effect on WLB during distant work after controlling for gender.
H2A = Communication with co-workers has a significant effect on WLB during distant work after controlling for gender.
H30 = Communication with the family has no significant effect on WLB during the distant work after controlling for gender.
H3A = Communication with the family has a significant effect on WLB during distant work after controlling for gender.
Data preparation
In Part 1, it was suggested that both qualitative and quantitative data should be used to formulate strategies for addressing the problems of inadequate WLB in the selected Australian company during the distant working period. Indeed, a mixed-method approach could help the research to benefit from both qualitative and quantitative methods, which implies high reliability and depth of insights would be united in one study (Saunders, Lewis, and Thornhill, 2019). However, after careful consideration, it was decided to stick to quantitative methods only.
There were two reasons for abandoning the idea of using qualitative data. On the one hand, it was decided that collecting qualitative data would be associated with increased time spent on the research. On the other hand, utilisation of qualitative methods would be associated with increased barriers due to the limitations associated with the COVID-19 pandemic. Thus, only quantitative methods were used.
The data was collected using a self-created questionnaire that included only five questions. Four questions were based on a seven-point Likert scale, and one question was a categorical question that was meant to measure gender. The questions are provided below:
What is your gender?
- Female
- Male
During the distant work period, I had a good work-life balance.
- Fully disagree
- Disagree
- Somewhat disagree
- Neither agree nor disagree
- Somewhat agree
- Agree
- Fully agree
During the distant work period, I managed space well in my house.
- Fully disagree
- Disagree
- Somewhat disagree
- Neither agree nor disagree
- Somewhat agree
- Agree
- Fully agree
During the distant work period, I communicated virtually with my co-workers well.
- Fully disagree
- Disagree
- Somewhat disagree
- Neither agree nor disagree
- Somewhat agree
- Agree
- Fully agree
During the distant work period, I communicated with my family often.
- Fully disagree
- Disagree
- Somewhat disagree
- Neither agree nor disagree
- Somewhat agree
- Agree
- Fully agree
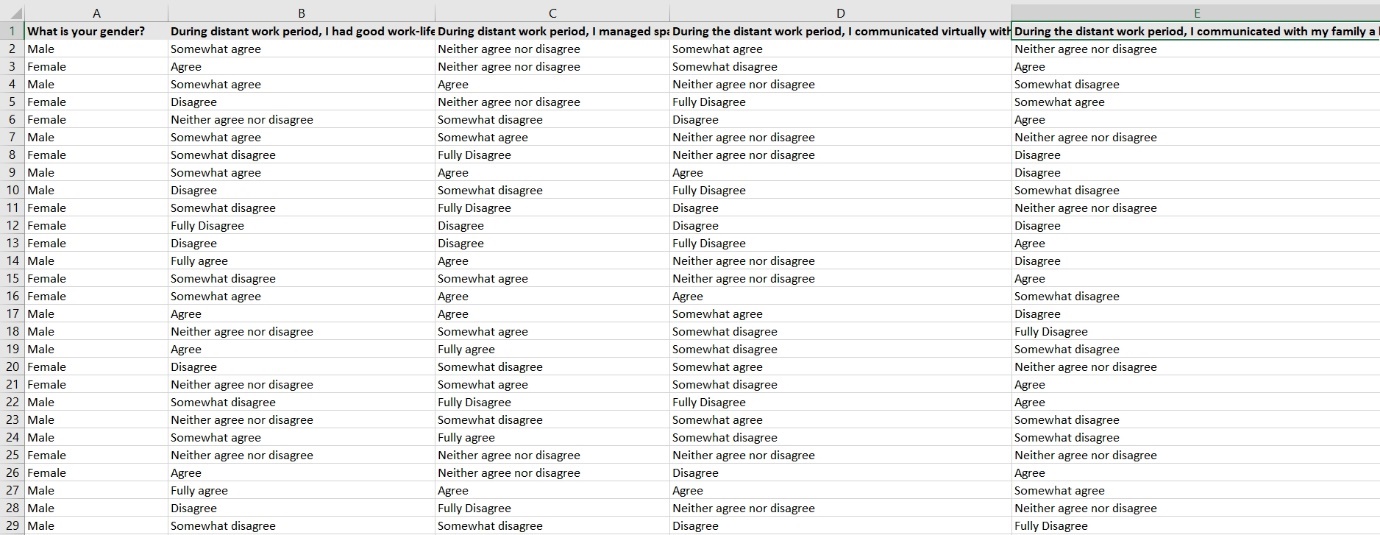
The survey was conducted using Survey Monkey, which created a unified dataset. A screenshot of the initial dataset is provided in Appendix A. The dataset included a total of 30 responses acquired from a random sample. The questionnaire was sent to the potential participants using corporate email. In the email, the participants were provided with a brief description of the research details and the questionnaire. Additionally, the email included a link to the Survey Monkey website. A total of five days was spent on data collection.
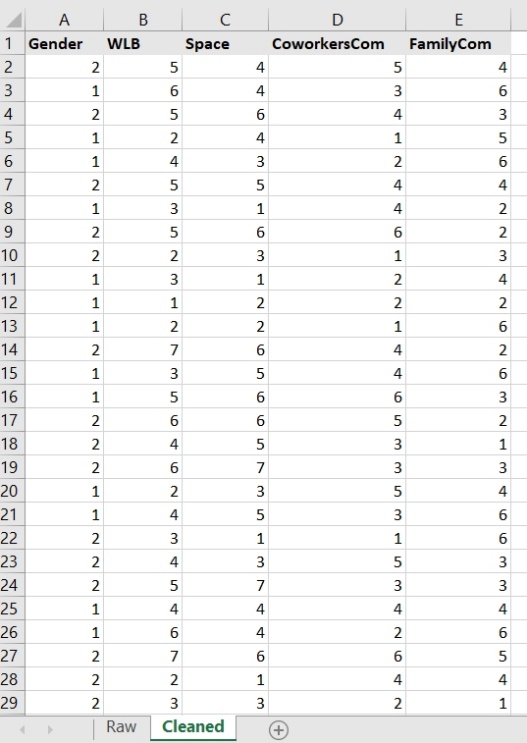
It was planned to use Statistical Package for Social Studies (SPSS) for conducting the statistical analysis. However, the initially acquired dataset was unusable for SPSS, as it included textual data, which cannot be used by the software. Thus, the data were exported to Microsoft Excel to modify it for future use. Three types of activities were used to prepare the dataset for future analysis. First, the questions in the first row were replaced with variable names. The names were adapted for use in SPSS. In particular, variables names excluded spaces and all characters except for letters and numbers were excluded. This was done manually, as only five cells needed to be altered.
Second, the wording of the Likert scale questions was replaced with the corresponding number. This was achieved by the “Find and Replace” function in Excel. The wording of the Likert scale choice was entered in the “Find what” row and the corresponding number was entered in the “Replace with” row (see Figure 2 for an example). Third, the gender variable was transformed into a categorical variable, where “Female” was replaced with “1”, and “Male” was replaced with “2” so that SPSS could use the variable for analysis. A screenshot of the final dataset is provided in Appendix B.

After all the procedures in Excel were finished, the dataset was imported to the SPSS, where the variables were given labels for a better understanding of the results. A screenshot of the variable view in SPSS is provided in Figure 3 below.

A summary of all the datasets used for the final model is provided in Table 2.2 below:
Table 2.2. Summary of data sets for the integrated model
Data analysis
Justification of the statistical model
The research conducted for this case study was correlational, which implies that statistical methods for correlational research were expected to be used. Three statistical methods were considered for the analysis, including Pearson’s r, multiple linear regression, and a simple moderation model.
Pearson’s correlation analysis is the simplest method of correlating two variables (Cooper and Schindler, 2014). Pearson’s r provides an easy-to-interpret coefficient, which identifies the degree of correlation between two variables on a scale from ‘-1’ to ‘1’, where ‘-1’ stands for direct negative linear correlation, ‘0’ stands for no correlation, and ‘1’ stands for direct positive linear correlation (Saunders, Lewis, and Thornhill, 2019). While Pearson’s r is an adequate method for determining the degree of correlation between two variables, it cannot be used to create a model that will correlate several independent variables to one dependent variable (Sedgwick, 2012). Moreover, the analysis is accurate only if the data is normally distributed and the correlation between two variables is linear.
One of the most frequently used methods for data analysis in correlational research is linear regression (Cooper and Schindler, 2014). Linear regression can be both simple (one dependent variable) and multiple (several dependent variables). The method is frequently used because it allows correlating several independent variables to one dependent variable and creating a model that will help to predict the outcomes (Saunders, Lewis, and Thornhill, 2019). Linear regression analysis is easy to interpret, as the results provide a list of coefficients with their significance and magnitude of effect, along with the coefficient of determination, which allows understanding of the predictive ability of the model in general. However, there are certain limitations associated with the regression analysis (Saunders, Lewis, and Thornhill, 2019). First, the regression analysis assumes that the correlation between the independent variable and the dependent variable is linear, so it cannot be used when the correlation between the variables is non-linear (Rubinfeld, 2000). Second, regression analysis measures only the direct effect of the variables, without accounting for indirect effect, if there is any (Saunders, Lewis, and Thornhill, 2019). Third, the data within variables need to be normally distributed.
The simple moderation model was considered based on the assumption that gender may moderate the relationship between the dependent variable and the independent variables. This method is similar to the linear regression analysis; however, it accounts for the indirect (moderation) effect, which is the model’s central benefit (Memon et al., 2019). However, the model would provide inadequate results if there is no indirect effect of the variables, which is the central limitation of the model. Table 2.3 below provides a summary of the comparison of different models.
Table 2.3. Comparison of different statistical models
The analysis of possible methods revealed that simple regression analysis is the most appropriate method for analysing the data. The central reason for that was that several independent variables needed to be correlated to one dependent variable. Additionally, no confirmation that gender could moderate the relationships between the variables was found. Therefore, the use of the moderation model was inappropriate.
Analysis and discussion
The hypotheses were tested using multiple linear regression. The results of the analysis revealed the model was statistically significant (F(4,25) = 10,91; p < 0.001 ) with a coefficient of determination R2 = 0.636. This implies that the model had a high predictive ability since 63.6% of the changes in the dependent variables could be explained by the changes in the independent and control variables. The estimations of the coefficients are provided in Table 2.4 below.
Table 2.4. Coefficients
The analysis of coefficients demonstrates that only working space management had a statistically significant impact on work-life balance, as the coefficient’s p-value (p < 0.001) was below the alpha level of 0.05. Communication with co-workers (p = 0.135) and communication with family (p = 0.85) were insignificant predictors of WLB, as their p-values were above the alpha level of 0.05.
Hypothesis 1 was accepted, was accepted as the analysis revealed significant evidence that the working space management had a positive influence on WLB. In other words, the more effective the working space management of an employee, the better the BLB of the employee. This implies that the company can help the employees to improve their WLB by conducting training about workspace management during the distant working period. The training should concern distinguishing between the space where one works and the space where one rests. The findings of this paper are consistent with the current body of knowledge. In particular, Udin (2021) stated that women are more likely to work productively while working at home if their workspace is well-organised. Similarly, Caringal-Go et al. (2021) stated that organising the workspace was one of the central strategies.
Hypotheses 2 and 3 were rejected as the coefficients did not reach the statistical significance level of alpha = 0.05. This implies that frequent communication with co-workers and family cannot help to improve WLB. The findings were inconsistent with the previous research. Udin (2021) stated that communication with family and support was crucial for maintaining WLB. Additionally, Caringal-Go et al. (2021) stated that communication with colleagues was crucial for having an adequate WLB.
The inconsistency between the results of this research and the previous body of knowledge may have two explanations. On the one hand, the discrepancy may be explained by the differences in the populations. This study’s population were the employees of the selected company, while the previous studies focused on Europe and the Middle East. On the other hand, the inconsistency may be explained by the limitation of the methods utilised by this study.
Assumptions and limitations
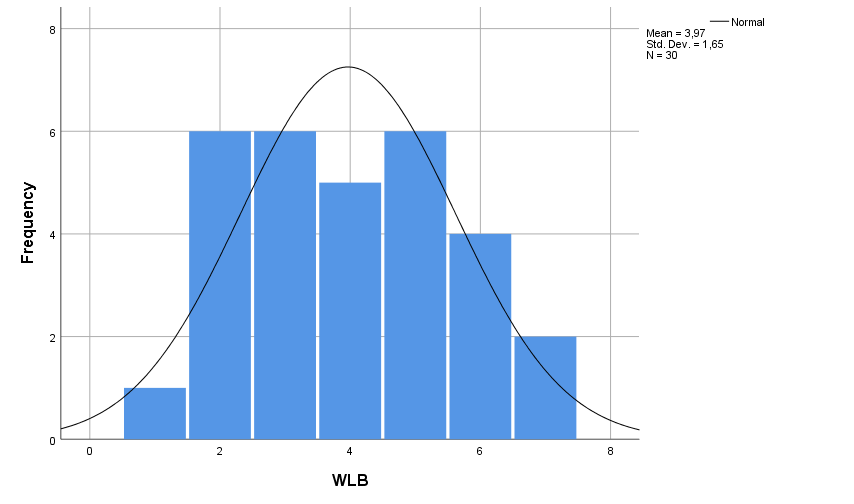
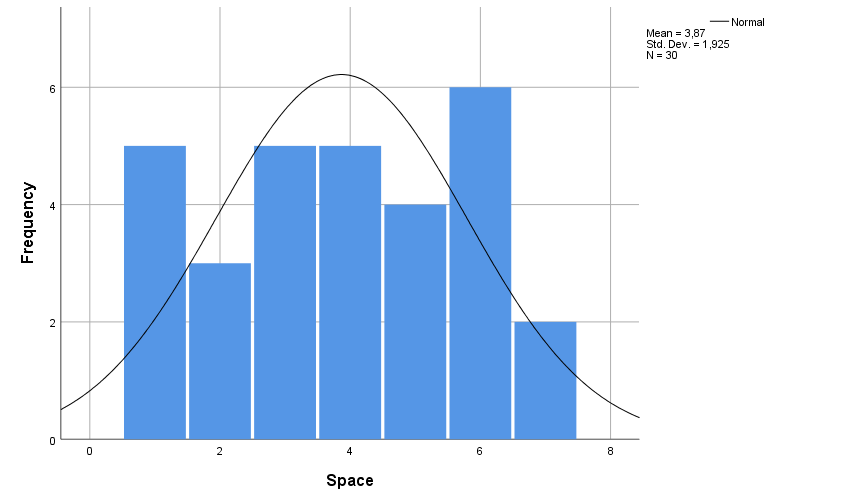
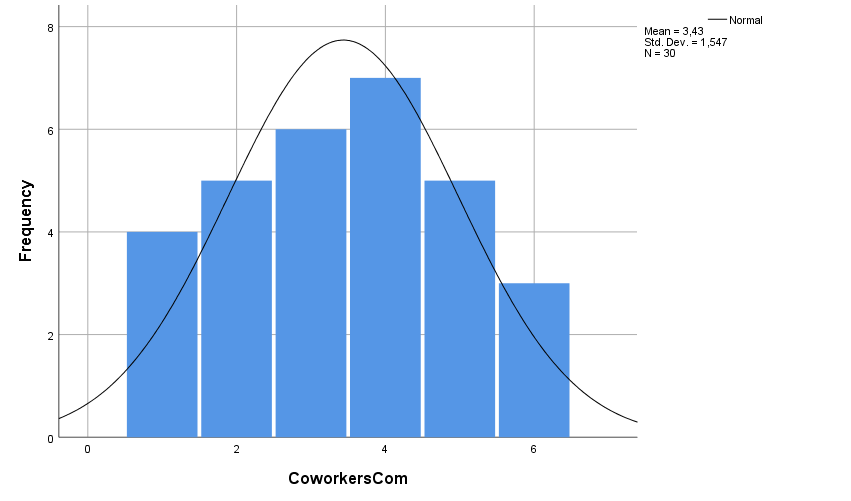
According to McClaive, Benson, and Sincich (2018), there are several assumptions associated with regression analysis. First, correlation analysis is possible only under the assumption of normality. The analysis revealed that only one variable (Communication with Co-Workers) was normally distributed, while all the distribution of other variables did not follow the normal distribution curve. Normality was assessed by creating and analysing histograms for all the variables. The histograms are provided in Appendix C. Second, regression analysis assumes the absence of multicollinearity. Pearson’s correlation analysis was conducted to understand if there were strong correlations between the independent variables. The analysis revealed that multicollinearity was not a significant issue. Finally, regression analysis assumes that the relationships between the dependent variable and the independent variables were linear. The analysis of scatterplots provided no conclusive results since the variables were measured using Likert scales. In summary, the analysis revealed that there were significant issues with assumptions of regression analysis, which may have led to bias.
There are other limitations of this study that should be acknowledged to help the reader assess the reliability of the findings. First, the sample size was smaller than is required to arrive at reliable results. The sample size for this study was 30, which is below the recommended minimum of 118 participants assuming the acceptable margin of error of 3% (Cochran, 1977). Thus, the reliability of the findings may be questionable. Second, the researcher could not guarantee that all the members of the population had an equal chance to participate in the study. Third, the instrument used for measuring the variables was self-created. Even though it had high face validity, other types of validity were not assessed, which implies that the instrument may have failed to measure what was intended. Finally, the results of this research are applicable only to the selected population. Managers are to use the results of this study for other populations with caution.
However, despite the limitations of this study, it should be acknowledged that the results are still reliable, as the utilised methods were appropriate for the purpose of the study. Even though the sample was small for full-scale research, it was enough for this case study, as it aimed at providing preliminary results.
Deployment considerations
The analysis of data revealed that conducting workplace management training was associated with significant improvement in the WLB of the employees. Thus, it was recommended the selected company to provide space management courses for their employees to improve the WLB and workplace satisfaction. The courses were expected to improve the effectiveness of the employees during the distant working period in Australia.
While the deployment of the program was expected with significant benefits, several risks were identified that could affect the implementation of the programme. These risks are listed below:
- Finding a provider. Workspace management is a very narrow topic that requires a very specific provider. However, a brief overview of the market of the current providers of business training revealed that there are no companies that offer workspace management courses. This implies that the selected company will not be able to choose between several providers for the best price/quality ratio. Instead, the company will either need to agree to the only provider they find or create their own space management courses based on best practices. This may result in the low effect of training.
- Attracting attention to the courses. Even if the company creates the best courses in workspace management during the distant work period, there is a significant possibility that the employees will refuse to attend them. The company cannot obligate the employees to take the courses, as these courses are not part of their job. Even if the employees are offered to take the courses during their work hours, it is not guaranteed to attract the employees’ attention. Thus, it is crucial to motivate the employees to take the courses.
- Measuring the outcome. It will be difficult to measure the effectiveness of the courses, as difficulties may appear with the determination of the variables applicable to measuring the outcomes. Additionally, it may appear challenging to develop appropriate instruments for measuring these variables before and after the intervention.
- Employee dissatisfaction. Employee dissatisfaction may arise as a result of the unethical implementation of the courses. Ethical considerations associated with the deployment of the project are provided below.
When providing training and development courses, there are several ethical standards that should be followed to ensure employee satisfaction and the overall success of the endeavour. The list of the central ethical considerations is provided below.
- Training should benefit the employee. Implementation of the project should not improve the space management skills of the employee at the expense of significant harm. For instance, learning space management skills should not have a negative effect on the employees’ family lives.
- Dignity should be promoted. The trainers and the participants should not be allowed to harm the dignity of others. For instance, no nicknames that may offend the participants, the customers, the family members, or any other stakeholders should be used during the training process.
- Confidentiality should be protected. The participants and the trainer should protect each other’s confidentiality. For instance, the participants should not disclose any of the sensitive information that was shared during the training sessions.
- Expectations should be clarified. The providers of the training sessions and the employer should be clear about the expectations from the participants. In particular, among other expectations, the employer should explain that the participation is voluntary and there will be no repercussions in case of refusal to participate.
- Emotional and physical safety should be promoted. The safety of employees should be ensured on two levels. First, when developing the content of training, possible negative impact on participants’ physical and emotional health should be considered. Second, the employees’ safety should be protected during the training process. This implies, for instance, that no shocking material should be included in the content.
- Different socio-economic statuses should be considered. The training provider should understand that employees may have different possibilities due to working at home. Some of the employees may not have a separate room or enough space to ensure that no one disturbs them while they work. Failure to acknowledge the differences in socio-economic statuses may lead to employee dissatisfaction and emotional trauma.
- No discrimination should be allowed. Neither the trainers nor the participants should be allowed to discriminate on any basis. This should be clear for all the participants.
The analysis of the study results, possible risks, and ethical considerations allowed to develop a list of recommendations for the implementation of the project. These recommendations are provided below:
- Deploy corporate training courses to improve workspace management skills of employees while working at home. The results of the regression analysis revealed that working space management is a significant contributor to WLB. Since WLB is closely connected to employee satisfaction and efficiency, it was considered beneficial to conduct WLB training to improve the company’s performance.
- Conduct future research concerning the effect of communications with co-workers and family on the employees of the selected company. This research did not find any significant correlations between WLB and employees’ communication with co-workers and family. However, significant limitations were identified, which may have led to biased results. Thus, future research should be conducted on the matter.
- Disseminate the findings of this research to attract attention to the workspace management courses. One of the central risks is the lack of attention from the employees towards the courses. Effective dissemination of knowledge acquired from this research can help to attract the employees’ interest.
- Develop courses based on best practices. The analysis of the training market revealed that there are not enough offers concerning employee workspace management training. Thus, the company can use the opportunity to develop the courses based on best practices specific to this organisation.
- Consider the measurement of the outcome before implementation. The company should ensure that adequate variables and instruments are used for measuring the outcomes of the intervention. Such an endeavour can help to ensure that the outcomes are favourable and the courses can be sued in the future to improve the employee’s WLB.
- Ensure ethicality of training. This paper introduced seven crucial ethical considerations that are crucial for the implementation of the project. Without ensuring ethicality, the company may face significant problems with employee satisfaction.
Reference list
Caringal-Go, J. F. et al. (2021) ‘Work-life balance crafting during COVID-19: Exploring strategies of telecommuting employees in the Philippines’, Community, Work & Family, pp. 1-20.
Cochran, W. G. (1977) Sampling techniques (3rd edn). New York: John Wiley & Sons.
Cooper, D. R. and Schindler, P. S. (2014) Business research methods. Philippines: McGraw-Hill Education.
Irawanto, D. W., Novianti, K. R. and Roz, K. (2021) ‘Work from home: Measuring satisfaction between work-life balance and work stress during the COVID-19 pandemic in Indonesia’, Economies, 9(3), pp. 96-105.
McClaive, J., Benson, G. and Sincich, D. (2018) Statistics for business and economics. London: Pearson.
Memon, M. A. et al. (2019) ‘Moderation analysis: issues and guidelines’, Journal of Applied Structural Equation Modeling, 3(1), pp. 1-11.
Pathak, D. (2021) ‘The work-life balancing act: A study on the mandatory work from home due to COVID-19 on the IT and non-IT industry sectors’, International Journal of Human Capital and Information Technology Professionals (IJHCITP), 12(3), pp. 1-20.
Robinson, S., et al. (2015) Conceptual modeling: definition, purpose and benefits. Web.
Rubinfeld, D. L. (2000) ‘Reference guide on multiple regression’, Reference manual on scientific evidence, 179, pp. 425-469.
Saunders, M. N. K., Lewis, P., and Thornhill, A. (2019) Research methods for business students. Brazil: Pearson.
Sedgwick, P. (2012) ‘Pearson’s correlation coefficient’, BMJ, 345, Article e4483.
Uddin, M. (2021) ‘Addressing work‐life balance challenges of working women during COVID‐19 in Bangladesh’, International Social Science Journal, 71(239-240), pp. 7-20.
Appendices
Appendix A: Original Dataset
Appendix B: Final Dataset
Appendix C: Normality Analysis
