Abstract
Many employers are currently facing the costly challenge of employee attrition. This project study aims to present a prediction model that predicts employees’ erosion. To ensure project completion, the author scrutinized the Dubai Government’s employee data, which I obtained from its Human Resources Department. The employee data helped me determine the statistically essential factors that are associated with an employee’s decision to quit and understand the types of occupations where this model can be applied. The data gathered included information about employees’ specific demographics, seniority, income, and satisfaction.
The dataset consists of 35 variables, with an Attrition category that entails 26 numerical variables and eight categorical variables as well as the data set’s target label, which is “attrition.” The prediction model was developed using the Python programming language with the aid of the Rapid Application Development (RAD) Methodology. The RAD Methodology is used as it allows for adjustments and efficient coding, thus reducing the time necessary for project development.
The purpose of the study is to analyze the data obtained from the HR Department of the Dubai Government and outline the tendencies and factors that drive employees to decide on quitting Government employment. It could help government employers by providing in-depth knowledge as to why some of their employees choose to leave. The ability of employers to predict employee attrition before it happens will enable them to develop a strategy that would increase satisfaction and motivate employees to stay in their jobs.
Introduction
Background of the Project
Attrition can be described as a steady and uncontrollable reduction of a workforce as a result of retirement, relocation, sickness, and death. It is a way of reducing the size of the staff without the meddling of the management. The disadvantages of attrition are its unpredictability and the creation of gaps in the organization, some of which can be challenging to fill. Some of the challenges the organization may experience due to employee attrition include tangible costs such as the loss of productivity, the capital expenditures used to train new staff members, the cost incurred on hiring and selection of new candidates fit for vacancies, the time required to adjust to new changes, issues with the quality of services or products, temporary employee management costs and concerns, and the cost of lost knowledge (Raja & Kumar, 2016).
Effectively, attrition is a mostly negative phenomenon that can have a severe adverse effect on an organization’s productivity and expenditures. Most managers would want to know the reason why their workers are quitting to develop more effective strategies and policies for staff maintenance.
In the course of their careers, many employees make transitions between working environments. These changes include leaving one firm to work for another or transferring to another department within the same organization. Either way, these changes are usually done with intentions to grow as an individual, improve a particular set of skills by accepting more responsibilities, or work overtime for increased wages. Other than this natural movement of people within the workforce, there are three other primary causes for employee loss: retirement that happens due to age changes, natural wastage, and induction crises.
If employees are dissatisfied with their pay, consider the working environment unsafe, or think of the organization’s performance as unsatisfactory (which in itself can be a result of low expectations leading them not to try their best), these factors can often lead to high turnover. A lack of job positions or opportunities, as well as difficulties, stress, and dissatisfaction, are among the factors most often cited as indicators of high job turnover.
Factors such as insufficient pay, poor work morale, low levels of motivation within the work environment, poor selection and recruitment of workers, weak work organization as well as a lack of proper employee development can lead to a high labor turnover. The employees who provide their services may leave their workplaces to search for more suitable job opportunities, as the local workforce market may offer them better prospects. Figure 1.1 below shows some of the drivers to employee turnover, all of which will be used in this project model. There exist two categories of staff turnover: involuntary and voluntary (Mahesh, 2017).
To give an example, if an employee quits his/her job and is employed or absorbed by another organization, this act is called voluntary turnover because it is initiated by the employee. In contrast, involuntary turnover is carried out by the organization, an example being a company firing an employee over dismal performance or during the restructuring of the organization. Voluntary turnover, on the other hand, is often controlled by nature rather than the organization, with examples including employee death or retirement due to old age.
Under the umbrella of involuntary turnover, there are two vague expressions popularly known as being ‘laid off’ and being ‘fired.’ To be ‘fired’ is often a result of employees’ misconduct or underperformance, and it is seen, in most cases, as a sign of failure and inadequacy. On the other hand, employees who are laid off will typically lose their jobs because the organization cannot support the cost of retaining them, and they are let go to enable it to keep critical staff.
As such, in many instances, the general character of employees who undergo involuntary turnover is only slightly different than that of the ones who are there to stay. Voluntary turnover can be predicted by an organization and, in turn, managed by addressing the issues that increase the workers’ turnover intent. Most organizations that rely on human labor and services should treat voluntary turnover as the most significant issue that affects them.
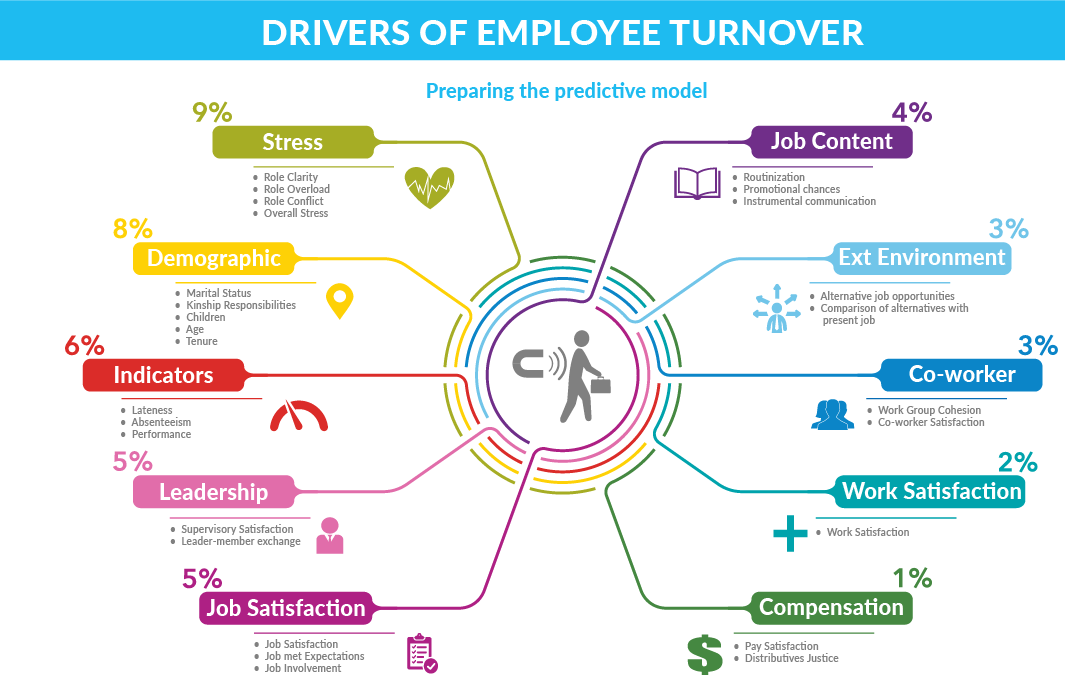
Under the umbrella of voluntary turnover, there are two branches that are generally considered equal: dysfunctional and voluntary functional attrition. Of the two, dysfunctional turnover is more dangerous to an organization because of its many forms that include turnover of minority employees or cases that involve women quitting, both of which undermine an organizations diversity, turnovers that result in the loss of knowledgeable and highly skilled employees, and situations that make an organization incur high replacement costs (Woods, 2015). Overall, this type of employee loss indicates that there are underlying issues in the organization that are likely to escalate in the future and create other problems.
In comparison, functional attrition does not harm the business, including the dismissal of employees that perform poorly and those with generally inadequate skills. All companies keep records for each of their workers, though their actions concerning this information vary significantly between different organizations. The information that is held in such records can aid leaders in the development of an effective retention management plan.
For a robust framework to be established, it is necessary to learn the degree to which attrition is a problem in the organization, dissect the turnover indicators, and create appropriate retention strategies. The Human Resources department’s systems should have records of all employees’ key performance indicators and history, including voluntary turnover, wages records, the time they have spent in their current position, and their active job history.
This extensive database of workers’ data within business individually, when possessed by the human resource department, can be examined to create an accurate projection of employee attrition. Another area in which the Human Resources department can be helpful is data mining, which can help pinpoint the traits of their most well-to-do employees as well as identify workers with a high turnover potential.
The data gathered, such as age, salary level, stock option, and educational background of their prestigious workers, can help the government focus on enlisting potential employees that are less likely to leave at an inconvenient time. Data mining is a procedure used by organizations to process large amounts of raw data into useful information. The importance of data mining has led to a rapid evolution of various models and methods, particularly those that create forecasts, due to the massive amount of stored corporate data. Older data processing methods could not produce the desired results either because of their inability to detect subtle patterns and statistics that only show themselves across a large sample size.
Data mining techniques were used to obtain data for this project that is going to help create a comprehensive model based on descriptive information given. The model presented can then be reproduced in different forms to understand the phenomenon of attrition better, explain its specific causes, and predict employee behavior. The significant distinction between statistics and data mining is that data mining is mostly automated and highly complicated, and people may not necessarily understand how the machine comes to some of its conclusion.
In contrast, the statistic is the assumption of a given event as an event is hypothesized by people to be happening based on the data available. As such, each result obtained in traditional statistics can be easily explained to a person that knows something about the topic, but people can also miss relationships that a machine will recognize. These use cases make data mining less used by experts, as it tends to work in hard-to-understand ways on real-world jumbled data and can create biases that people will be unable to recognize.
Tools that are used for data mining can predict coming trends and possible behaviors by scanning through large databases for subtle patterns, thus helping the business make effective knowledge-driven decisions (Leelavati & Chalam, 2017) and help answer questions that were formerly challenging to handle due to the sheer amount of time it would take to accomplish them (Leelavati & Chalam, 2017).
Overall, the data mining process aims to extract knowledge from already running database systems and convert it to information that can be easily understood by any human. For humongous industries like IT, BPO, and KPO, attrition can be a severe problem. It can be attributed to unsuitable work locations, poor salaries, unmet career advancement expectations, poor performance management, and a variety of other reasons.
To help curb the cost of attrition, organizations need to ensure that their workers’ career aspirations are satisfactorily met, as it is a known fact that for the increase in sales and revenue to be realized, the customer must be happy and satisfied, which is in large part caused to the satisfaction of the employees with whom they interact. Therefore, employees should be included in an organization’s significant activities, such as decision-making.
Companies usually do not care about the opinions of the workers, especially in the making of strategic, large-scale decisions for what is best for the organization. Instead, they tend to focus on purely numeric performance markers, such as return on investment and best service delivery for the clients. They treat staff members who interact with customers as expendable and try to extract profits from them as efficiently as possible by saving on their wages and well-being.
Some of the decisions, such as changing the brand of the product or policies that govern the business, may conflict with the interests, ideas, and opinions of staff members. As a result, many employees will likely be dissatisfied with the organization’s ideologies. Hence, they would be seeking to quit the job and find workplaces that make them feel comfortable, part of which is including their opinions in significant business decisions.
Many businesses invest large amounts of financial resources to ensure their employees are trained and provide them with promotion opportunities, improved work compensation, or wage increases, all of which they expect to help them retain employees. In addition to these measures that are being applied to help curb attrition, throughout this paper, the aim is to present the idea of logistic regression as a method of predicting the attrition risk attached to each worker and highlight the importance of attrition assessment using the said technique. Those workers who enjoy their work environment are more likely to remain employed with their respective companies.
Retention steps are significant as they help to create a more positive working environment that improves employees’ commitment to an organization. However, dealing with attrition issues in today’s business environment is a challenging task, as organizations struggle with high work turnover rates. These high rates of attrition are associated with high costs, which are categorized into two main branches: tangible and intangible.
Tangible attrition costs can also include enlisting costs, workers’ salary and benefits during the training period, costs incurred during the advertising of the vacant positions, and expenses incurred during the advanced training of an employee. Meanwhile, intangible ones, include unquantifiable factors such as a negative impact on employee productivity, loss of knowledge and morale, and other such issues that cause turnover and result from it. Some business groups calculate a worker’s turnover at 150% of the yearly wages of a current employee or one-third of a new worker’s annual salary. This percentage can be higher in demanding positions, such as management or sales, with figures reaching up to 250% of the yearly salary of an employee.
With this, it is clear that failure to keep a key employee for any organization is very costly in the long run, and an understanding of how human capital labor analytics works is crucial to all organizations, regardless of whether attrition is a current issue for them. Detection of underperformance in specific indicators can help managers develop and propose solutions for challenges that have occurred in the past. However, this method is not the sole area where analytics may be applied, as they can also help detect and address future issues.
Currently, in many business organizations, the management of erosion is more of a reactive exercise, whereby turnover is analyzed through a comparison of exit interviews of employees from different profiles and units. These organizations feel the need for risk assessment to help the management deal properly with attrition but ignore it as long as it is not an ongoing issue. Proactive predicting of erosion using the data mined from workers can lead to better decision-making that can prevent attrition from developing into a significant problem. This behavior creates value for stakeholders and saves on unnecessary expenses as a result of avoiding the loss of human capital.
Statement of the Problem
Attrition has been a significant challenge that affects most businesses, regardless of the geographical position, size, and type of industry in which the company is engaged. The effects of employee attrition on an organization include the disruption of organizational activities (which may lead to business failure) and the recruitment and training of new employees, which may be costly. As such, it is best to minimize attrition, and organizations worldwide are trying to determine its cause so that they can develop effective countermeasures.
They often try to understand employees’ satisfaction factors that may help reduce the rate at which they quit their jobs (Kumar & Melba, 2015). The reasoning is that satisfied employees would have fewer reasons to leave their positions, reducing the attrition to a more manageable level that is caused by other, less significant factors.
One of the most significant concerns regarding employee satisfaction and turnover is career adaptation, as employees who fail to adjust to their career at the position will almost inevitably leave. As such, the workers’ satisfaction with their career opportunities experiences, work-life balance, development chances, and training, as well as the career opportunities provided by the organization, are all noteworthy factors. Staff job worries, objectives, and plans and their association with job retention are essential for understanding how to convince them to stay in their positions.
An understanding of the differences between employees automatically enables the Human Resources sector to increase retention by addressing relevant issues for workers who are at risk of quitting. This information could also bring to the spotlight new ideas regarding the drivers of employee job-quitting. Informational interviews with employees cannot generate these insights because they do not provide enough information due to the small data set. The Human Resources data from the government of Dubai can be helpful in this regard, as it offers extensive information for analysis. Hence, this paper aims to examine the Government’s Human Resources data set and investigate why employees quit their jobs there to create a generalizable model.
Project Goals
The project goal is to obtain the intended results (performance goal) after a particular time (time goal) through the application of a certain amount of resources (resource goal). Performance goals, when formed clearly and supported by a verified possibility of accomplishment, can be used as a measure for goal achievement. In this paper, the system development project was established using resources such as datasets obtained from the Human Resources department of the government of Dubai. There is a large amount of data, which is enough to assist with project completion, testing, and deployment significantly.
The success of any business relies mostly on the employees’ performance, and they are consequently viewed as the backbone of the company. The primary goals to achieve will be as follows:
- The rate of job-quitting increases each year, especially in the United States, where it is increasingly being recognized as a significant concern. This project is focused on why the attrition rates increase and how they that was reviewed can be reduced in the short and long term.
- As the project’s development majorly focuses on analyzing specific demographics, seniority, income, satisfaction or dissatisfaction factors, and reasons to consider changing one’s job will be the primary identification targets for the model. Once attrition factors such as age, daily rate, monthly income, hourly rate, job level, distance from home, and monthly rate are identified, it would become possible for the Human Resources department of the government of Dubai to deploy measures that would effectively and efficiently minimize attrition rates. It is critical to take this measure and focus on workers, as their satisfaction will lead to the success of the company in the long term. One particularly noteworthy concern is management behavior, as dissatisfaction with one’s superior can be a strong predictor of attrition.
- The research project is also crucial, as it discloses arising issues amongst employees in companies. Therefore, companies have to assess the general opinions and interests of the employees regarding their work and the company, in general.
- The developed progression that determines attrition can be helpful to Human Resources, which can address its significant flaws by following the recommendations and suggestions provided by this paper.
- This project can also serve as a method of measuring the company’s general performance based on employee satisfaction. Thus, the obtained recommendations can also be applied in other fields where organizations need to measure the performance of the employees.
Aims and Objectives
Primary Objective
The purpose of this project is to help the Dubai Government’s Human Resources Department to reduce the rate of attrition by improving its retention strategies through interventions that are provided by the solution. The primary intent of the analysis is to remedy the situation of high-risk staff and develop a decision-making system that responds to differences between specific employees and conditions. When discussed in more concrete terms, the target can be described as follows:
- The goal is to apply a classification model, specifically logistic regression, to predict whether an employed staff member is likely to leave his or her position due to attrition to raise the ability of the Human Resources Department of Dubai Government to act on time and deal with the situation at hand.
Secondary Objectives
- To evaluate the factors that influence employee attrition in the governmental system of Dubai.
- As this model can be continuously used to find workers who are most likely to leave, it can help management reach out to them and negotiate with them so that they stay, thus resulting in tangible benefits created by the application of the framework. This ability can help understand trending behaviors amongst staff and develop remedies that can deal with controllable factors to prevent staff attrition.
- Obtain knowledge of the underlying factors that make the employees retain their jobs in some government sectors, which can then be applied elsewhere.
Limitations of the Study
This work has five main constraints: the sample selection, the method of data gathering and processing that was used, the low diversity of data sources, the reliability of the information provided, and the overall sample size. The data used in testing the model was obtained from the governmental department of Dubai only, and the majority of the participants in this project test were middle managers, managers, and supervisors.
They consisted of 52 Human Resources workers, 80 Research Directors, 83 Sales Representatives, 102 Managers, 131 Healthcare Representatives, 145 Manufacturing Directors, 259 Laboratory Technicians, 292 Research Scientists, and 326 Sales Executives. The conclusion and findings of this project, therefore, may not apply to other fields. Thus, the generalizability of the outcome of this project research is limited.
The data is gathered from a single moment in time. As such, it hinders the investigation of chances of reverse causality between employee attrition and personal results. For example, there is a possibility that company commitment can make the staff change their opinions of a business and make them more or less likely to quit. Therefore, there exist some conceptual factors that suggest that resemblance in individual and company values that may lead to changes in behavior and attitude over time (Silpa, 2015).
Beliefs and values affect behavioral intentions as they are diverse overall and reliable when contrasted to approaches and 165 behavioral objectives, which are increasingly dependent on the specific time and aim to identify particular practices. This research also depends on supervisory discernments for activity and performance measures within the context of the company. Even though it is assumed that supervisory discernments are reasonable measures of performance, the indirect sourcing of data provides an opportunity for a variety of biases to appear.
The variance introduced by the standard method is a potential flaw of the project. It is a flaw because the data based on individual values and company values were gathered from a single source. The outcomes, such as the association between employee attrition and factors that drive staff attrition variables, could be a reflection of this homogeneity. This research project is limited to managers and supervisors of specific departments of the company.
Hence, the outcome of the project cannot necessarily be generalized to cover other sections or different organizations. The sample size constraint also had some limitations, as the entire staff in the organization that was reviewed was more than a thousand. It made it challenging to cover all the data attributes and outcome possibilities of the employees in this survey. The number of staff included in this survey can be considered insufficient, concerning the sample size of about 100 employees in some companies. Therefore, limiting the scope of the research project and the data analytics may not cover the entire population.
Organization of Study
This project is organized into five chapters. The first chapter is an introduction to insights into employees’ reasons for quitting jobs data analysis. The method used for data analysis is also discussed in additional detail, with justifications of its usefulness. This project is based on a model that seeks to predict attrition, but it also supports the problem statement’s notion that a model can even predict employee attrition to achieve both the primary and secondary objectives. Chapter One also includes a discussion of certain factors that limit the study on predicting attrition through data analysis.
The second chapter is a literature review of the topic that highlights the history of the method and discusses how the other techniques have critical gaps. An understanding of the essential weakness of different analytical methods enables the created model to include additional attrition insights left out by other data analytical models. The following chapter covers the research methodology, including the specific information collected and processed, the data collection method, sample size, and the type of development methodology used along with reasons why it was used in the project development process.
Chapter Four contains a description of the project. Its sub-sections include model description, how it operates, and the processes involved from designing the model to its completion. The development consists of tests intended to judge the performance of the model and its success in passing these examinations. The fifth and final chapter summarizes the study using insights made using the model and external ideas about factors that drive employees to quit their jobs. The conclusion ends with a description of the implications that this research has for the Government of Dubai’s Human Resources Department and the possibilities for future studies.
Literature Review
Introduction
Company growth is generally not possible if the business cannot secure enough labor of adequate quality. Consequently, workforce maintenance is now the leading problem for many organizations. The rising employee attrition rate has made most organizations pay more attention to monitoring employees and their performance. The Human Resources top management is committed and put effort and care into fixing the challenges. In doing so, they have created several new human resource management practices intended to minimize attrition, though they have not been successful at addressing the issue to a satisfactory degree.
The workforce that exists within the governmental departments in Dubai consists of females and males in almost equal proportions. Research has reported that the preferences and orientations of females and males vary regarding professional matters (Amit & Aditya, 2016). The causes of employees leaving work are also observed to change depending on their gender. Among its other goals, this paper aims to determine whether the perspectives of male and female staff members concerning the effects of human resource management practices on attrition are the same. Gender differences are both easily observable and generally prone to having a significant impact on differences in views, and so, methods that adjust their approach based on the person’s gender should be useful.
In August of 2019, 4,478,000 employees left their jobs in the United States, which broke the record set in December 2000. The number amounted to approximately 3% of the total workforce in the United States, becoming the highest attrition rate documented by the BLS. With annual adjustments that account for seasonal labor patterns, the figure is closer to 2.4%, which is still tied for the top position. In August 2009, the non-adjusted and adjusted rates of attrition were 1.7% and 1.4%, respectively. With the changes in the economy that followed the 2008 crisis, workforce erosion rates began increasing. In 2018, the workforce attrition percentage increased to 2.9%, which amounted to 3.5 million American employees leaving their positions monthly.
The senior executive director of Robert Half, an international human resource consulting firm, Paul McDonald, told “CNBC Make It” that the attrition rate and the Job Openings and Labor Turnover Survey (JOLTS) report correspond to the observations made on employees within the professional environment. Workers are not afraid to enter the current job market, as it will typically offer numerous opportunities for candidates seeking a job.
The United States has developed a highly competitive labor market, where companies are willing to make excellent offers to secure skilled employees. According to the Bureau of Labor Statistics, the United States’ figures showed that there were about 7.3 million job vacancies in 2010, but the rate of unemployment was just 3.5% (Hess, 2010). As a result, there were more openings than people who could fill them, and the latter could pick and choose from a variety of options.
Various methods have been used to analyze attrition rates and obtain solutions that can prevent attrition. As a result, scholars have developed an excellent understanding of how the person-organization fit can affect job satisfaction. Planned activities that encourage person-organization (P-O) fit can be useful in minimizing the staff’s problems and result in better job satisfaction. To advance the association between person-organization fit and teams’ job satisfaction through support from supervisors, management should establish a definite form of reciprocation by assisting staff members in solving the challenges that they face.
According to Steven and Tadelis (2018), in their baseline results, they fund a robust, constructive association between employee retention and superiors’ management skills, a vital conclusion for high-skill organizations.
Their interpretation was constructed through the combination of many harmonizing research designs. Throughout their applications, the management skills of leaders seemed to reduce attrition among staff consistently. Managers who possessed superior people management skills generated a higher rate of performance than their less capable peers. They were more likely to get promotions, which indicated that organizations attached outstanding value to managers’ ability to affect employee turnover (King, 2016). With that said, it should be noted that people management abilities are of extreme importance to any company regardless of their effects on attrition, and so, some confounding may be taking place.
Data analysis typically involves the writing of code to process the data using some language or program, with the programming language Python chosen for this study. In Python, the most commonly used data analysis classification methods include logistic regression, Naïve Bayes, stochastic gradient descent, support vector machine, random forest, and decision tree, k-nearest neighbors (Analytics India Magazine [AIM], 2020).
A decision tree algorithm can be used to measure the rate of attrition and develop a model for future usage. One application of the algorithm can produce a decision tree of size 15 with three subtrees, though the misclassification rate can be as high as 25.2%. The utilization of the attribute indicated that Rank was relevant in 16% of cases, Sex attributes also showed usage of 16%, the Length of Service attribute was used 49% of the total cases, and Salary attribute always featured in the decision to leave at 100%. The finding indicates that the employee’s salary and the time that the staff member has spent in the position are the core factors that determine whether the employees are going to leave or stay in the company.
Multiple Regression Analysis was used to pinpoint the non-crucial and crucial factors or variables that might influence the attrition levels of an employee. The overall turnover score was considered as a dependent variable, with others including gender, location, and the global positioning of the business organization. The age of the respondent, number of hours worked, strength factors and human resource practices, wages earned, and experience in the organization were selected as independent variables, which might affect the dependent variables, most importantly the Overall Attrition Score (Kalidass & Bahron, 2015). With this arrangement, the relationship between the different variables and their relative importance can be established to double-check the findings of the other methods.
Critical Factors, such as workers’ wages, can be relevant, as those employees who earn higher salaries have higher levels of turnover than those who earn less. Moreover, workers who spend long hours working have a higher attrition level than their colleagues who work fewer hours. Age is a factor, as old employees tend to have lower attrition levels as compared to their younger counterparts. Gender is another aspect that plays an essential role, as it has been found that males tend to have a higher attrition rate than females, which can be explained by the ease with which men can change their geographical locations quickly regardless of marital status.
From Non-Critical factors, one can learn more about the skills of employees in the current organization. The number of people who attended focused training programs can help determine the commitment they have to the organization. Strength factors (employees who rank high in ratings for strength factors have a lower turnover risk), which include better human resource policies, new work policies, and excellent work ethics and values, are another vital consideration.
Workers’ likelihood of engaging in turnover goes down when these abilities increase, as the company becomes better at retaining its employees. Amidst all these regressions, researchers find that wages, strength factors, and human resource management practices have the most significant effects on the turnover scores either at 1% or at 5% levels (Thomas, 2015). With this knowledge, it would be beneficial to learn the relative importance of each of these factors to determine where resource investments would be the most warranted.
Research shows the importance of data mining in Human Resources Management Systems (HRMS). A clear grasp of the ideas contained in Human Resources (HR) data is essential to a business’s competitiveness and company decision-making. HR does not often actively analyze the information it has to understand relationships between employees and their states, as the primary purpose of HR information is to answer queries.
Human resources information fundamentally involves inserting data into the database for purposes of documentation after recording (transactional processing). Human resources management systems are typically more concerned about quantitative data. They illustrate how data mining software makes discoveries and obtains basic patterns from extensive data sets to find observable patterns in human resources.
As such, the paper’s goal is to show the capabilities of data mining in enhancing the procedural quality of the decisions made in human resource management systems. It also aims to make a proposal showing whether data-mining can increase performance and create a competitive advantage. Some studies outline data mining in a rudimentary manner, highlighting its uses in human resource management and providing a general overview of high-skill employee management. The literature review shows that most writers discuss the advantages of HR data mining applications over different types of applications.
There should be many applications of data mining in human resources to expand the overall understanding of the different factors that affect attrition. As a result, human resource analytics propose data mining methods for applications that can vary significantly, depending on the initial experience of their usage. They recommend the testing of data mining methods specifically in skill management data to find out the most accurate technique; attributes that are considered relevant can also be used as a factor to evaluate the correctness of the classifier. Future experiments that include relevant characteristics for an aspect should be allowed to pick a specific relevant factor for each of these attributes among those available.
Once the applicable characteristics are attained, concurring modeling phases can be created to analyze different factors, repeatedly transform the analysis, and obtain new perceptions as well as knowledge, which is critical to Human Resources applications. An investigation of the link in behaviors like absenteeism, tenure, lateness, demographics, and lateness on employees’ attrition in a rapidly evolving environment, such as the Indian software industry, has been done.
The distinctive part of some studies was the incorporation of five data extraction methods (discriminant analysis, regression trees, classification, artificial neural networks classification trees (C5.0), and logistic regression). After working with the information of 150 workers in a large software company, the research shows a correlation between employee attrition and withdrawal behaviors. The research gave rise to multiple concerns for future studies.
More studies could gather information on employee background situated as variables on more corporations to study the link within demographic variables and employee turnover (Nelissen et al., 2016). The extensive information on data and variables can be gathered cross-sectionally. Such a piece of data allows for more thorough scrutiny and also a smoother prediction model. The specific-content variables found of employees’ attrition that comes from this research would nudge a better knowledge of the occurrence. More specific experimental research must be done to produce a better project and to do cross-sectional research using the information within institutions to clarify the model. More study is needed on several specimens to check the justification of the hypothesis and the prediction model suggested in the research.
In another research study, the practicality of using the Probit and Logit techniques is being investigated. They are applied for assistance in solving regression problems and conducting nonlinear classification, with the ultimate intention of predicting a worker’s likelihood of voluntary and involuntary turnover. An instance that featured the voluntary attrition data of 150 skilled workers taken from a motor sales firm in central Taiwan was obtained and used using a sample size of 132 to demonstrate the application of a logistic regression analysis. The information was separated into two distinct categories: the testing data set and the modeling data set.
This paper uses a similar model, separating the knowledge that it uses into two sets that can be compared against each other. The modeling data set was used to test the Probit and Logit techniques as a part of its other applications.
The experimental outcome of the analysis indicated that the suggested techniques have high predicting abilities and that the two (Probit and Logit) techniques also offer a noteworthy alternative for predicting worker attrition in human resource management. The writers propose that attrition studies should move towards directions that have emerged as the result of the application of new methodologies and assumptions. These recent paradigms would also highlight fresh concerns and challenges (such as the applications of support vector machines and neural networks to solve classification problems for determining an employee’s likelihood of leaving).
There was a research study that was conducted to isolate the variables that affect voluntary employee attrition in North America’s professional labor market as represented by a set of 500 industrial manufacturing organizations. By examining voluntary attrition, it aimed to obtain a better knowledge of HRD efforts that could reduce voluntary employee turnover.
Fortune 500 industrial manufacturing offered a survey of worker databases for all staff in sales departments over the last 14 years. The initial database contained 21,271 complete entries that were differentiated based on a unique ID that was assigned to each worker. This research project adopts a design that features a combination of logistic regression analysis, correlation, multiple linear regression factor examination, and descriptive methods to investigate associations and provide some prediction methods based on the variables.
Initially, descriptive statistical approaches were applied to the statistics regarding baseline rates of attrition, years of tenure, and retention rates. The means for each gender, as well as for the population, which was differentiated based on its geographical location, ethnicity, educational level, and belonging to either the supervisor or the sales training participation group, were tabulated. Hierarchical descriptive methods also produced the mean wages by job position, ethnicity, gender, educational level, and participants’ training participation. In this study, data mining analysis began with descriptive analysis methods; this approach helped form a general awareness of the scope of the issue and determine the traits of the graphic piece of data.
The outcome of the detailed investigation provided clues as to the missing information as well as the size of the smaller groups that may have been skipped in the observations. Exploratory factor analysis methods were applied to find out the covariance amongst variables and to create a valid general construct. With the application of several classification approaches (untrained versus trained, non-Caucasian versus Caucasian, non-VTO versus VTO), additional analyses were carried out to find out the distinction within and between the various unique classes.
The last step was binomial logit regression used to test methods that would be employed to predict a worker’s tendency to retain their job continuously under changing circumstances. The Education division is one of the crucial departments for every nation, filling multiple vital roles in the economy. It was therefore picked for this research, which is primarily concerned with the long term. Similar to the education field, most other sectors in the United States are also suffering from staff attrition problems. However, the chosen area holds a critical purpose in the economy because it provides many other industries with an influx of new workers, which they require due to attrition.
Moreover, educational institutions hold an essential role in promoting an increase in the level of industrialization, poverty reduction, and scientific and moral advancement. The success of the academic system relies on the performance of healthy personnel (workers). In this research, predictive data extraction techniques (decision tree algorithms) were utilized to create rule-sets that can be employed to help recognize employees with a high chance of leaving the company in the near future.
Methodology
Introduction
The methodology is a system of steps, guidelines, and practices used by researchers to formalize their study, ensure its validity, and produce tangible results that others can use. It allows for usage of different processes, standards, themes, frameworks, and principles that assist in developing a structure and, consequently, increase the likelihood that a study will proceed on schedule and conclude successfully. The selection of a robust project management methodology is significant, as it helps the reader understand how the study should be viewed and what has been done.
The method used to analyze the data was selected based on its potential to produce the most relevant values to the Human Resources Department for the government of Dubai. It involves a manageable amount of work on the part of the researcher while also ensuring that the data analytics will meet the organizational objectives, values, and goals in the governmental departments of Dubai. Also, it has a limited positive impact on the complexity of the deliverables, the project size and cost, the risks involved, the constraints that the researcher has to deal with, and the expectations required by managers.
With regard to project management methodologies, there is no straightforward method size that fits all the cases regardless of the business industry, task, or available information. The departments working in cooperation with the government of Dubai are workplaces that feature a dynamic environment where there is a taste for transformation and change. These kinds of work conditions tend to create changes in employees over time, altering the principles they use and offering a diverse and constantly evolving set of activities that are done daily. Therefore, adopting a Rapid Application Development methodology is a suitable decision, considering all of the other aspects of the study.
Research Design
Target audience
This study is primarily targeted at any business or organization that employs significant numbers of skilled employees. Employee attrition is an arising issue that bothers many companies nowadays (Sharma, 2018). Many workers will frequently quit their jobs or experience involuntary attrition throughout their careers. These analytic data target managers who oversee Human Resources departments.
The HR analytics group, or a general analytics group that is tasked with working on this discipline, can choose to apply these analytic procedures to the human resource department of a company to guarantee the loyalty and high performance in employees and, therefore, increasing the ROI (return on investment). Through the use of this model, human resource analytics achieves more than the collection of data on employees’ performance.
Additionally, they will also obtain the means to offer insights into every step of data collection and further usage of the predictive model to make reasonable and sound decisions about how to enhance the procedures that are currently being used and suggest new ones. It also helps human resource departments determine the principal reasons for staff turnover, both voluntary and involuntary. Therefore, they can create solutions that they can apply in the organization as they discover reasons for attrition and insights on reasons that employees may have to retain their positions at work.
Sample size
The data contained 1470 employees from different companies in a variety of sectors. These employees can be classified as follows:
- 52 Human Resources workers
- 80 Research Directors
- 83 Sales Representatives
- 102 Managers
- 131 Healthcare Representatives
- 145 Manufacturing Directors
- 259 Laboratory Technicians
- 292 Research Scientists
- 326 Sales Executives
The data sample used for testing contained a variety of observations from the Department of Research and Development, providing specific insights regarding individuals and sales departments.
Data Collection Procedure & Instruments
The data was collected from the human resources sector of Dubai’s government. The data contained 1470 observations obtained from program documents, reports, and records. The observations consist of a survey of the work history and attributes of each of the employees featured therein. This collected employee data was used to create a model through classification methods that enable the development of a case study using observations obtained from expert and document reviews. Data mining was used to process the data that was collected and draw insights from it. The dataset had 35 variables, each of which had a dedicated category for it.
This dataset has eight categorical variables and 26 numerical variables, and the attrition statistic, though not necessarily independent unlike the rest or easily quantified, was the final item in the set. In table 3.1 below, data descriptions that were obtained from the HR Department of the Government of Dubai provide a more detailed insight into each of these variables. This data was used to encode information about individuals in the Python program that was developed to predict the attrition of employees. Wherever possible, the resulting values were expressed as numerical values. For example, a value of 2 in work-life balance means ‘good, if not necessarily excellent.’
Table 3.1. The Data Description.
Although there may have been some omissions, where people may not have had a particular statistic recorded at the time of data collection, that made the dataset incomplete, this possibility was not tested. As a result, the analysis did not omit values of zero, which is expressed in the Treatment column as Table 3.2 below.
Table 3.2. A Dataset with Data Type Descriptions.
System Development Methodology
The researcher used Rapid Application Development to create a prediction model that analyzed employee data. The approach is discussed below with an explanation of the basics of the strategy and the justification of its usage.
The Rapid Application Development (RAD) Methodology
RAD is a development framework model that primarily prioritizes quick prototyping and fast customer or client feedback as opposed to long development testing processes. With RAD, developers can make changes to the project without necessarily having to rewrite large sections of code.
Benefits of RAD
Rapid Application Development is a software development methodology framework that solely focuses on quick prototyping, releases, and updates based on the clients’ feedback. Unlike other methods such as Waterfall, RAD focuses on the use of software and clients’ feedback over laborious planning and the usage of a strict framework. Some of the critical benefits of RAD include:
- Increased adaptability and flexibility, as developers can easily make sudden changes during the development process;
- The ability to update to the product quickly and with minimal effort reduces the time required for development;
- The nature of RAD mandates the usage of generalizable code that can be applied in many different scenarios, which in turn minimizes possible error occurrences and reduces testing time by making it easier to spot the sources of issues;
- Because RAD focuses mostly on clients’ feedback, the resultant tends to be tailored to the customer’s needs, thus improving their satisfaction;
- Due to the small size of the development team, risk management becomes more comfortable and achieves better results, as there are fewer risk factors, and managerial oversight is easier;
- There are fewer unexpected events with RAD; unlike Waterfall methods, RAD included integrations early on in the software development process.
Shortcomings of RAD
- Strongly reliant teamwork; if a single person tries to develop a model using RAD, the difficulty can be overwhelming;
- Also can be challenging to manage when working in a large team;
- Dependent on high-skilled developers who can be trusted to deliver high-quality code without the need for extensive testing;
- Needs clients input throughout its entire product cycle;
- Best suited for projects with minimal development time;
- More complicated in implementation and execution than many other popular approaches;
- Restricted to modularized systems, with performance declining sharply in complicated monolithic applications.
The Five Steps or Phases of RAD
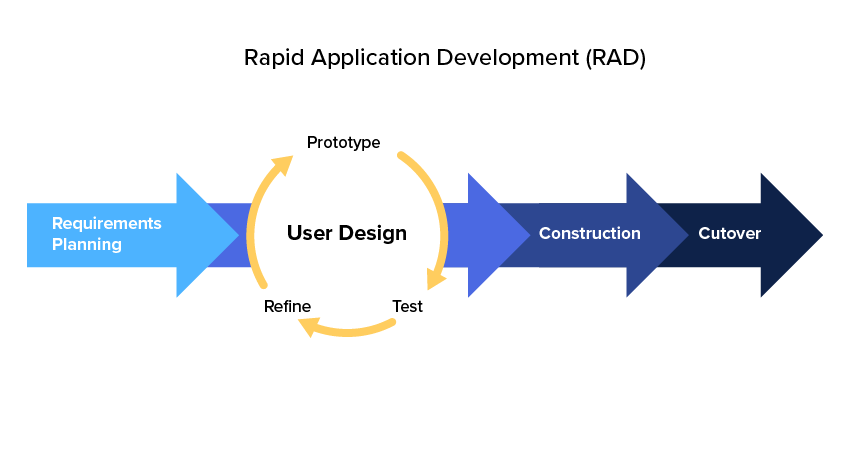
- Stage 1. Requirements and Planning. In this initial stage, the respective stakeholders gather together to define and codify project needs, objectives, budget, timelines, and expectations. Once all aspects are clearly outlined, they proceed to look for management approval.
- Stage 2: Prototyping. Once the first stage is completed, and the management accepts the scope, the development of the product begins. Here, the designers and developers work closely with the client to create and improve prototypes until a working product is ready.
- Stage 3: Refinement. In this stage, prototypes and earlier, possibly incomplete, systems are modified and developed until they become functional models. The developers then receive feedback from users to help improve the prototype to create the best product.
- Stage 4: Testing. At this stage, the product software is tested after the incorporation of the latest user feedback. The product is checked and tested to ensure it works as per the client’s needs. The collection of feedback continues, and the process goes back to stage 3 until the client is satisfied with every aspect of the program.
- Step 5: Construction. The last step before the finished product is launched; this stage involves the incorporation of the project into the client’s infrastructure. Their workers are trained to work with the software, and their database is integrated with the program where necessary.
- Step 6: Cutover. The client starts using the software fully without intervention from the developer. If the developer has succeeded in their task, the software should be working perfectly, and there should be little to no further contact between the developer and the client regarding the matter.
Methodology Justification
RAD is an approach that differs significantly from many other development methods due to its narrow orientation. The main significant difference is its superior speed, as RAD focuses on the pace of development of a product while other approaches focus on guaranteeing its reliability with minimal future support from the developer. One of the unique qualities of RAD is that it is oriented at a single team with few members. This focus provides the opportunity for a faster communication network that results in quick information transfer. Other methods target larger organizations, which are often subdivided into smaller teams and have low flexibility as a result; the Waterfall method serves as an excellent example.
As the rapid application development model is based on speed, the resultant outcome is that the development time is halved when compared to other frameworks. RAD tends to produce many prototypes before the final product and present each to the client. This process takes less time each time, as more and more of the client’s needs are met, and their list of requests diminishes. Rapid application development is focused on maintaining the participation of the client throughout the development process, unlike other models that only incorporate clients at the beginning and the end of the development process.
Project Description
Materials and Methods
The data analytics are categorized into various types using the classification model. These are shown in table 4.1, which also features their accuracy and F1 score as the differences that help identify the gaps (AIM, 2020). The accuracy was calculated as the proportion of cases in which the model accurately predicted the employee’s attrition or non-attrition. The F1 score is defined as double the result of dividing the product of the precision and recall by their sum. Here, the precision is the result of the division of the number of positives that the model predicted correctly by the total number of predicted positives. The recall is the result of the division of the number of correctly predicted positives by the total number of actual positives. Software was used to calculate the F1 score, and as intermediate results, neither the precision nor the recall were produced explicitly.
Table 4.1. Algorithms Classifications.
In this project, the classification algorithm used is the Logistic Regression Algorithm. Among the various algorithms used in Python data analytics, it appears to be the most suitable for this task because of its particular properties. The Logistic Regression Algorithm has an accuracy of 84.60%, which makes it highly appropriate for finding the most accurate results in data analytics.
Data Pre-Processing
The pre-processing process involved the initial analysis of the information provided by every employee included in the sample to find some general trends and obtain some ideas about the people with whom the work deals. Usually, this stage would also incorporate the application of some method of treating missing values in the dataset, but as mentioned above, that will not be necessary in this case. The results of the analysis are listed in table 4.2, which provides a variety of statistics for each variable.
Table 4.2. Overall Employee Dataset Pre-Processing Details.
The purpose of the pre-processing step is to transform the data into a version that is easier to analyze using standard tools and to provide some frame of reference for other methods. It is not intended to provide any information that would be relevant to the client by itself, though the broad overview of the sample that it provides can be helpful. The analyses that use the original dataset and the preprocessed values are presented below.
Data Exploratory Analysis
Logistic regression analysis is an excellent tool for predicting the likelihood that a binary variable, such as whether an employee will leave soon, will take one value or the other. As such, it will be at the center of this paper, though there will also be other analyses that supplement it. The logit function will be used to construct a probability value map in this case, which can be defined using the formula:
for i = 1…n, where βi is a weight coefficient attached to each of the values involved, which are represented by xi, and β0 is an additional base value. The justifications for these weights and additional explanations of the values are included below.
Main Assumptions
The controllable variable, which is whether the employee in question will be affected by attrition, is binary and can only assume one of two values. Therefore, there should be no outliers in the data, a trait that can be fostered by changing the continuous predictors to standardized scores and dismissing values below -3.29 or above 3.29. In addition, there should be no multicollinearity (high correlations) within the predictors.
A correlation matrix can assess this variety of behavior among the predictors and identify cases where corrections are necessary. It is a reasonable assertion that as long as correlation coefficients among independent variables are less than 0.90, there is no need for concern about multicollinearity. Additionally, various pseudo-R2 values have been created for binary logistic regression. However, there are computational concerns that can inflate or undervalue these results, and caution should be used when viewing them. There is a variety of tests that can be used to assess whether any such issues are present; Hosmer-Lemeshow is a commonly used measure of accuracy and suitability that is based on the Chi-square test.
Bivariate Analysis – Numeric (T-Test) and Categorical (Chi-square)
Bivariate analysis was one of the methods used to explore the data. In table 4.3, which is presented below, the Chi-Square test was used for the variables, and Gender, Relationship Satisfaction, Performance Rating, and Education were found to have a significant relationship (p<0.05) with Attrition. On the other hand, Years since Last Promotion, Percent Salary Hike, Number of Companies Worked, Monthly Rate, Hourly Rate, and Employee Number are insignificant (p>0.05).
Table 4.3. Bivariate Analysis
Bivariate Analysis with Transformed Variables – Numeric (T-Test) and Categorical (Chi-square)
Some variables were misrepresented in the original analysis and warranted a transformation so that they could be viewed more accurately. 4.4. In table 4.4, the Chi-Square test Gender, Number of Companies Worked (new), Training Times Last Year (new), Relationship Satisfaction, Performance Rating, Education and Department have been found to have a significant relationship (p<0.05) with Attrition. Moreover, T-Test Years Since Last Promotion, Percent Salary Hike, Monthly Rate, Hourly Rate, and Employee Number are insignificant variables in the relationship (p>0.05).
Table 4.4. Bivariate data analysis with transformed variables.
Several dummy data sets were created to assist with the process, and they are listed in table 4.5.
Table 4.5. Dummy Variables.
Variance Inflation Factor (VIF) Multicollinearity
Multicollinearity is a concern for the variables, and so, variance inflation factors (VIFs) were calculated for analysis. A total of forty factors were created, with some of the variables receiving several, and the results are presented in table 4.6. Monthly Income, EducationField_Medical, and EducationField_Life_Sciences have a high variance inflation factor, which is indicative of their multicollinearity and tendency to change alongside each other (VIF>10). One of the variables needs to be discarded before the model can be constructed because otherwise, it will be biased due to inflating or nullifying the influence of each multicollinear factor. In this case, EducationField_Life_Sciences will be dropped; the specific choice does not make a significant difference, and this value is among the less noteworthy ones.
Table 4.6. VIF Factor Values.
After the cleaning of data, feature engineering, and EDA, significant features could be selected without concerns about the potential failings of the choice. As such, the model was ready for the initial prediction attempt on the dummy sets. The results are presented in table 4.7, which introduces two additional variables.
Table 4.7. The data outcome from cleaning.
Model Build and Diagnostics
The model was built using sklearn, a free machine learning library for python, which enabled the author to save time on the development of the algorithm. Logistic regression provided an accuracy of 88.43% on testing data and 88.09% on training data. The similarity in accuracy indicates that the model performs consistently and reliably, achieving a high standard of accuracy. Gradient Boosting provides an accuracy of 86.05% and 92.85% on testing data and on training data, respectively. Similarly, the over accuracy is high, though the disparity in accuracy between the two sets gives the researcher some cause for concern.
In Random Forest, testing and training data reach an accuracy of 86.39% and 98.04%, respectively. The potential accuracy is the highest for this set, but the disparity is also the most significant, which implies that there exists a significant possibility that this result is an outlier rather than the norm. Overall, the accuracy of all three methods is satisfactory, and logistic regression’s highest consistency indicates that it is the most suitable for usage.
Logistic Regression
This algorithm defines data and expounds the association between one dependent binary variable and one or more ratio-level, interval, ordinal, or nominal independent variables. The data used here is expressed as categorical variables that adopt both binary and multinomial logistic regression. The method can accommodate both types simultaneously, which significantly improves its generalizability. As such, it was logical to try applying it first before trying other approaches.
Logistic Regression Results
Dep. Variable: Attrition, No. Observations: 1029, Model: Logit Df Residuals: 991, Method: MLE, Df Model: 37, Date: Sun, 16 Feb 2020, Pseudo R-squ.: 0.3418, Time: 16:28:20 Log-Likelihood: -309.86, Converged: True LL-Null: -470.80 and LLR p-value: 3.954e-47.
Table 4.8. Logit Regression Results.
Model Evaluation on Training Data
The Gini Index for the model built using the training Data is 74.51%.
Table 4.9. Gini Index.
Finding the cutoff value
Actual 176.0, Prob 176.0, Predicted 0.0, Tp 0.0, Fp 0.0, tn 853.0, Fn 176.0 and Dtype: float64.
Sensitivity, Specificity and FPR plot
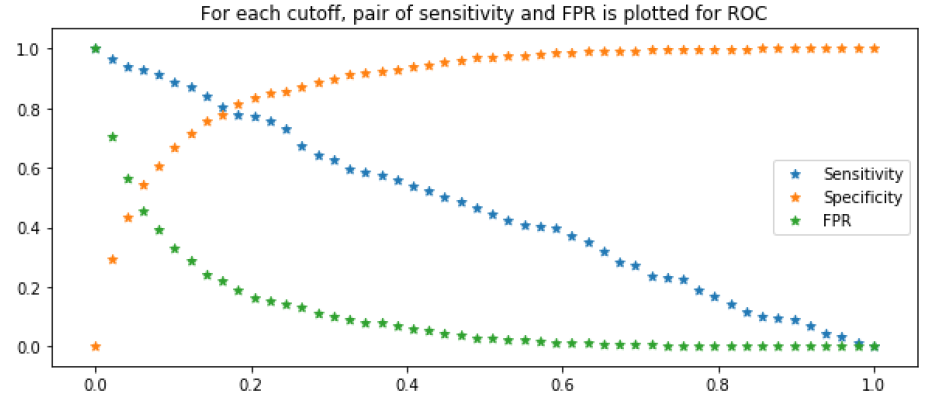
Finding ideal cut-off for checking if this remains same in OOS validation
Cutoff sensitivity specificity total
0.204082 0.772727 0.835873 1.608601
The final cutoff value for training data is 0 0.204082, and it guarantees high values in both sensitivity and specificity.
Model Validation – Testing data
The testing the coefficient stability using p-values and sign has provided results that are presented below.
Logit Regression Results
Dep. Variable: Attrition, No. Observations: 441, Model: Logit Df Residuals: 403, Method: MLE, Df Model: 37, Date: Sun, 16 Feb 2020, Pseudo R-squ.: 0.3341, Time: 16:28:31, Log-Likelihood: -118.02, converged: False, LL-Null: -177.24 and LLR p-value: 1.864e-10. Table 4.9 shows the coefficient and sign values obtained as a result of the analysis.
Table 5.0. Coefficient and sign values.
Discussion
The bivariate data analysis of both chi-square and T-test initially showed that 237 workers were likely to leave for whatever reason, and 1233 employees would probably remain in their positions. Some additional investigation also enabled the researcher to pinpoint the records whose owners would likely leave in addition to determining the total number. As a result, the people featured in the data set could be separated into two groups, defined as “attrited” and “not attrited.” Figure 1.4 below shows that employees age 19 to 36 are more likely to be affected by attrition when compared to those older than them.
There are two possible reasons: the availability of a variety of career paths to a younger person, many of which can involve leaving for another department or company, and the possibility of a mismatch between a new job market entrant and their current profession, which may lead to underperformance and possibly their termination. The firm may retain such individuals and try to help them develop, as they may merely need training until they reach the age of 32 to 33, where staff staying rate is higher than the leaving rate.
As people age and reach 37 to 55, they become less likely to be subject to attrition, as this category likely consists of people who have been trained by the organization and are considered organization professionals, possessing the skills to remain at their current position and the motivation to keep working there. However, by ages 51 and 52, attrition rates begin increasing among worker populations once again. The most likely reason is that they start retiring due to old age and the emerging health concerns that are associated with it.
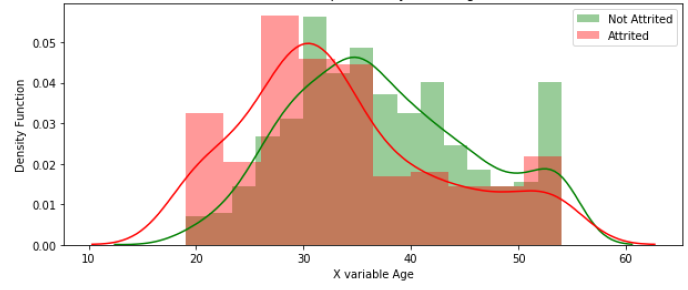
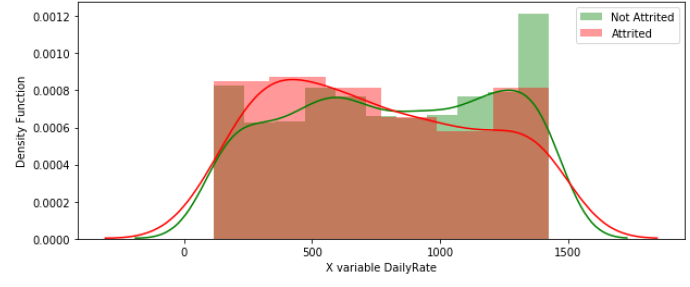
Figure 1.5 indicates that employees who receive a daily rate of 100 to 750 units are more likely to undergo attrition than not. It is expected that workers who receive low pay feel dissatisfied with their positions and are always looking for a better opportunity, leaving once they find it. There is a change in this tendency, with turnover and retention equalizing between daily rate values of 750 and 1000, likely because workers are generally satisfied but take opportunities if they see them.
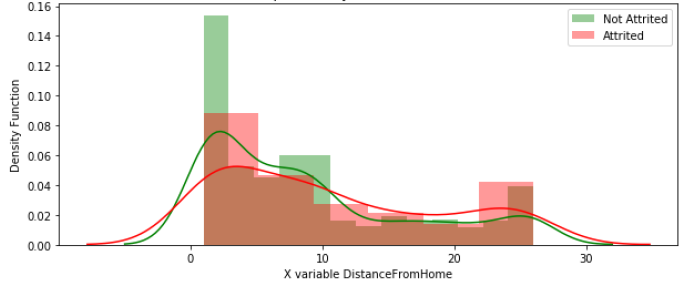
At above 1000 units per day, the staff appears to be attached to their jobs, most likely because they know that they are close to the highest wages they can currently attain and want to keep their current position. With that said, distance from home is another significant influence, as depicted in figure 1.6. At a distance of 2 to 3 km, the employees stay at work rather than leave, likely because they appreciate the convenience and low expenses of travel.
At intervals of 3 km to 7.5 km, employees become considerably more likely to change jobs, but from 7.5 to around 11, they once again choose to remain. One assumption is that they work remotely and only have to visit the distant workplace occasionally, and thus the distance is not a concern. As they would not work entirely remotely, they would be listed as living at a distance from their workplace instead of having the distance be irrelevant and, therefore, equal to 0. However, they would quit long-distance workplaces that are located at intervals above 11km, as shown in figure 1.6, indicating that these conditions are incredibly inconvenient for them in many cases.
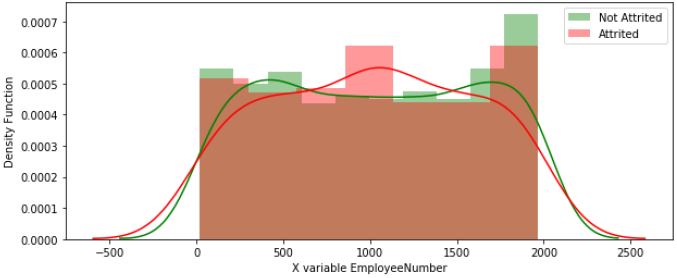
The employee number does not have such much effect on employee attrition, and the chances of leaving or staying are mostly even, as indicated in figure 1.7 below. Employees do not appear to be particularly concerned about the size of their company as long as their needs are adequately addressed. With that said, a spike in attrition emerges at approximately 1000 employees, which is challenging to explain without additional context. One possible reason is that companies that reach 1000 employees struggle to adapt to their new size and, therefore, begin treating their employees worse as they try to transition. However, it is also possible that the difference is an outlier, as is the slight spike in non-attrition at the higher end of the range.
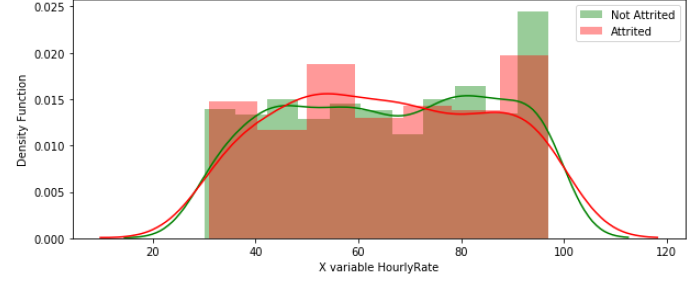
The hourly rate graph, depicted in figure 1.8, indicates a similar picture, with mostly even charts. There are also outliers in the middle of the graph and possibly on its right end. Employees may be dissatisfied with an hourly rate of 50-60 units, feeling that their work is not valued enough. However, those who are paid less do not appear to be as concerned, warranting a further investigation into the effects of low pay on the worker’s intention to stay. In the higher end, there is some tendency of non-attrition prevailing over attrition, which may indicate overall worker satisfaction. There may be a relationship, but it is not necessarily strongly significant in the same manner as some of the others.
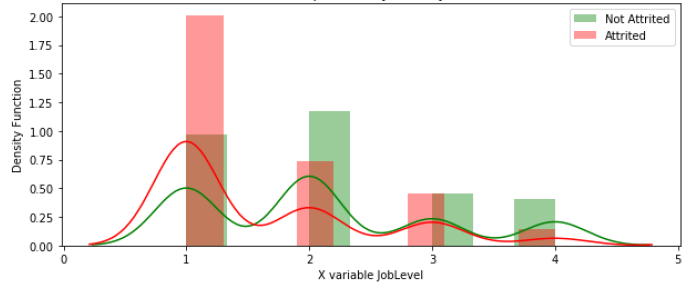
Generally, workers in low-ranked positions are more likely to leave or be fired than those in more critical places, as shown in figure 1.9. They are not as valuable to the organization, and it makes less of an effort to retain them, sometimes intentionally tolerating a high turnover. With that said, workers whose job level was quantified as 2 are more likely to stay than to leave. One possible reason is that they know that they are likely to advance in the business if they keep working there and do not want to jeopardize their chances by leaving. Meanwhile, managers at the top are more likely to stick to their work due to their excellent compensation and the company’s active efforts to retain them.
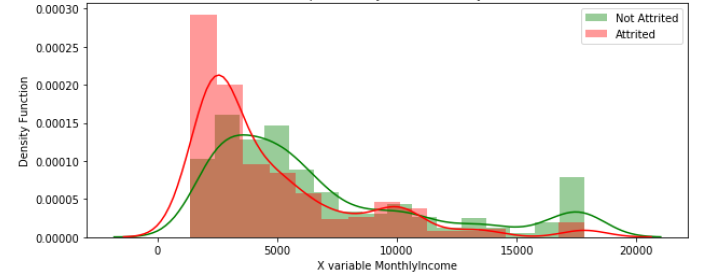
Figures 2.0 and 2.1 indicate monthly incomes and rates, respectively. The money that one is paid does not necessarily affect their intention to leave, and overall, the turnover density is distributed evenly. However, the income brackets, which constitute their rate after various expenses are deducted, have a more prominent and demonstrable effect. People like having a disposable income and will leave to obtain a higher one while staying if they consider it adequate. In figure 2.0, staff members tend to quit jobs that leave them with a small income, although as the amount that they retain rises, the employee sticks to these jobs.
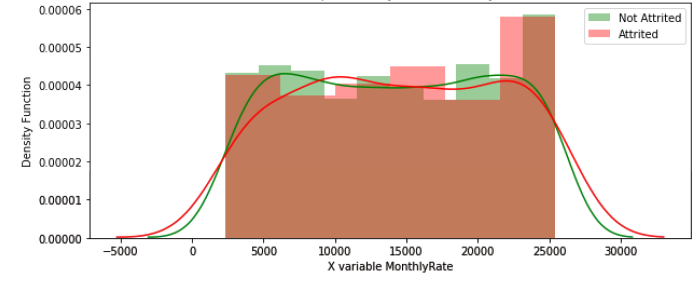
The monthly rate tends to impact the decision of staff members to quit somewhat, but the effect is not as significant as that of the hourly rate. In figure 2.1, workers tend slightly to stay at low pay, which typically means that the individual may be working at a lower-level job. The reasons are either that they do not have any alternatives and remain in a position that can help support their life or that they value their career prospects more than their current pay. Therefore, from 2500 to almost a 10000 monthly rate, the attrition and non-attrition are generally more or less equivalent, and most differences can be considered the results of some additional factors or other outliers that will be equalized with higher sample sizes.
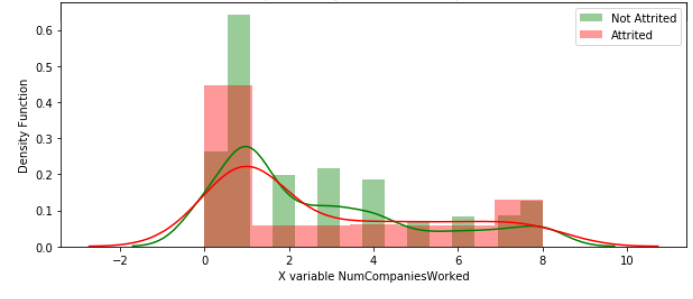
The number of companies a person may have worked for can affect their decision to leave. People who have never held a job before may find themselves not suited to the profession or the specific organization. They would then use their newfound experience to find a better option and stay loyal to it, as shown in figure 2.2. Notably, people tend to remain agreeable and remain in their positions even when working at their second to the sixth workplace.
The reason is likely that most of them have found their niche and intend to stay there. Moreover, they should be experienced by that point and give management no reason to fire them. However, people who have worked at seven companies or more appear to have chronic disloyalty issues or have grown old throughout their careers, becoming more likely to be affected by attrition as a result.
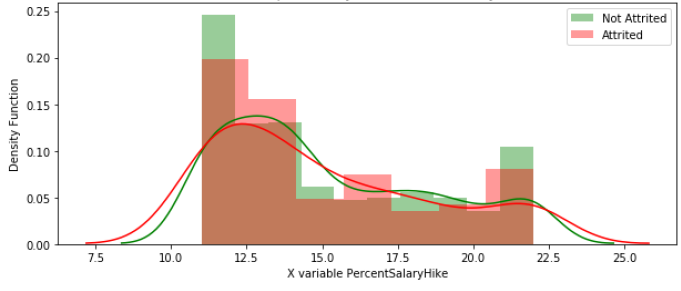
Salary hikes (figure 2.3) are not a significant cause of turnover at between 11.5% and 12.5%, in contrast to the range between 12.5% and 13.5%, where the attrition rate is higher. A raise is often considered a significant gesture of goodwill that reduces the employee’s likelihood of leaving, but the method may not be altogether effective. However, as salaries increases, so do workers’ needs, causing employee attrition due to lingering dissatisfaction with the current salary, as demonstrated by the graph from 11.5% to 13.5%. From 13.5% to 15.5%, the individuals might be happy with the increase and choose to stay more often. Staff members would only change their mind and leave after a raise between 15.5% to 17.5% if they have other well-paying work opportunities awaiting them, but choose to stay again at ranges between 17.5% to 21.5%.
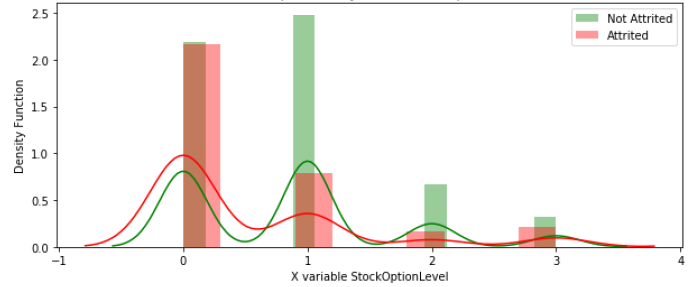
Stock options are a strong reason to dissuade the employee from leaving, as they are typically rendered invalid should the person choose to do so. As a result, while their absence does not factor into the decision, the presence of a stock option package is highly likely to convince the person to stay. The factor is highly significant at levels 1 and 2, but less so at level 3, which is also the highest. People who occupy the most well-paid positions may not be concerned over money and leave regardless, or they can be at the retirement age. With that said, stock options are typically reserved for upper management, which tends to be committed to the company already, so the approach may be ineffective or inapplicable for employees who occupy more ordinary positions.
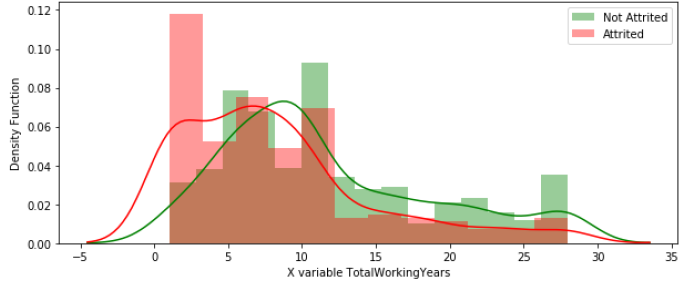
The number of years someone has worked can also influence the rate of attrition. People who have worked for one to five years have a higher rate of turnover. They are still shaping their career, choosing their occupation, and deciding on whether to commit to a company, which makes them prone to leaving. Between five and eight years of experience, many may stay due to promotions or significant salary hikes within a company.
Also, from 20 years and beyond, people tend to stay as they have a close and strong relationship with the company, leading to a low rate of attrition. The employees who have ten or more years of experience are often highly valuable experts who receive great benefits. The company may need experienced professionals who can solve various company problems, thus achieving a high income. On the other hand, the top management individuals may need to stay as the work pays well with reduced workloads. Overall, time spent working is an excellent motivator for a person to remain affiliated with the organization, as long as it is rewarded with the appropriate recognition.
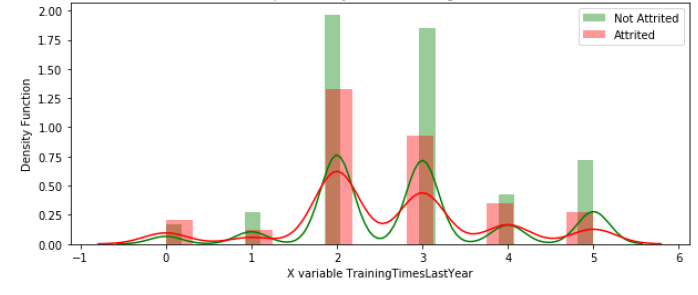
Figure 2.6 shows a similar tendency, as the untrained staff members tend to quit more than others. Training correlates with experience and workers who have been trained a lot may be grateful to the company or have skill sets that are highly suitable to its needs. On the other hand, those without training tend not to care, possibly because they do not recognize their lack of skill, and be equally likely to stay or leave.
Employees with no proper training may lead to wastage of firm resources as they may get paid but do low-quality work. Alternatively, they may leave if they feel that the work generates a lot of pressure because they have limited knowledge. Thus, they would quit to seek a less stressful job, whether due to the relaxed work environment or a better fit for their current abilities. The trained staff may stay voluntarily because they are comfortable doing their job and do not have to worry about being dismissed. Overall, training represents an investment by the company into the employee, which indicates that it values that person. As such, it would probably also take other measures to secure their loyalty and reduce attrition.
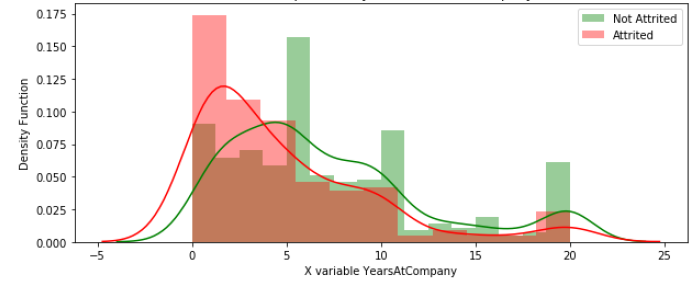
Years that a person has spent at the company will typically have a similar effect on the person to that of their overall career length. People tend to stay where they are comfortable, and initially, a person may not like staying at an organization. Thus, throughout their first five years at the company, they may decide to leave or have to do so by circumstances such as work contract expiration, termination, or others.
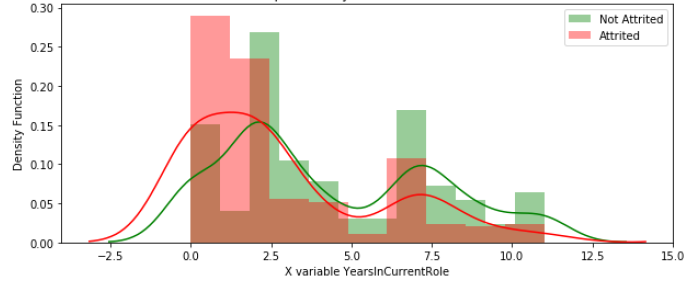
This tendency is reflected in figure 2.7, and it also applies to figure 2.8. Workers who have spent a considerable time at the company or in their role are typically committed to it and thus unlikely to leave the business. The same tendency can also be observed in figure 3.0, indicating that managers are strong determinants in one’s intention to stay. This finding is consistent with the claims in the literature that managers can affect the satisfaction and performance of their subordinates significantly.
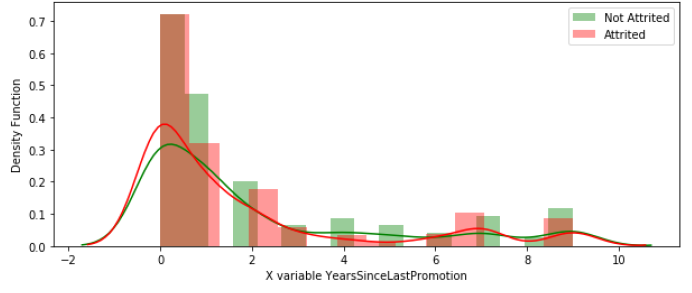
The time that has passed since one’s last promotion can be a somewhat significant predictor of whether an employee is going to leave. The fact that they have received the promotion indicates that the company values them, and they are unlikely to be fired. As such, only voluntary attrition has to be considered for the most part, though old age and illness may have a smaller influence. Workers who have been promoted recently appear to be happy with their situation, as their efforts have been rewarded.
People who have stayed in the same position for a long time are likely satisfied with it or occupy a top management spot and cannot be promoted further. As such, people in both of these positions are slightly less likely to undergo attrition. However, curiously, people who have not been promoted in the last four to five years, when they might be feeling that it is time for another promotion, are the least likely to leave. This finding warrants an additional investigation that will determine whether it was an outlier and the causes behind it.
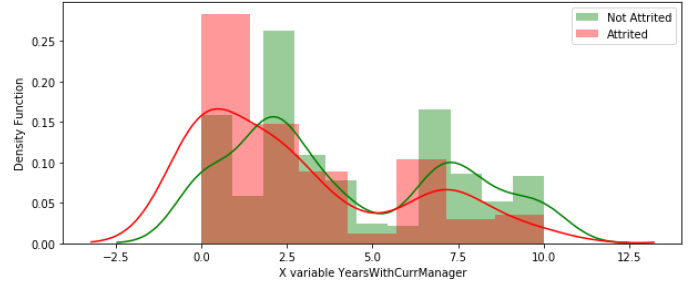
Overall, there is a high turnover in job level one staff and less so in others. The time one has spent working is also significant, with employees whose careers are 0 to 12.5 long quitting more than the average, with attrition rates descending with level or years increase. The same happens with the time spent at a company, with 0 to 5 years being the danger area. Employees with monthly income or a monthly rate of around 2000 to 4000 units also have a high attrition rate.
Other than these, one’s age and years spent in the current role or with the current manager are also significant predictors of attrition. The rates of employee loss are higher than retention at the lower bound of each of these characteristics. Staff attrition may also be higher for frequent travelers because of the interest in new experiences that leads them to do so. Meeting new people can lead to new opportunities or change at heart due to new ideas to do something new. On the other end of the spectrum, people who do not travel often may be more comfortable staying safely in their current job without taking risks.
In the sales department, the rate of attrition is higher than the other departments used in the study. Sales department work can be tiring due to the need for continued interaction and negotiation with various people. The attrition, therefore, can be voluntary to escape the overwhelming labor work done is sales firms. Alternatively, one may be fired for the lack of skills or not meeting the requirements in sales, as businesses in that field often have large pools of potential hires and do not invest much in training workers. There is also high turnover among individuals with a low education level, which is defined as those who did not attend college.
These unskilled individuals are often not required by firms except for low-skilled jobs that do not rely on knowledge or the ability to learn. Sales departments may be an area where many high school graduates go, as they typically require communication skills, which one can learn naturally in school. The demanding yet poorly compensated work may tire the workers, making them quit. Additionally, such jobs may be non-permanent and based on a short-term work contract, after which the company releases the employee back into the labor pool.
The human resource education field of study seems to be the factor that drives attrition the most. People who study in such courses tend to quit because they have high expectations that are not matched by the reality due to their lack of experience. As such, they would be likely to leave if they felt that their abilities and achievements were consistently underrecognized. However, eventually, they would understand the functioning of the corporate system and settle down in their second company or the ones after that. Another finding is that male employees tend to leave work more than their female counterparts. Men are overachievers, and they may seek new jobs to gain experience or be open to new ideas to do something else.
As mentioned above, the sales representative’s job role can be taxing, making one quit. Most firms have rules to follow and perform door to door sales, which other employees may not like. These kinds of jobs often feature low pay, especially compared to the effort involved, eventually leading employees to quit.
Other reasons to leave may include weak involvement in one’s job, where workers may not be included in big organization decision making or become confused by the disputes between members of executive management. As a result of this low involvement, workers become less committed to the organization and never develop a relationship with it that may prevent them from quitting when offered the chance. They may quit jobs for higher positions at other companies or consider personal conflicts with other people sufficient causes to leave the business.
Overwork is the final significant predictor of attrition, as workers can leave their job to find one where such an issue is not present. For instance, in medicine, professionals often have to work overtime because of the unpredictable nature of the patient flow, which can lead to burnout and them leaving their job even though there are no other opportunities. Relationship satisfaction is also a driver of attrition, as the interactions between colleagues are significant.
There may be tension between team members of the same or different levels in an organization. For example, if managers disrespect their subordinates or abuse them, whether intentionally or otherwise, the workers affected may decide to quit. Finally, unfavorable work-life balance can make one quit the job. If one has to devote a lot of time to a position for inadequate wages and does not have enough time to themselves, they will begin to look for opportunities to find less demanding work actively. Relaxation and maintenance of one’s mental state are critical to the continued upkeep of productivity, and this factor warrants extensive consideration.
Conclusion
Overall, this study has contributed some unique insights into the topic of worker attrition and its causes. It has aided in understanding the intricacies of the position and roles of the Human Resources department in a given organization. The research helped determine the most crucial reasons responsible for workers turnover in a given organization as well as examine their influence in additional detail. The study has helped illuminate the prominent concerns of the workers and create a model that companies can use to do the same.
Human resources managers have likely understood that many of these factors are impactful for a long time, which is why they have been collecting this information. However, with the multitude of factors involved, they might have struggled to understand precisely how the relationship functioned, a lack that this paper aims to address. The attrition reasons disclosed, such as aging, monthly salary, distance from home to work, job level, time since the last promotion, and years spent in an organization have proved to contribute to both voluntary and involuntary turnover rates.
The research has advanced the understanding of the crucial points responsible for workers turnover. It also underlined the well-known fact that the opportunity for growth and development is most important to employees of an organization. As long as a company provides its workers with guarantees of meritocratic advancement, they are happy to keep working for it. On the other hand, the promise of a high salary does not necessarily motivate many employees. Throughout history, many firms have used cash and high financial gains for their workers.
Yet, their top employees keep changing jobs regularly because there is almost always a company that can make a better offer. Others have balked at the demands associated with this high pay, such as extensive amounts of overtime work, and chosen to leave due to stress. Such people will come in for the job, especially if they need money, but once that is no longer the case, they will obtain a different set of priorities. As such, if the organization does not adapt to suit them, they will look for one that does.
An employee is currently becoming viewed as a long-term investment rather than a source of immediate income for the company. This approach aligns with people better than the purely utilitarian view of the past, as it enables them to form a mutually beneficial and friendly relationship with the company. The study has shown that people respond positively to initiatives such as training and become much more likely to stay at the company. Moreover, it shows that the initial period is crucial, as a large portion of all departures happen early on in the person’s career or tenure at the company. As such, human resources departments have to decide whether they want to try to retain such workers actively or let them go.
Ultimately, attrition has some benefits by filtering out unsuitable workers and ensuring that the job market has professionals that can suit an organization’s needs. As such, eliminating it would be both challenging and harmful rather than beneficial. Human resources professionals can use the study’s findings to determine an approach that will reach the optimal balance after they learn what that position is.
Recommendations
The primary task for research that follows this study would be to check the validity of its results and their generalizability. Manufacturing organizations were selected for this study because they seemed more straightforward in their organization and the type of person that fits them. However, both the scope of the selection and the range of people involved have been limited as a result. Therefore, future research might address this issue by including all varieties of workers and industries in their studies or using more objective performance measures, if available. One method through which such objectivity can be achieved through the collection of data on personal and organizational values separately from different groups of organization members.
For instance, data on organizational values may be collected from employees with relatively long tenures or top managers who have a high level of knowledge on corporate culture, while another group of employees could be asked only to provide data on their values. Alternatively, researchers can source information from a variety of industries and analyze it to obtain a comparison with the results of this study. Researchers can tailor their recruitment strategies such that only individuals who share the fundamental characteristics of the organization, such as values and goals, are attracted and selected.
The benefits and objectives of the company can be made clear and salient in recruitment advertisements, or realistic job previews can be conducted in events such as campus presentations. Through this method, candidates can have a piece of prior knowledge about the valued characteristics or behaviors and determine whether they want to work for the organization. In addition to these methods, a questionnaire assessing the fit between the importance of the person and the organization can be filled out by individuals who may be interested, and unsuitable candidates can be found early and dealt with as appropriate.
References
Amit, M., & Aditya, G. (2016). HRM practices and employee attrition: A gender centric analysis of Indian BPO industry. Clear International Journal of Research in Commerce & Management, 7(11), 1-5.
Analytics India Magazine [AIM]. (2020). Classification algorithms (Python). Web.
Kalidass, A., & Bahron, A. (2015). The relationship between perceived supervisor support, perceived organizational support, organizational commitment and employee turnover intention. International Journal of Business Administration, 6(5).
King, K.G. (2016). Data analytics in human resources: A case study and critical review. Human Resources Development Review, 15(4). Web.
Kissflow. (2018). Rapid application development: Changing how developers work. Web.
Kumar, R.M., & Melba, A.A. (2015). A study on women employee attrition in IT industry with special reference to TECHNOPARK, THIRUVANANTHAPURAM. Web.
Leelavati, T.S., & Chalam, G.V. (2017). Factors affecting employee attrition – a challenge for Indian retail industry. Asia Pacific Journal of Research, 2347-4793.
Mahesh, K.S. (2017). An analysis of employee attrition in Amaraja Batteries Limited, Tirupati, AP. International Journal of Management (IJM), 8(1), 196–201.
Nelissen, J, Forrier, A., & Verbruggen, M. (2016). Employee development and voluntary turnover: Testing the employability paradox. Human Resources Management Journal, 27(1), 152-168. Web.
Raja, V.A.J., & Kumar, R.A.R. (2016). A study to reduce employee attrition in IT industries. International Journal of Marketing and Human Resources Management (IJMHRM), 7(1), 01-14.
Sharma, N. (2018). People analytics with attrition predictions. Web.
Silpa, N. (2015). A study on reasons for attrition and strategies for employee retention. Journal of Engineering Research and Applications. Web.
Steven, H., & Tadelis, S. (2018). People management skills, employee attrition, and manager rewards: An empirical analysis. Nation Bureau of Economic Research Working Paper Series. Web.
Thomas, J. (2015). Study on causes and effects of employee turnover in construction industry. International Journal of Science and Research (IJSR), 4(5).
van Vulpen, E. (n.d.). What drives employee turnover? Part 2 [Blog post]. Web.
Woods, K. (2015). Exploring the relationship between employee turnover rate and customer satisfaction levels. The Exchange, 4(1).