Introduction
BP and its subsidiaries and related companies continue exploring, producing, refining, transporting, and distributing oil and natural gas. Besides, the organization manufactures chemicals, plastic products, and synthetic fibers. With the growing popularization of green energy, BP has been a significant investor in sustainable technologies under the “Beyond Petroleum” slogan (BP, 2021).
To keep up with the trends, BP has been investing in smart charging solutions around the globe, ranging from fleet powering to ride-hailing (Nhede, 2019). The company has also recently announced its kick-starting hydrogen production in the United Kingdom as one of the ways of supporting the government’s green agenda (Reuters, 2021). Thus, the strategy employed by the organization depends significantly on the changes in the external environment, according to which the internal processes will also change.
External Analysis of BP
PESTEL: Environmental Analysis
PESTEL analysis will reveal the details related to the operational challenges that BP is exposed to in the prevalent macro environment. In terms of political factors, they are crucial for BP to consider because of their significant influence on the way in which business processes will take place.
Relevant political factors affecting BP include the political stability within markets, the importance of the oil and gas industry to the economy, and levels of corruption, bureaucracy, and interference within the oil and gas sector (Boulos, 2017). In addition, BP should consider the existing trade regulations and tariffs related to the relevant industry, tax rates and incentives, industrial safety regulations, and any other requirements that the political influences may affect.
The economic factors also have a strong influence on BP as they help determine the aggregate demand and aggregate investment in the economy. Such factors as growth rate, inflation, and vital industry indicators such as the oil and gas growth rates and consumer spending can help forecast the growth trajectory of the sector and BP specifically (OECD, 2021). Because of this, the company is affected by the type of economic system in its countries of operation, the stability of that system, exchange rates and the stability of the currency, financial market’s efficiency in terms of the need to raise capital in local markets, and the infrastructural quality within the oil and gas industry.
For example, Great Britain, which is the default economy for BP, has an economic freedom score of 78.4, with the expectations of greater financial freedom in the post-Brexit economy (Heritage, 2021). However, the GDP is mainly driven by banking insurance and business services as the large oil, and natural gas reserves are declining (Heritage, 2021). Thus, it is notable that oil consumption has seen an overall decline in the trend, falling to 1.19 million barrels a day by 2020 (Sönnichsen, 2021). Most oil is consumed for road transport, with the demand expected to decline in the following decades while the consumption by the aviation sector may increase.
Social factors have a moderate influence on shaping the strategy of BP; however, they do matter when it comes to the formation of organizational culture within the specific environment. Considering the shared beliefs and attitudes of the population is necessary to understand consumers of the oil and gas market and adjust the marketing message. The population’s attitudes toward the industry in which BP operates are the most impactful.
Specifically, British society has been showing an increased awareness of using environmentally-friendlier fuels such as natural gas and reducing the use of harmful fuels such as coal, oil sands, and shale gas (Rentizelas, de Sousa Jabbour, Al Balushi and Tuni 2018). This means that the organization may be driven to include elements of social sustainability into the supply chain (Najjar, Small, and Yasin, 2020). Notably, BP will have to demonstrate initiative in introducing socially sustainable practices for reputational reasons and meeting governmental requirements.
Technological advancements have been transforming the oil and gas sector for some time and will continue to do so further. This means that tech solutions play an immense role when it comes to addressing the unique challenges of the oil and gas industry (Morgan, 2019). The strong influence of technological factors is vital for BP in several areas. Namely, robotics and automation have allowed doing high-risk jobs without human involvement, while the Internet of Things integration has provided companies in the sector with up-to-date information to predict the failure of equipment or reduce downtime.
The legal factors affecting BP within its relevant industry are mainly concerned with the laws and regulations at multiple government levels. BP’s operations in the UK and other countries rely significantly on employment laws, health and safety laws, patents and intellectual property laws, data protection, as well as consumer protection, and e-commerce (Burns and Nguyen, 2021). The primary legislation governing the exploration and production of energy industry products is the Petroleum Act of 1998 that grants the right to explore and develop defined geographical areas (Burns, 2019). In addition, new regulations (e.g., Sir Ian Wood’s offshore oil and gas recovery) have been put in place to respond to the declining production levels.
At this time, BP is strongly affected by environmental factors in light of the mass discussions regarding the harms to sustainability within the gas and oil industry. The company faces scrutiny from the Net-Zero Emissions by 2050 Scenario, which suggests that the trajectory of oil demand means that no new resources’ exploration is required, with no further oil fields necessary (LSE, 2021). However, continued investment in the existing sources is imperative for BP to maintain its operations while also aligning with the current existing environmental sustainability initiatives.
Porter’s Five Forces: Industry and Competition Analysis
Analyzing BP from the perspective of Porter’s Five Forces will help to make strategic decisions from the perspective of building a competitive strategic advancement. The rivalry is intense in the oil and gas industry, with BP facing competition from such companies as Gulf Coast, Texaco, Shell, OMP, Petro China, and other industry placers (BP competitors, 2021).
Competitive rivalry in the sector depends on product differentiation, economies of scale, as well as fixed and variable costs (Malik, 2018). The threat of new entrants is low because, in order to enter the gas and oil industry, a new company needs colossal capital. Besides, national oil companies control more than 90% of existing oil and gas reserves while the internal competition in the market is severe (Natural Resource Governance Institute, 2019). Besides, the prices of oil and gas are highly volatile, which makes it complicated to start a new company within the industry.
The threat of substitutes is moderate as the only alternative to oil and gas are biofuels and other renewable resources. The threat is moderate because the majority of companies operating within the alternative energy field are still developing, which means that it will take time for them to replace oil resources completely. Besides, BP has been working on expanding its reach to renewable resources already, which gives it a particular competitive advantage in the industry.
The bargaining power of suppliers is low while the bargaining power of buyers is high, which presents additional challenges for BP. On the one hand, BP has the edge over its suppliers because the latter can rarely afford to lose business. In addition, since the UK possesses oil fields, it means that BP is the supplier on its own, which gives it a tremendous competitive advantage. On the other hand, the demand for oil significantly affects prices (Beck, Kar, Hall, Olufon, and Bellone, 2021). Countries with high power that are developed, such as the USA, Japan, or China, may use their power to bargain with BP as a supplier. Besides, everyday consumers also have control in the industry because they can switch to other providers depending on their personal requirements.
External Factor Evaluation (EFE) Matrix
The EFE matrix (Table 1) summarizes relevant information regarding BP’s external environment and considers economic factors, political influences, socio-cultural underpinnings, competition in the market, as well as technologies.
Table 1. External Factor Evaluation (EFE) Matrix for BP (self-generated)
The score of the EFE matrix suggests that BP shows the capacity to respond to the current opportunities in the gas and oil industry and avoid threats. Taking advantage of the identified opportunities in the field is essential for the organization to optimize its operations and respond to the current industry threats. In particular, BP should pay attention to the shifting environmental regulations and the exploration of alternative energy solutions.
Internal Analysis of BP
Current Strategy and Culture
As a response to the shifting market demands and trends, BP has set out a new strategy, which pivots the organization from “being an international oil company focused on producing resources to an integrated energy company focused on delivering solutions for customers” (BP, 2021). The strategy has been developed around three areas of activity and three sources of differentiation to boost value. The first area of focus pertains to low-carbon electricity and energy (BP, 2020). By adhering to it, BP sets to build scale in bioenergy and renewable sources, looking for opportunities in early capturing of hydrogen and carbon capture, utilization, and storage technologies. Besides, BP is developing a solid customer gas portfolio to complement low-carbon solutions.
The second area of focus entails increased convenience and mobility, which entails putting customers first by helping accelerate the global revolution in mobility, redefining the experience of convenience retail, as well as scaling the presence of BP in selling fuel in growth markets. The third area of focus includes the dedication to resilient and focused hydrocarbons. This means that BP maintains an emphasis on safety and operational reliability, continues expanding its high-grade authority, which may result in significantly lower and more competitive production.
The three sources of differentiation for value amplification include integrated energy systems, partnerships with countries, industries, and cities, and investing in digital technologies and innovation. Along and across value chains, BP has pulled together its capabilities to optimize energy systems and created comprehensive offers to its customers. Cooperation with different players is a value-creating objective that is especially relevant to shaping the path toward net-zero emissions.
Finally, in terms of innovation, BP aims to create new ways to engage with customers, support new businesses, and create efficiency. The points mentioned above of strategic transformation are closely related to the culture of innovation and sustainability. By following the strategy, according to BP’s CEO Bernard Looney, BP is expected to become “a very different energy company by 2030” (BP, 2021). Therefore, BP has noticed a shift in the gas and oil trends and expectations, setting the goal of reimagining its business and perceptions of energy.
Financial Ratio Analysis
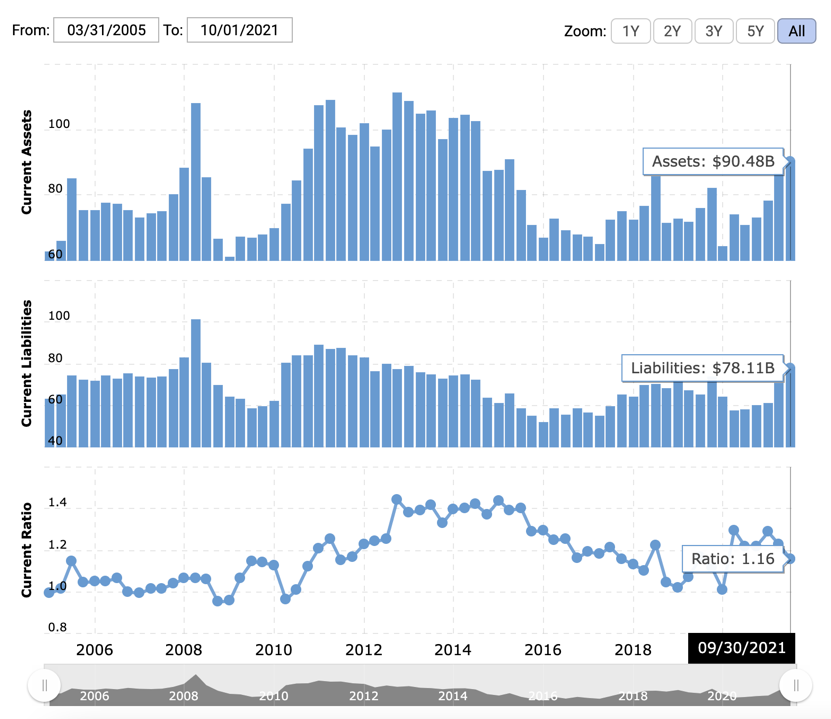
The current ratio is essential to consider because it can be defined as a liquidity ratio that measures BP’s ability to pay short-term obligations. For three months ending September 30, 2021, the company’s ratio was 1.16, which is average for BP for the period between 2005 and 2021 (see Figure 1). The highest registered ratio was 1.44 in December 2012, while the lowest was 0.95 in December 2008 (Macrotrends, 2021). In 2010, BP’s current ratio was 0.96 as a result of the Deepwater Horizon oil spill (Pallardy, 2021).

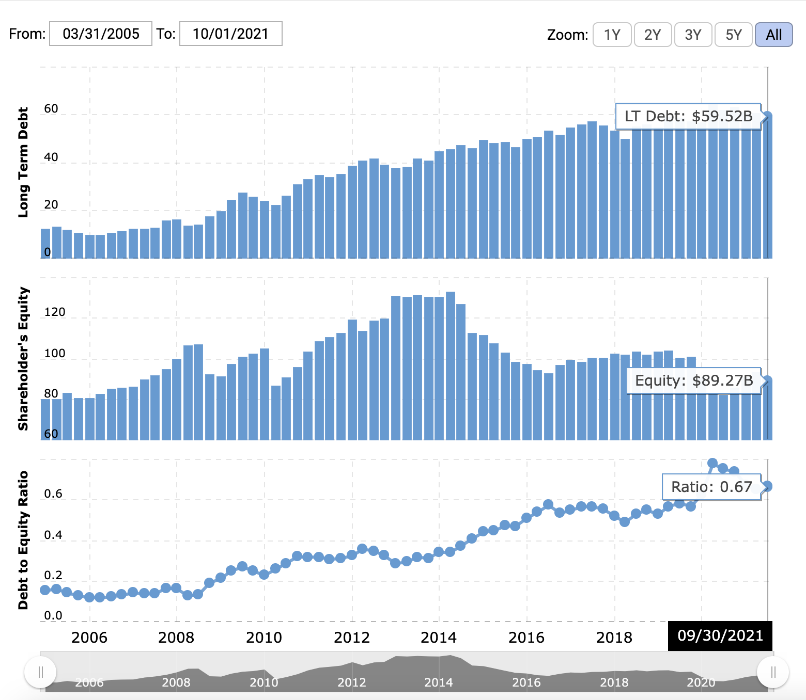
The debt/equity ratio shows BP’s financial leverage, which is calculated by dividing the long-term debt by stockholder’s equity. For three months ending September 30, 2021, the company’s debt to equity ratio was 0.67, which is a decline from 0.78 in 2020, which was the all-time peak, but is still higher than average for BP (see Figure 2).
In general, BP has a reasonable debt/equity ratio as it has historically been and continues to be lower than 1.0. Long-term debt/capital also defines BP’s financial leverage, which is calculated by dividing the long-term debt by the company’s capital. For three months ending September 30, 2021, BP’s long-term debt/capital was 0.4 (Macrotrends, 2021).

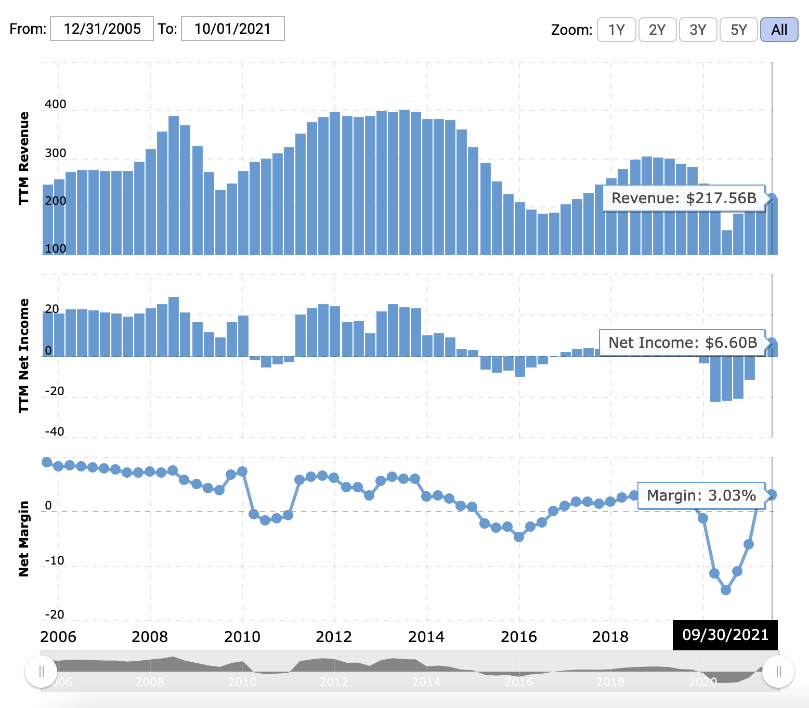
The current and historical net profit margin is defined as net income as a portion of total sales revenue. For the three 2021 months ending on September 30, BP’s net profit margin was 3.03%, which is an average indicator for the company (see Figure 3). The lowest net profit margin recorded was pretty recently, amounting to -14.42% in September 2020 (Macrotrends, 2021). The highest historical net profit margin was 8.97% in December 2005, suggesting that the company’s margins have decreased in the period between 2005 and 2021.

Conclusion
To conclude, BP faces significant strategic challenges in the volatile oil and gas industry, with the constantly changing prices, decreasing demand, as well as environmental problems. The most appropriate strategic route is the one that BP has formulated, which entails becoming an integrated energy company that focuses on delivering solutions to customers. Besides, under the 2050 zero net emissions initiative, BP has introduced new areas of focus and sources of differentiation that can help sustain operations within the rapidly evolving alternative energy industry.
Reference List
Beck, C., Kar, J., Hall, S., Olufon, D. and Bellone, D. (2021) The big choices for oil and gas in navigating the energy transition. Web.
Boulos, A. (2017) Assessing political risk. Web.
BP competitors(2021) Web.
BP. (2020) From international oil company to integrated energy company: bp sets out strategy for decade of delivery towards net zero ambition. Web.
BP. (2021) Our strategy. Web.
Burns, M. (2019) In a nutshell: oil and gas law in United Kingdom. Web.
Burns, M. and Nguyen, N. (2021) The oil and gas law review: United Kingdom. Web.
Heritage. 2021 Index of economic freedom: United Kingdom. Web.
LSE. (2021) An end to UK oil and gas exploration. Web.
Macrotrends. (2021) BP financial ratios for analysis 2005-2020 | BP. Web.
Malik, T. M. A. (2018) ‘Competitive analysis of the global oil and gas industry using Porter’s Five Forces model’, The 7th Annual Conference of Economic Forum of Entrepreneurship & International Business. Web.
Morgan, C. (2019) How technological advances can transform the oil and gas sector. Web.
Najjar, M., Small, M. H. and Yasin, M. (2020). Social sustainability strategy across the supply chain: a conceptual approach from the organisational perspective. Sustainability, 12. pp. 1-16.
Natural Resource Governance Institute. (2019) The national oil company database. Web.
Nhede, N. (2019) BP enters the world’s largest EV market. Web.
OECD. (2021) Update on recent progress in reform of inefficient fossil-fuel subsidies that encourage wasteful consumption 2021. Web.
Pallardy, R. (2021) Deepwater Horizon oil spill. Web.
Rentizelas, A., de Sousa Jabbour, A. B. and Al Balushi, A. D. and Tuni, A. (2018) ‘Social sustainability in the oil and gas industry: institutional pressure and the management of sustainable supply chains,’ Annals of Operations Research. Web.
Reuters. (2021) BP plans large-scale green hydrogen project in UK. Web.
Sönnichsen, N. (2021) Oil consumption in the United Kingdom (UK) 2004-2020. Web.