Introduction
Topic
- Is the mean starting salary for a bachelor’s student $30,000?
Answers to Questions
How you will collect the data?
- I will collect data by conducting surveys among bachelor’s students, who are at the university.
What you expect to find out or hope to find out?
- The mean starting salary for a bachelor’s student is $30,000.
Will there be bias?
- The data collected will have a bias because bachelor’s students tend to indicate that they earn more salary than their actual salary for they want prestige. Therefore, the bias may lead to an inaccurate finding that the mean starting salary for a bachelor’s student is more than the actual mean.
What are my goals?
- My goals are to determine the mean starting salary for a bachelor’s student, undertake descriptive statistics, depict the distribution of salary, and test the hypothesis. Since salaries that bachelor’s students earn vary, I want to determine the mean starting salaries for bachelor’s students in the university and undertake descriptive statistics. Moreover, I will explore and depict the distribution of starting salaries for bachelor’s students using graphs such as scatter plot, histogram, boxplot, and stem-and-leaf plot. Ultimately, I will test the hypothesis that the mean starting salary for a bachelor’s is $30,000.
Survey Questions
- What is your age?
- What is your gender?
- What is your starting salary as a bachelor’s student?
Summary statistics
Graphs
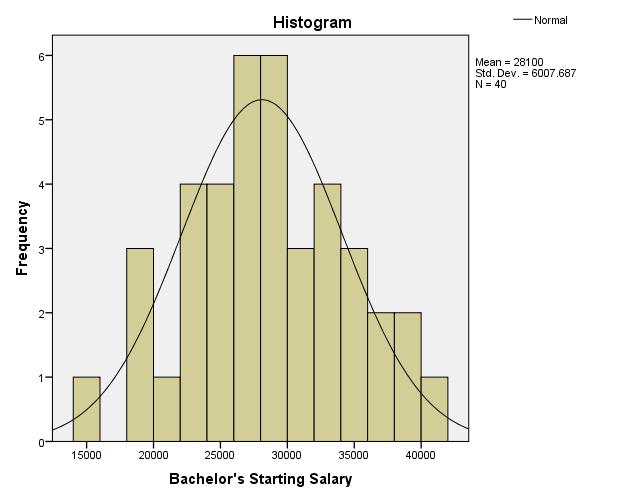
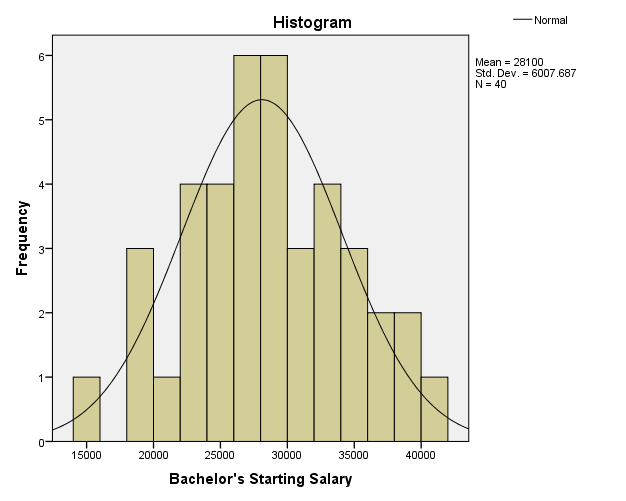
Histogram
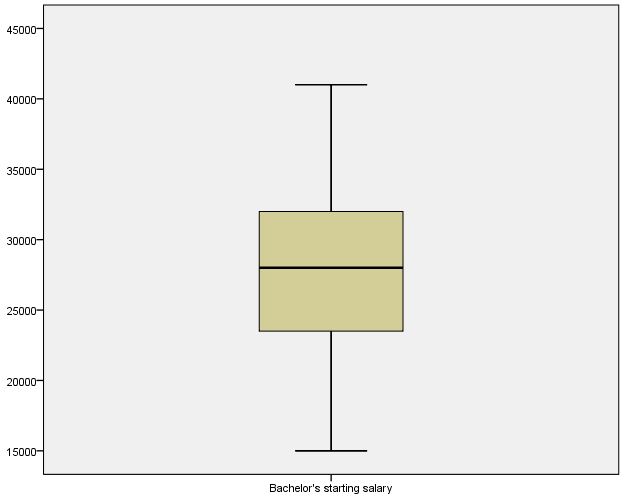
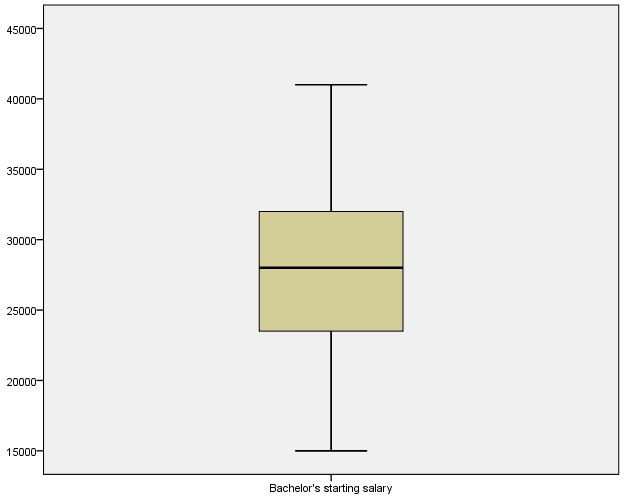
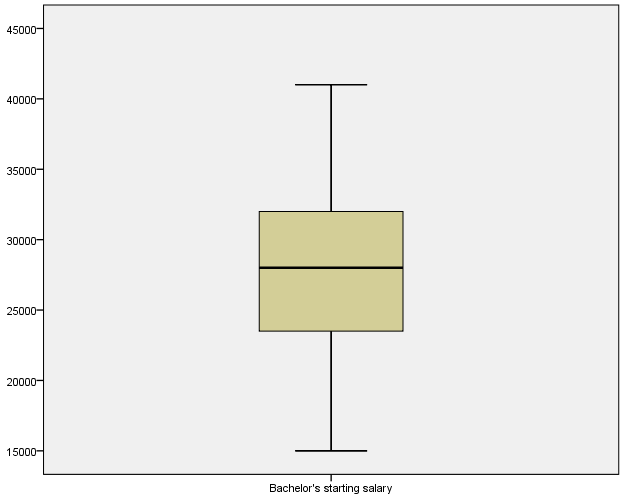
Boxplot
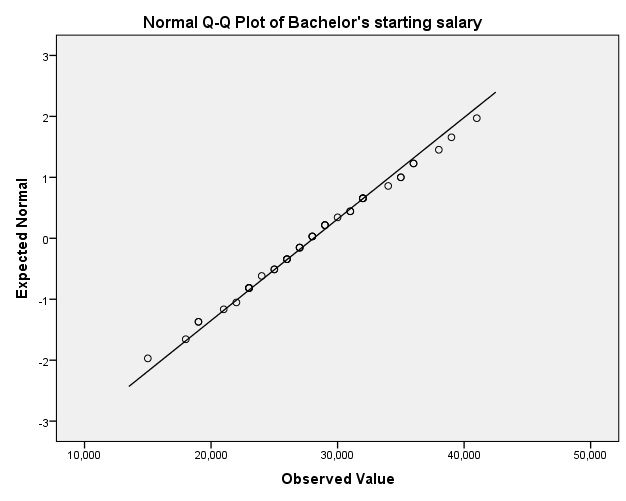
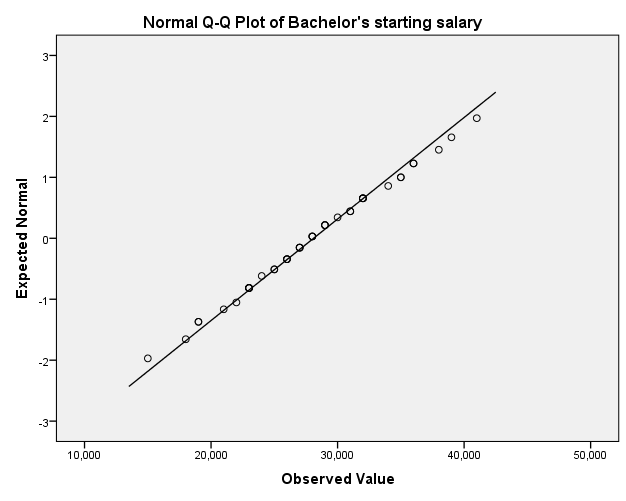
Q-Q Plot
Confidence Interval
Confidence Interval (95%)
Hypothesis Testing
- Ho: The mean starting salary for a bachelor’s student is $30,000
µ = $30,000
- H1: The mean starting salary for a bachelor’s student is not $30,000
µ ≠ $30,000
Hypothesis testing indicates that the hypothesized mean of $30,000 is not significantly different from the sample mean, t(39) =-2.002, p = 052, because it falls within the confidence interval. Gailmard (2014) states that confidence interval indicate a range of values that contain population parameter at a given significant level. In this case, the confidence interval ranges from $26178.65 to $30021.35, which explicitly shows that the hypothesized mean of $30,000 does fall within the confidence interval. The conclusion is that the mean starting salary for a bachelor’s student is $30,000.
Final Upload, Unit 5
Sampling
The population of interest that the survey targeted was bachelor’s students. The survey used convenience method of sampling to sample 40 participants (N =40) from the target population of bachelor’s students. The 40 participants were bachelor’s students, who have worked in various companies and have earned their salaries for more than a year. Demographic variable of gender shows that female participants were 22 and male participants were 18. The survey comprised of three major questions:
- What is your age?
- What is your gender?
- What is your starting salary as a bachelor’s student?
Data Collected
Descriptive Statistics
Graphs
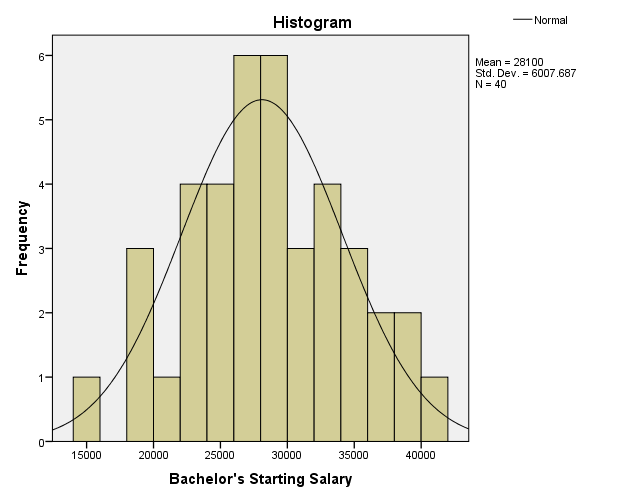
Histogram
Boxplot
Q-Q plot
Confidence Intervals
Confidence Interval (95%)
Hypothesis Test
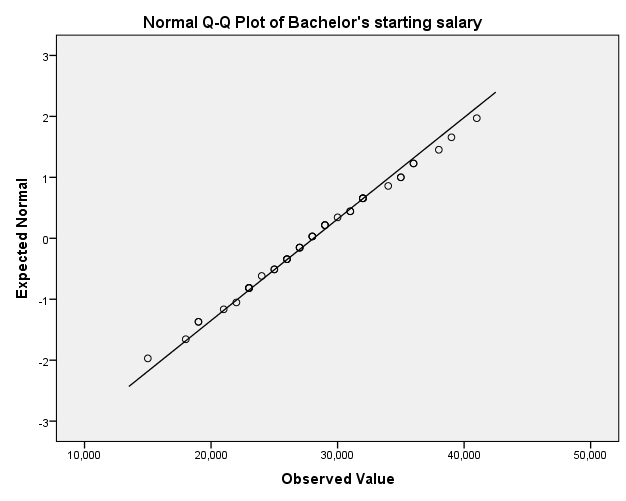
The one-sample t-test was used in hypothesis testing because the study sought to compare sample mean of starting salary with the hypothesized mean of starting salary for bachelor’s students. Jackson (2011) states that before conducting one-sample t-test, the data must meet the assumptions of interval scale, independence of observation, normality, and lack of significant outliers. The starting salary for bachelor’s students met the assumptions of one samples t-test because the data followed the normal distribution, lacked significant outliers, depicted independence of observation, and existed in an interval scale. The histogram shows that the data follow the normal distribution, while boxplot and Q-Q plot indicate that they are no significant outliers.
Graphs
Histogram
Boxplot
Q-Q plot
Hypotheses
- Ho: The mean starting salary for a bachelor’s student is $30,000
µ = $30,000
- H1: The mean starting salary for a bachelor’s student is not $30,000
µ ≠ $30,000
The outcome of hypothesis testing, t(39) =-2.002, p = 052, shows that the test fails to reject the null hypothesis that the mean starting salary for a bachelor’s student is $30,000. According to Wilcox (2012), when p-value is greater than significant level, the test fails to reject the null hypothesis. Consequently, the test retains the null hypothesis because the hypothesized mean of $30,000 falls within the 95% confident interval ($26178.65 to $30021.35). Therefore, the conclusion is that there is no enough evidence to reject the null hypothesis that the mean starting salary for a bachelor’s student is $30,000.
Conclusion
The weaknesses of the study are small sample and biases in data collection. The sample of 40 bachelor’s students is very small when compared to the general population; hence, reducing the external validity of data. Moreover, the data have some biases associated with the attitudes of students, which affect the veracity of data collected. Jackson (2011) the existence of confounding variables in a study reduces external and internal validities of research findings. In this case, the confounding variables are age, gender, and work experience, as they influence starting salaries for bachelor’s students. The findings of the study can be extrapolated to bachelor’s students in other universities within the same state, but not to other states because starting salaries vary from one state to another. Further work is necessary to determine the impact of age, gender, and experience on starting salaries for bachelor’s students. The hypothesis testing using p-value and confidence interval lead to the conclusion that the hypothesized mean of $30, 000 is not significantly different from the sample mean.
References
Gailmard, S. (2014). Statistical modelling and inference for social science. New York: Cambridge University Press.
Jackson, S. (2011). Research Methods and Statistics: A Critical Thinking Approach. New York: Cengage Learning.
Wilcox, R. (2012). Introduction to Robust Estimation and Hypothesis Testing. New York: Academic Press.