General overview of Saudi Aramco
The world largest crude oil producer and trader Saudi Aramco is the national oil brand of Saudi Arabia with more than 100 oil and gas fields and 253 extra large reserves in different part of the country but the head office in Dhahran. It started its business in Saudi Arabia dated back on May 29, 1933 when the government signed a contract with Standard Oil of California (Socal) to explore the oil in the country but it failed to explore any oil and in 1936 California-Arabian Standard Oil Co. (Casoc) brought 50% share of the company. In 1938, the company was able to locate the oil in Dammam where 1500-barrel oil was produced per day and in 1944, it took the name of Arabian American Oil Company (or Aramco). In 1973, the Saudi Government took 30% of the company and finally in 1980 the state took the full control of the company and took the name of Saudi Arabian Oil Company (or Saudi Aramco) in 1988 (Saudi Aramco 5-7).
Literature Review
Cost Benefit Analysis
Cost benefit analysis has used to evaluate feasibility of any project in terms of the future benefits that arise from the operation of the project compared to the cost of the project. According to entrepreneur.com cost benefit analysis refers to weigh the benefit and relative cost among the different plan to exert the best plan for implementation (Watkins 1). Suppose a company wants to install computerized operation instead of manual operation, which entails a cost of $100,000 and the amount will be recoverable within 8 years. In such a case, the company will decide whether to implement to system or not. This analysis can also execute on current operation to determine the feasibility of the current operation such a company can reevaluate its current operation investment and the profit to assume the benefits derived from it and assess the requirement of further modification.
Contract Pricing
Contract pricing refers to the pricing decision related to the setting the price which directly affect the suppliers or buyers of the company. It is a long-term pricing decision made by the company to minimize its cost and get a sustainable profit (DPAD 1-13). To understand the contract pricing there need to understand the price environment including the various factors, which directly affect the pricing. These factors include:
- Price: Basically, price implies the amount of money paid against a product or service and it includes the cost plus the certain amount of profits. Paying amount is important but if the saying price is below the cost of production of goods or service than the risk of low quality product or service increase. On the other hand, if the price covers the cost and ensure the expected level of profit than the quality of product and service will certainly increase.
- Seller’s orientation regarding pricing: Firm’s objectives: The seller’s first consideration in selling is covering the cost and making profit to run other operational objectives. The objectives of the seller’s in pricing are primarily cover the cost because without covering the cost no company will survive. The company has some specific operational objectives, which includes the short-term gain or profit and the long-term gains. Other objectives include sustaining in long term, higher quality product, prompt implementation of advance technology etc. To attain these objectives of short and long-term profit is obligatory for the firm.
- Pricing Strategy of Seller: Sellers or firm mainly use two strategies in pricing firstly cost base pricing and secondly market base pricing. Cost base pricing comprises of three pricing techniques, which includes the mark-up pricing, margin on direct cost pricing and finally rate-of- return pricing. On the other hand, market base pricing includes profit maximization pricing, market-share pricing, market skimming pricing, current-revenue pricing etc (Roy 2-8).
- Mark-up Pricing: Mark-up pricing determines by adding a mark-up with the total cost, which may be direct cost or total cost (Baumol 127). When the cost is direct, then mark-up includes indirect cost plus profits and when it covers the total cost than mark-up is only profit. To determine the mark-up price firm firstly assess the volume of sales and the unit cost of that estimate volume. After the estimation of sales volume and unit cost the firm than determine the rate of mark-up and use this rate to the cost to identify the selling price per unit of product.
- Margin Pricing: Margin pricing is also alike the mark-up price where the seller use a marginal rate on direct cost which covers both profit and indirect cost. The difference between mark-up and margin pricing is that in margin pricing the rate use based on the price where in mark-up the percentage is arbitrary. In calculating the marginal price the firm assesses the sales volume and per unit cost of the product then determine the margin rate which applies on the cost of the product to ascertain the per unit selling price.
- Rate-of-Return Pricing: In rate-of-return pricing, the estimated profit is adding with the cost of the product. The profit rate is not calculating upon the basis of the direct cost instead it uses the cost of investment behind producing the product. In rate-of-return pricing firm first determine the rate of return from that particular investment and required amount of investment then the volume of sales. Finally it assess the expected profit rate and the per unit selling price.
- Profit Maximization Pricing: Profit maximization pricing complies with the golden rules of price and demand, which describe if the price increases than demand will decrease and vice versa. Firm which want to appreciate this strategy carefully determine the combination of sales volume and price where the profit is maximum. When taking this pricing strategy firm must carefully investigate the market whether it is sensitive to the price or the competitors are responding to the price change rapidly or slowly etc.
- Market-Share Pricing: This pricing approach related to the market share where the firm believes that if the able to capture the market share it brings benefit in long run. Here the main target of the firm is to enter into the market through the low pricing which will recover through the increment of sales volume and competition will diminish in long run. Firm must consider some issues, which are important to implement the market-share pricing such as making operation efficient and capture more market share to minimize cost and maximize profit.
- Market skimming Pricing: Market skimming pricing refers to the pricing techniques where the firm charge high price for high quality product. It targets a set of customers who are willing to pay more prices for high quality product and thus firm make the high profit. As the customer demand fulfill or new competitors enter into the market with low price than company reduce their price to increase the sales volume. In this pricing technique, firm must charge high price for premium product, maximize profit, and in long run reduce the price to retain the customer who are not willing to pay a high price.
- Current-Revenue Pricing: In current revenue pricing the firm tries to maximize their current profit by any way and even reducing the price. This pricing adopts due to the future uncertainty over the financial stabilities and current need of cash. In this strategy, firm set a price, which exerts the maximum revenues for it and it may be below the cost.
- Promotional Pricing: Promotional pricing is a technique refers to set price which is low and which ultimate helps to increase the price other product in the product line. This price sets for increasing the sales of other product related to this product and mostly the price is below the cost level. In adopting such price, the firm must consider whether this pricing will positively affect the other product price and high price assumes high quality.
- Market-Competition Pricing: Market competition pricing refers to the pricing where the company set a price complies with the price of competitors. Here the price is greatly depends upon the pricing of the competitors and the price will up and down with the price of the competitors and this pricing technique is useful in homogenous market. To establish this pricing firm must consider the price charge by the competitors and take action accordingly.
Various techniques of Contract Pricing
- Price Index: Price index is mainly determining the changes of price from one period to other period and this index is utilising to adjusting the change in price over time. There are two types of price indexes such as the single index and aggregate index. In single index the changes determines for only single product over time it tends to be accurate if the actual price of the single commodity will use in indexing. On the other hand, in aggregate index refers to the measurement of changes of price over time of a group of related product. This index aggregately measures the changes of price of group of product such as the regular commodities (DPAD 1-16). Price index used for comparing the current price with the past price and it also helps to adjust the rate of inflation and deflation to portray the correct price.
- Cost-Volume-Profit Analysis: Cost-volume-profit analysis mainly implies the relationship between the cost, the sales volume and the profit, which is essential for short-term pricing. In short-term, there are three types of cost which includes:
- Fixed Cost: Fixed cost includes all cost that will not very for a certain level of production over a time (DPAD 1-5). Per unit, fixed cost will decrease when the production volume increase and vice versa but the total fixed cost is always constant. Examples of fixed costs are the factory rent, insurance premium, taxes, duties etc.
- Variable Cost: Variable cost is the cost, which directly varies with the level of production volume as the production volume increases then the total variable cost also increases and the volume decreases then variable cost are decreases. However, per unit variable cost is always constant whatever the volume of production. Examples of variable cost includes the cost of raw materials, labor etc.
- Semi-Variable cost: Semi variable cost are those cost which is mainly fixed in nature but when it uses then it act as a variable cost. Example of semi-variable cost includes the utility expense where a fixed charge associated by the cost based on the use.
- Profit: Profit implies the difference between the total revenue and total cost and it may be negative when there is a loss and it would be zero when there is no profit or loss. Cost volume profit analysis assumes the fixed and variable cost for total cost where if the volume increases the total cost decrease so that firm can reduce the price if the sales increase (DPAD 1-18). It also affect the direct cost as direct cost are mostly variable and firm can consider the direct cost in pricing. Cost volume analysis also affects the indirect cost and indirect cost includes the fixed cost and the semi variable cost, which decrease in unit as the volume increase.
- Statistical tools: Statistics is a science of collecting the data for organizing, summarizing, analyzing, and interpreting that for better decision making. There are mainly two major types of statistics as the descriptive and inferential. Descriptive statistics includes summarizing and analyzing a large number of data through calculation and graphical expression (DPAD 4-9). On the other hand, inferential statistics includes taking some sample from a large pool of data to analyzed and decide about the population and made the prediction or generalization on any matter. Population includes all the elements of an observation or subject for examination and the sample includes a subset of the population which are used the make inference about the population.
- Arithmetic mean: Arithmetic mean is average value, which could be obtained through adding all the observation and divided by the total number of observation.
- Median: Median is the middle value of a set of data when the date set from lowest to the highest order.
- Mode: Mode is the value of observation, which takes place in a series of data mostly, that means the highest frequency of a data series. It uses to determine the event, which currently takes place frequently and has the possibility to happen in future.
- Range: Range is the limit of data set, which includes a highest value and lowest values. Range is used to cluster the total population or observation.
- Standard deviation: Standard deviation is the dispersion of data from the mean and low standard deviation indicates the data fall aside the mean and high standard deviation indicates the data disperse over a number of series.
Cost Estimating Relationship
Cost Estimating Relationship is a tool to determine the price through examines the well-set relationship between the cost or price and an independent variable (DPAD 2-8). If the firm able to identify the independent variable which has a measurable relationship with the cost and price then it can develop the cost estimating relationship. There are several steps in developing the Cost Estimating relationship.
- At first, the firm must determine the dependent variables that are what it wants to calculate such as the price, production cost etc.
- Firm must select the independent variable to build or measure the relationship and it should be select on the experience of the people.
- Firm need to collect data on the relationship between the dependent variables and independent variables that must be accurate get the good result.
- At this stage, firm should determine and analyze the relationship between the dependent and independent variables and it can make through various analytical data or graphical presentation.
- After making, various analyses the firm can select one analysis which best describe the dependent variables. The positive relationship between the tow variables indicates the independent variable is the perfect choice.
- All the findings of the analysis at this stage properly documented to involve other in this analysis and for further use.
Regression Analysis
Regression analysis is a common tool to analysis the relationship of two or more variables through a single line. There are two variables such as dependent variable and independent variable where dependent variable change with the change of independent variables and this changing relationship can explain through a straight line (Sykes 5). In case of cost or price variable which are dependent variable and other factors like labor cost or manufacturing cost etc are independent variable, the relationship most of the time do not fall in the straight line because of the random variance in the dependent variables. Plotting the lines in graph helps to minimise the random variations and to generate accurate result of the analysis. Regression analysis is a helpful tool to estimate the cost where the cost or price is an independent variable and the supply of the product is a dependent variable. It also useful to identity the indirect cost as indirect cost is not identifiable and not matches with single cost objectives and through multiple regression analysis the relationship of indirect cost with the price can estimates. Regression analysis can use in time series analysis where the data of different time calculated to understand the trends of the data. One important matter regarding the regression analysis is that it is an analysis for short-term prediction and will be risky for prediction of long future.
Moving Averages Cost
Moving average cost is a statistical tool for calculating the average cost over various periods and when the new period added then the old period eliminated. It is a technique to estimate the trends in the cost and there are various types of moving average cost depend upon the calculating period. In simple moving average cost is a technique where the mean has assumed from the previous data with the assumption that the last period would be similar to the future. When new period add in one side then same amount of period deducted from the past. Cumulative moving average cost is a measurement technique to calculate the average cost up to the current time and when each new time added then the average calculate to update the data. The weighted moving average is the allocation of different weight to the different data point and the weight tend to decrease over the time. Finally, in exponential moving average cost, the weight is decreasing exponentially and when the new data add then the older data weight is decreasing and not totally be eliminated and shaped in exponential form.
Improvement curve: This curve also known as learning curve that refers to the improvement of work due to the repetition of work. There are three fundamental assumption regarding the improvement curve which are firstly, the repetition of work require less time to do the work, secondly, the rate of improvement lessen as the quantity of production increase and finally, the improvement shows consistency so that it can use as tool for future assessment.
Work measurement: Work measurement is a tool to measure and control the labor time required to perform a task or a group of task through using a specific labor standard. This measurement develops specifically for the manufacturing as labor hour is a related term of production but sometimes it also can use in other task or performance as well.
Net Present Value Analysis: In net present value analysis, the most important measurement is the time value of money, which measures the present value of single currency, which may be received in future and similarly the money received today may have more value in the future. There are some factors, which affects the present value including the time when the expenditure taken place and the rate of discount. When the discount rate is high, the present value is low and when the discount rate is low, the present value is high.
Net Cash Flow: Cash is the lifeblood of the company and without having cash no company can survive in the business. Cash flow statement mainly deals with the cash inflow and outflow of an organization, which helps the owner and stakeholders to assess the position of the company regarding the cash. The generation of the cash and the expenditure of the cash are both long-term and short term in nature. Long-term cash flow includes the loan, investment, reserve etc. and on the other hand, income and expenses like dividend, regular expenses etc are the example of short term cash flow. The analysis of the cash flow of an organization addresses mainly three issues, which are:
- Cash flow from operation: Cash flow from operation mainly implies the short-term cash inflow and outflow generated from the operation of the company. The cash inflow form the operation includes the revenue from sales, dividend processing, interest from investment and other income like commission etc. On the other hand, Cash outflow from operation includes the payment made for purchasing the goods, salaries and wages of employees, payment of VAT, taxes etc. The difference between the cash inflow and outflow from operation indicates the short-term benefits derive from the operation of a company.
- Cash flow from investment: Cash flow from investment implies those flows of cash, which are not frequently taking place in the business, and it is long term in nature. The cash inflow from investment activities includes the selling the securities, shares, old machineries and plants, and loan given repayment etc. On the other hand, cash outflow from investment includes purchasing new securities or investment, installing machinery or new plan setup etc. The difference between investment cash inflow and outflow indicates the long-term benefit or cost of the company.
- Cash flow from financial activities: Cash flow from financial activities includes all the activities related to the finance of the company. The cash inflows from these activities are the cash received from selling company’s shares or stocks, borrowing from the others etc. On the other hand, cash outflow includes the payment of dividend, loan repayment, or taking company’s own share etc.
Cumulative Cash Flow: Cumulative cash flow refers to the net total cash flow on a point of time compare to net cash outflow where the cash flow gets upon a definite period. In general, cash flow statement, the net cash flow can get after some timeframe or quarter but not the total cash flow of the company. In cumulative cash flow statement, the total amount of cash flow after every certain period can get which enables the company to look over the total cash inflow or outflow.
- Payback Period: Payback period is the time measurement where the total investment or cash outflow equates the total inflow of cash such as revenue. Payback period measure the time required to return the invested amount and it measures the risk in the definite investment (Wantedtech 1). If the payback period is less than the investment contains low risk and if the payback period is long the risk element in the investment in high and should avoid. As an example, if any person investment $100000 in one particular business he has to calculate within which time the amount will be regain such as four or five years. Then the person can invest the same amount in other business, which may return the amount within three years. Therefore, the person select the second option as it entails smaller time than the first one in terms of payback period.
- Return on Investment: Return on investment is an index used to measure the relative return over the invested amount (Oehlert 1). It calculated through subtracting the cost from gain and divided the amount by the cost, which generates the return on the cost or investment. High return on investment indicates the higher profitability.
- Internal Rate of Return: Internal Rate of Return of return is a discounted rate where the present value assumes as zero. IRR is then comparing to the discounted rate of return of the company’s project and if the rate is higher than the discounted rate of return, the project will carry more value than the other will. Here one thing is important that higher return involves higher risk.
Cost Benefit Analysis of Saudi Arabian Oil Company or Saudi Aramco
Price Index
Table 1: Price Index for Crude Oil (price per barrel)

Table 2: Price Index for Gasoline (price per gallon)

The oil crude oil price and the price of gasoline determined internationally and in abovementioned price index for Saudi Aramco crude oil and gasoline the base year assumed as the year 2007. In case of crude oil, the price of the crude oil is gradually increase over time and the index is developing in three years as in 2007 it was 100 and in 2009 the index raise nearly to 157 which clearly shows the long term benefit of the company. However, in case of gasoline the price index is fall over time as in 2007 the index is 100 where in 2009 it falls to 79, which clearly indicate the loss for the company in long run.
Cost Volume Profit Analysis
In case of crude oil, the calculation and relationship between cost, revenue, and profit are as follows:
- In 2007, the revenue per barrel is $58.30
- The quantity produced 2500 million barrel.
- Fixed Cost $29150 million.
- Variable cost per barrel $23.32
Solution:
- Total Cost = Fixed Cost + Variable Cost
- Or, C = F + VU (Q)
- Total variable cost is VU (Q) where VU is variable cost per unit and (Q) is the quantity sold.
- So, Total Cost = $29150 million + $23.32 × 2500 million barrel
- = $29150 million + $58300 million
- = $87450 million
- Again, Revenue= F + VU (Q) + Profit
- Or, RU (Q) = F + VU(Q) + P
- Or, $58.30 × 2500 million barrel = $29150 million + $23.32 × 2500 million barrel + P
- Or, $145750 million = $87450 million + P
- Or, P = $145750 million – $87450 million
- Or, Profit/P = $58300 million
In 2008,
- The revenue per barrel is $64.20
- The quantity produced 2200 million barrel.
- Fixed Cost $29150 million.
- Variable cost per barrel $25.32
Solution:
- Total Cost = $29150 million + $25.32× 2200 million barrel
- = $29150 million + $55704 million
- = $84,854 million
- Again, Revenue= F + VU (Q) + Profit
- RU (Q) = F + VU(Q) + P
- Or, $64.20× 2200 million barrel = $29150 million + $25.32× 2200 million barrel + P
- Or, $141240 million = $84,854 million + P
- Or, P = $141240 million – $84,854 million
- Or, Profit/P = $56,386 million
In 2009,
- The revenue per barrel is $91.48
- The quantity produced 2700 million barrel.
- Fixed Cost $29150 million.
- Variable cost per barrel $27.25
Solution:
- Total Cost = $29150 million + $27.25× 2700 million barrel
- = $29150 million + $73575 million
- = $102,725 million
- Again, Revenue= F + VU (Q) + Profit
- RU (Q) = F + VU(Q) + P
- Or, $91.48 × 2700 million barrel = $29150 million + $27.25 × 2700 million barrel + P
- Or, $246996 million = $102,725 million + P
- Or, P = $246996 million – $102,725 million
- Or, Profit/P = $144,271 million
From above analysis, per unit revenue shows the upward trends where the total cost varies according to the unit produced. On the other hand, variable cost increase over time but the fixed cost does not vary according to its fixed nature. The production volume is also varies where in 2008 production volume decrease compare to the year 2007 but increase in the year 2009. It observed that though per unit, revenue shows consistent rise but due to the variation in the production volume, the profit also varies. In 2007, the profit was $58300 million but in 2008, the profit falls to $56,386 million due to the decrease in the production volume and again in 2009, it increase to $144,271 million. It indicates that though profit decreases in 2008, Saudi Aramco shows consistent profit and growth in their business in long run.
Cost Estimating Relationship
There are six-step procedures to measure the cost estimating relationship in Saudi Aramco those are as follows:
- Identify the dependent variable: In case of Saudi Aramco, the revenues received are the dependent variable.
- Choose the independent variables for measuring relationship with dependent variable: Here the independent variable is the labor hour, which directly affect the revenue of the company.
- Collection data on the two variables: At this stage, data about the two variables collect to develop the relationship between them. Here the labour hour, which in 2007 is 5700, in 2008 is 5100, and in 2009 is 6200 where the wage rate increase over time and the labour cost is also tends to rise in different time.
Table 3:

- Measure the relationship between dependent and independent variables: In this stage, the ratio of estimated labour cost of Saudi Aramco against the revenue calculated shown in following table.
Table 4:

- Select the best relationship: From the above table it is clear that in the relationship between revenue and labor hour there is no trends present. The revenue fall between 1.5 to 1.90 times to estimated labor cost. As a result, the average ratio is (1.50+1.49+1.91)/3 or 1.63.
- Documentation: Finally, all document should properly documented for future use.
Regression Analysis
In this regression analysis, the independent variable is the cost and dependent variable is the revenue of Saudi Aramco. Here the per unit cost and revenue is assuming for the analysis purpose and five years data have gathered ranging from 2005 to 2009.
Table 5:

Table 6:

Table 7:

Table 8:

Table 9:

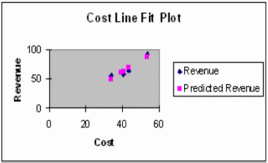
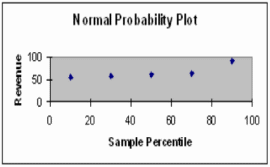
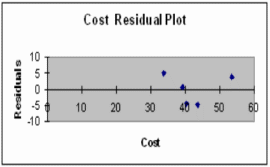
In above mentioned regression analysis, the variance of the dependency of revenue and cost has explored. It is assumed that if the other things remain constant then the revenue is directly influence by the cost so that if the cost increases then the revenue is also increase as a result the analysis generates the results with a positive and negative variation. Here the confidence levels assumed as 95%, so that the significance level is 5%. In this regression analysis, through five observation, that is positive and the revenue is directly affected by the cost and the regression results is.95 which indicates the higher level of dependence and the standard error is 5.22. The residual of the observation that is the deviation from the function shows three positive and two negative results, which also implies the mix dependence between two variables. The meaning is that beside the cost increase in revenue is also depends on other variables too and cost has a close relations with the revenue. The revenue in the graphs also fit with the prediction level and in the variance analysis, the positive result implies the level of sum of square and the sum of mean and finally the level significance with the prediction.
Net Cash flow Statement

From above figure, the total cash flow of Saudi Aramco is $146605 million in 2006, $142093 million in 2007, and in 2008, the total cash inflow is $536522 million where the cash inflow of the company is inconsistent in nature. This is because the in 2007 the revenue from three products comes less than the other two years. On the other hand, the total cash outflow also shows that in 2007, the outflow is less than the other two years but the company shows good performance in 2008, which indicates the efficiency of the company over the long run. Both in the short term and long term Saudi Aramco get benefit over the cost and as a result, in every year the net cash flow of the company is positive and in 2008 it’s net cash flow exceed $ 170323 million.
Cumulative Cash Flow

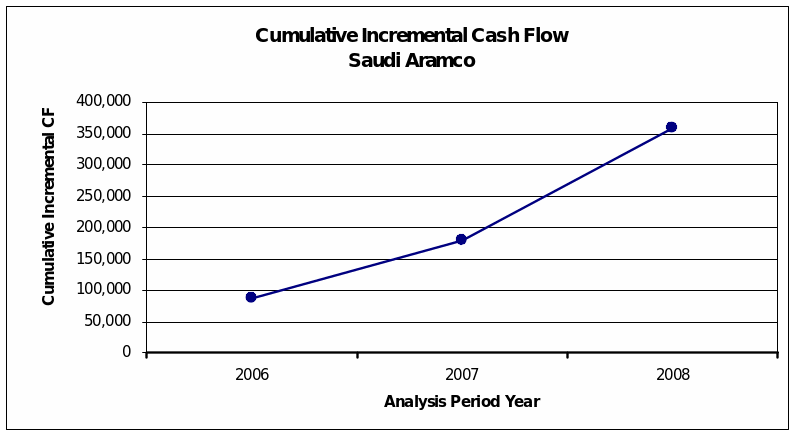
From the above figure, chart and plotting, the depiction of Saudi Aramco’s cumulative cash flow is clear and here through this cumulative incremental cash flow statement the total net cash flow over three years sited. In incremental cash flow statement, the first year’s net cash flow and incremental flow are same but after the starting year, in next year, the previous year’s cash add with the current year. Therefore, the investor and other assessor who want to know about the total cash flow do not need to go through the statement and just look over the last year’s cumulative cash flow to get the total cash. Beside this, in incremental cash flow statement, it is clear that Saudi Aramco get the expected benefit over cost in both contract pricing and spot sales because every year cash flow increase from the previous year.
Payback Period

Payback period is time in which the investor can get their money invested an in case of Saudi Aramco, they invested $5800 million in the year 2005 initially and the return was $4000 million which is negative and within 3.4 year the investment is equal to return from the investment. Therefore, the payback period is satisfactory for the company and as short as the period, the growth and long-term profit of the company is high.
Return of Investment

The Return of Investment for Saudi Aramco is 49.6%, which is quite satisfactory for the company and it shows that every investment produce approximately 50% of its total investment. In previous section, the payback period shows 3.4 years and in this section the return on investment is 49.6%, which indicates in 3.4 years the investment will recover and generate a profit of 50%. If the returns on investment are high then the rate of profitability is also higher for the company.
Internal Rate of Return

The internal rate of return for Saudi Aramco has targeted as 50%, which in reality exceed the benchmark and shows the promptness of the return of the cash outflow or investment. It is actually rate at which the investment amount has discounted to zero. In addition, the higher the rate of return the profitability of the company is high because it returns the money at good rate in every year. So it the calculation of IRR Saudi Aramco passed the expected level which indicates its long-term profitability.
Net Present Value

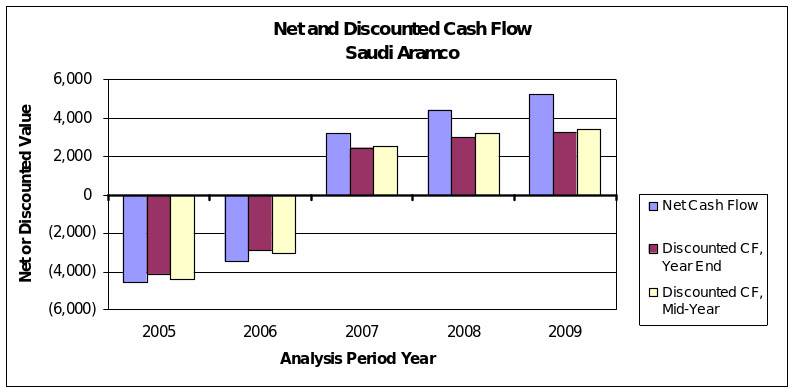
The net present value of the cash flow of Saudi Aramco in at the end of 2009 is $3299 million, which assume to be a good figure for the business. Actually net present value is the discounted value of the future and it indicates the present value of the money, which may get in future. In the above figure in the year, 2005 and 2006 the net cash flow is negative because at this time investment has made though by the time the figure turns to positives, which sustains until the year 2009 and here the discounted rate, is 10%. Therefore, from the NPV approach it is apparent that the Saudi Aramco positioned in a good place where the profit is high and the growth is positive.
Profit Maximization
Profit maximization is an economic term by with a firm selects a level of output where the revenue is highest and it is a short-term measurement for the firm. In case of Saudi Aramco, the company should select an output level where the profit maximum and complied with the demand of the market. The profit function is the difference between the revenue and cost:

If Saudi Aramco suppose produce q0 quantity in the above graph then it will not make any profit so that in a break even situation and if the company produce quantity q then the profit is higher and a company. Such as, Aramco if try to maximize the profit must produce q level of quantity and on the other hand, output level goes behind the q is maximize the revenue but not the profit because of the increment of the marginal cost. Therefore, the output in q0 is 100 million barrel and q is 150 million barrel then Saudi Aramco should produce the q level of output that means 150 million output which certainly higher the profit.
References
Baumol, William. & Alan Blinder. Economics: Principles and Policy. South-Western College Pub. 2008. Print
DPAD. Contract Pricing Reference Guides. 2010. Web.
DPAD. Cost Estimating Relationship. 2010. Web.
DPAD. Cost Volume of Profit Analysis. 2010. Web.
DPAD. Introduction to Contract Pricing. 2010. Web.
DPAD. Measurement of Price Index. 2010. Web.
DPAD. Statistical analysis, 2010. Web.
IOGA. History of Illinois Basin Posted Crude Oil Prices. 2009. Web.
Oehlert, Mark. How do I measure return on investment (ROI) for my learning program. 2002. Web.
Pearson Education. Marginal Revenue, Cost, and Profit Maximization. 2005. Web.
Roy, Udayan. Profit maximization by firms. 2008. Web.
Saudi Aramco. Taking the initiative: Annual Review 2006 Saudi Aramco. Web.
Sykes, Alan. An Introduction to Regression Analysis. 2009. Web.
Wantedtech. Staffing Payback Period. 2009. Web.
Watkins, Thayer. An Introduction to Cost Benefit Analysis. 2010. Web.