Introduction
The present report aims at analyzing factors that affect the commuting time of students to the university. The report is based upon data from 151 randomly selected university students surveyed in 2017, among which 100 were males, 45 were females, and 6 preferred not to specify their gender. The university students were categorized by domicile status, including students from the UK, the EU, and international students. The students were also categorized by their age into three groups, which were students of 18- and 19-year-olds, 20- and 21-year-olds, and students over 21 years of age.
The survey did not specify the exact age of students for ethical considerations and calculation purposes. The students lived in different types of accommodations, which were the Priory Hall, University self-catering halls of residence, university house, privately rented house or flat, parents home, own home, and others. Apart from average commuting time to the university, the survey assessed 13 other variables, among which are demographical data, employment status, and information about academic performance. The level of satisfaction with accommodation was also assessed with possible replies, including “yes, very;” “yes, it’s reasonable;” “no.” The present report will determine how demographical characteristics, such as gender, student domicile status, and age, affect commuting time to the university.
Analysis
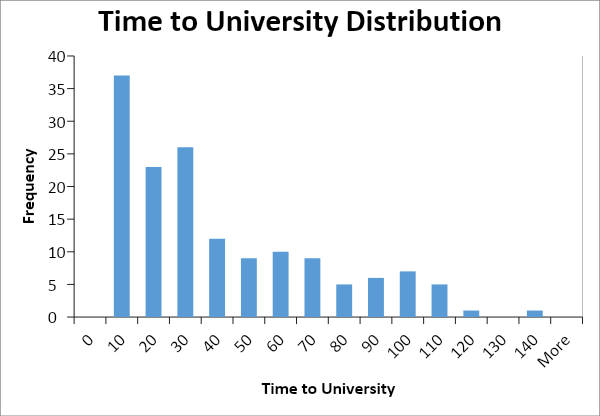
Time to University Distribution
According to the survey data, the students spend up to 145 minutes getting to the university. Figure 1 below presents information about the distribution of travel to the university. As one can observe, the mean of the data sample is 38.81, with a standard deviation of 31.82. However, since the histogram is rightward skewed, the median value is more representative for demonstrating the central tendency of the data sample. The median of the data sample is 30, which implies that the majority of students need 30 minutes or less for commuting.

The observations also show that the variability of data is high. Additional analysis was required to understand the reasons for such variability. Therefore, it was decided to analyze how demographic features affect the time students spent traveling from home to university.
Types of Students
The first assumption was that commuting time is affected by the type of student. There are three types of students studying in the university according to their domicile status. Table 1 below demonstrates descriptive statistics of time to university depending on the type of student. The observations show that there is no significant difference in the mean or standard deviation values of time to university, depending on the type of student. This implies that domicile status has no predictive ability for time to the university.
Table 1. Descriptive statistics of time to the university by domicile status.
Gender
The second assumption was that commuting time depends on the gender of the students. The sample included 100 male students, 45 female students, and 6 students who preferred not to specify their gender. Table 2 presents descriptive statistics of commuting time sorted by gender. The observations revealed that, on average, females spent more time than males to get to university. The hypothesis was confirmed by a two-sample t-test showing that with a confidence level of 95%, there is a difference in means of commuting time between male and female populations (p = 0.037). Therefore, it may be concluded that gender has an effect on the time it takes students to get to university.
Table 2. Descriptive statistics of time to the university by gender.
Age
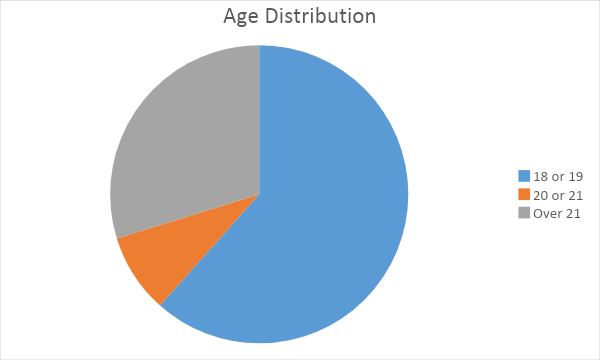
The third assumption was that there is a correlation between age and commuting time. The distribution of ages of the sample is presented in Figure 2 below.

The effect of age was assessed using descriptive statistics of time to the university by age groups demonstrated in Table 3 below. The observations revealed that students of 21 spend significantly more time getting to the university. The hypothesis was confirmed with ANOVA analysis that revealed that there is a difference in means of the three age groups with a confidence level of 95% (p = 0.0119). Therefore, it may be concluded that age affects the commuting time to the university.
Table 3. Descriptive statistics of time to the university by age.
Conclusion
The results of the analysis revealed that the majority of students spend 30 minutes or less to get to university. This time is affected by gender, as females tend to need more time for commuting in comparison with males. At the same time, older students tend to spend more time commuting than younger ones. The domicile status did not appear to have any effect on commuting time. Further analysis is required to assess the impact of other variables on the time it takes students to get to the university.