Quantitative methods are essential instruments of today’s empirical research. Descriptive statistics provide their foundation, as well as being one of the first steps to more complex analytical techniques. In the current paper, a set of descriptive statistics on the sample of blood sugar counts of male and female patients will be closely explored.
Summary of Results
Table 1 summarizes the required descriptive statistics for the male and female samples of blood sugar observations. The five considered indicators are: the counts, minimums, maximums, means and standard deviations.
Table 1. Descriptive statistics.
The SPSS output on which this table is based can be found below.

It can be seen from Table 1 that a higher mean of blood sugar levels is observed for male patients compared to females (178 versus 118.5), which means that the better levels of sugar in the given subsample are associated with the female gender. At the same time, male blood sugar levels also show a higher variation in terms of both standard deviation and range. The difference between the maximum and minimum values was 484 for male patients (= 505 – 21) and 329 for female patients (= 390 – 61), and the standard deviations for the two genders were 182.031 and 113.339, respectively.
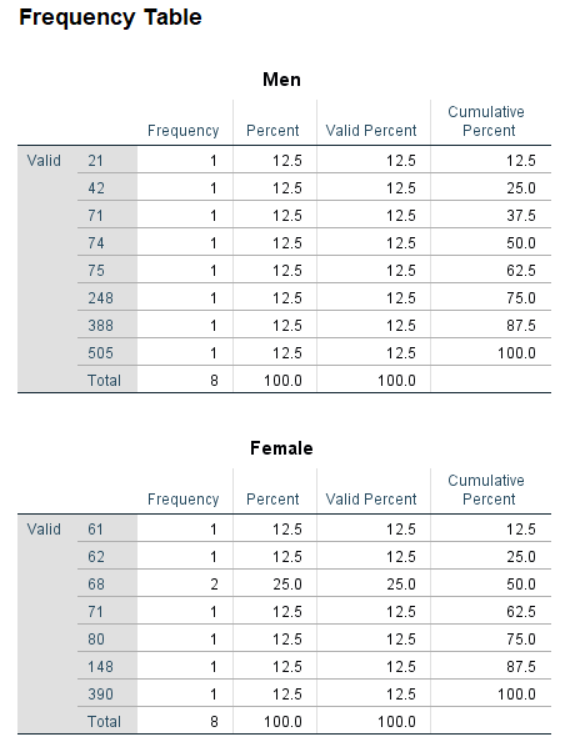
The general frequencies for the two categories are equal to 8, and the more detailed frequency distributions are shown on the figure below.

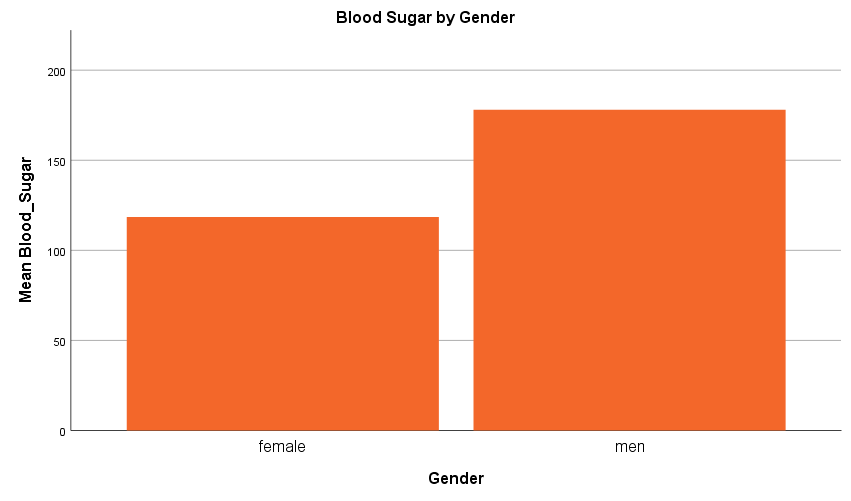
It can be seen that each of the observations has a unique value, except for the blood sugar level of 68 for females, which is encountered twice. This observation can also be referred to as the mode of the considered subsample. The bar chart with gender at the x-axis and blood sugar levels at the y-axis is also provided below, once again proving that the mean blood sugar levels for male patients are higher than for females.

Application of Analysis to My Prospectus
My DPI project topic is focused on the use of capnography during resuscitation of patients in coronary care units. The study includes the participation of patients from the experimental and control groups, and the inclusion of such variables as the level of end-tidal carbon dioxide (ETCO2), levels of awareness of capnography among nurses, and mortality rates. Descriptive statistics can be useful in this context in order to make a first step in evaluating the differences in outcome distributions between the two groups.
One example of the use of descriptive statistics in a study related to capnography is presented in the paper by Bullock, Dodington, Donoghue and Langhan (2017, p. 459), where the authors explore the demographic and medical characteristics of the patients of the considered pediatric emergency department. Another example is the study by Ono et al. (2017, p. 648), which focused on Japanese patients.
Conclusion
As can be seen from the discussion above, descriptive statistics can be helpful in providing empirical research in the field of medicine. It can be viewed both as an independent analytical instrument and also the first step to the implementation of more advanced methods, such as two-sample tests of regression analysis frameworks.
References
Bullock, A., Dodington, J. M., Donoghue, A. J., & Langhan, M. L. (2017). Capnography use during intubation and cardiopulmonary resuscitation in the pediatric emergency department. Pediatric emergency care, 33(7), 457.
Ono, Y., Tanigawa, K., Shinohara, K., Yano, T., Sorimachi, K., Sato, L. & Tase, C. (2016). Difficult airway management resources and capnography use in Japanese intensive care units: A nationwide cross-sectional study. Journal of anesthesia, 30(4), 644-652