Abstract
The paper examines the financial performance of a five star hotel located in the Perth CBD. There is high competition in Perth CBD because none of the hotels have exclusive features. What one hotel offers can be found in another within the same city. The hotel follows the trend in the market. Occupancy rates start to peak in June and extend until December. There is a slight drop in the occupancy rate only in October and November. The paper refers to Fraser Suites for prices and estimates. Fraser Suites Perth is also examined for competitive advantage. Most of the five-star hotels in Perth are global brands. There is a lack of absolute competitive advantage because most of the hotels share a lot of similarities. Customer service can create a distinction among other hotels. The report develops weakness from the fact that five-star hotels present their financial statements as a group. The estimates would be more accurate if the subsidiary would present its departmental financial statement.
Financial Performance
The hotel performs moderately in the rooms department. Profitability in the rooms department exceeds $3 million annually. The F & B department has poor financial performance. The income returns in the F & B department does not match the income returns in the industry. A hotel performing well should have a return rate higher than the industry rate of 9.3% within the Perth CBD (Colliers International, 2013).
Prices change according to the market demand. Demand changes according to seasons. There has been a high demand for accommodation in Perth since 2006. The accommodation prices rose by about 31% between 2007 and 2009 (Access Economics, 2010). The return on new hotel investment increased from 4.6% to 5.4% within the same period. A hotel has to charge an average rate of $450 per night and have an average occupancy rate of 80% to yield a capital return rate of 5.4% (Access Economics, 2010).
High construction costs and the high cost of land put pressure on hotels to charge higher rates to make high returns on investment. Currently, the income return for all hotels is estimated at 8.2%. In 2012, hotels within CBD areas gave an investment return rate of 9.3% (Colliers International, 2013).
Perth is considered a hub for other cities in Australia. Estimates indicate that 70% of international visitors use Perth as their arrival place (Access Economics, 2010). Passenger movements are also facilitated by the Perth airport. It is estimated that 695,000 international visitors came to Western Australia in 2009. It represents a rise of 3.2% annually in the number of visitors. Interstate visitors constitute 83% of all domestic visitors to Western Australia. Out of these, 68% may book hotels.
Most hotels in Perth have an average occupancy level of about 85% during the peak season. The occupancy rate is about 85% in December, about 70% between June and September, and less than 70% in January. Interstate visitors per night expenditure are estimated at $685, and international visitors at $2,264 (Access Economics, 2010). In 2012, Perth City reported an occupancy rate of 85.0% for all hotels. It has the highest occupancy rate in Australia followed by Sidney at 84.5% (Colliers International, 2013).
Current Hotel Facilities Budget
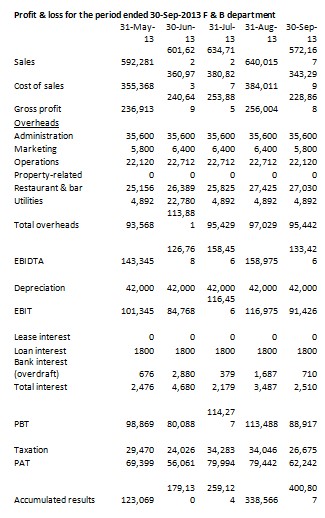
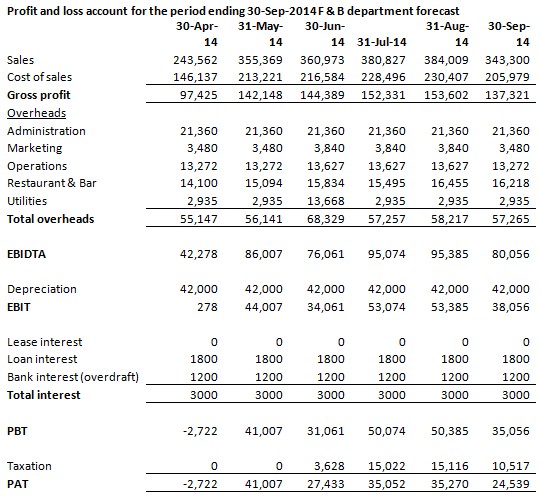
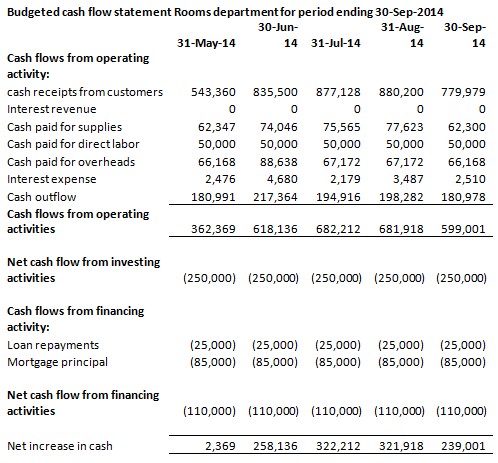
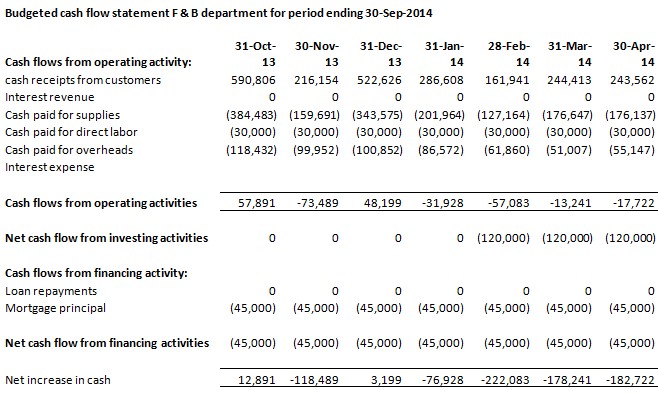
The budget, profit & loss accounts, and cash flow take the trend described by Access Economics (2010) and Colliers International (2013). Hotel occupancy is at peak in December, June, and July at about 80%. The occupancy falls to about 50% between January and April. It is about 70% in October and November.
The calculations use 200 rooms for estimation and Fraser Suites Hotel rates for rooms, food and beverages. The expected occupancy during seasons with low demand is about 50%. It is 80% when demand is high. The following are the room estimates per night. These are higher rates. Sometimes the hotel sells rooms at rates lower than $300.
The pay award for cleaners, caretakers, and security guards are about $660 weekly (Cleaners and Caretakers WA Award Summary, 2013). The award rates from level 1 to 6 range from $1,291.90 to $ 1,611.20 a fortnight for hotel and tavern workers (Hotel and tavern workers state award summary, 2013). The hotel will need to pay slightly higher than the minimum wage rate to retain experienced employees. The hotel employs from 20 to 30 workers per department.


Financing Options
Contractors may work with their funds during the project. However, contractors are considered high-risk borrowers attracting higher rates of interest. The company can finance part of the project during the operations and complete the payment balance at the project completion (Halpine & Senior, 2010). The company will issue $1,200,000 to the contractor at the beginning of February 2014 for the purchase of materials. It will issue additional monthly payments to cover part of the direct labour costs. The contractor will charge cost and a 25% markup price at the end of the project. The firm expects the project to incur about $6.5 million. The firm needs to raise an additional $4 million to cover the cost of the project and operational needs.
The project will close two floors for renovation at one particular period. The firm expects the closure of two floors and the renovation activities to reduce revenue by about 30%. Part of the finance raised will be used to cover the reduction in cash inflow.
Financing of debts will require the firm to pay the debt and interest. The debt will affect the cash flow of the firm through large amounts that are paid out as principal repayment (Frederick & Terjesen, 2006). Commercial banks are one of the good sources of debt financing. Finance companies that lend using assets as securities may charge 2% to 6% above the rate charged by commercial banks. Commercial banks in Australia may charge about 7.5% for long-term loans. Debt provides a good option for the firm because the interest rates are likely to be lower than the income return rate of the hotels which is at 8.2% (Colliers International, 2013).
A loan that exceeds one year repayment period is classified as a long-term loan. Long-term loans have higher interest rates than short-term loans. The high-interest rate takes into account the high demand for long-term loans, risk of inflation, and variations in the market interest rates (Megginson & Smart, 2009). Lenders also evaluate the risk associated with the borrower. The borrower’s debt ratio or interest-earned ratio may be used to assess the borrower’s risk.
Bank overdrafts are charged a rate of 7.83% p.a. on the amount that is withdrawn. The interest is calculated on a daily basis. The interest rate increases as the repayment period increases. It may be 5.75% p.a. for a one-year loan and 6.71% p.a. for a five-year loan (Business Loans rates, 2013). The firm had a net income that exceeded $3 million in the year before the project. It will be able to pay back the interest and principal. Using finance from loans may deny shareholder dividends for a long period.
Corporations can also use term loans which may have a repayment period between 5 years and 12 years. Megginson & Smart (2009) explain that “a term loan is a loan issued by an institution to a business with a maturity period that exceeds a year” (p. 532). The interest rate for term loans may be higher or lower than the market rate depending on the risk that the hotel poses.
Equity allows the company to pay dividends only when the firm has made a profit. One disadvantage of equity is that it allows new members to share the ownership of the firm. They are entitled to make decisions through voting. They must be given their portion of dividends each time profits are shared (Frederick & Terjesen, 2006). Frederick & Terjesen (2006) explain that a company that can afford the principal repayment and interest should consider using debt before equity.
Corporate bonds also provide a source of financing in the form of debts. Corporate bonds pay a coupon rate each year and the face value at maturity of the term. Floating-rate bonds have their coupon rate adjusted periodically to match market lending rates. A debenture is a type of corporate bond. Frederick & Terjesen (2006) explain that “convertible debentures are unsecured loans that can be converted into shares” (p. 23). The lender and borrower agree on the conversion rate and interest rate when the deal is settled. Debentures provide the firm with the flexibility to change them into shares if the renovation project fails to meet revenue target results.
Market and Competitive Position
Customers recognize Fraser Suites Perth for its stylish features. Customer service is also highly rated (Fraser Suites Perth reviews, 2013). Customers recognize Hyatt Regency Perth for large rooms for a relatively lower rate. Customers have complained that Hyatt Perth has outdated bathrooms/washroom facilities (Hyatt Regency Perth reviews, 2013). However, their cleanliness has been recognized.
Most firms change their prices according to demand. The prices may start at $150 minimum during low-demand season and $300 during high-demand season. Different hotels offer different rates in Perth CBD. Fraser’s full rate ($700) is moderate among the Perth five-star hotels when comparing prices. The Richardson Hotel & Spa ($675), Parmelia Hilton Perth ($630), Pan Pacific Perth ($630), Hyatt Regency Perth ($650), Duxton Hotel Perth ($499), Crown Metropol Perth ($1,000), The Terrace Hotel Perth ($360), Beach Manor B&B ($245) (Perth hotels, 2013). These are some of the prices that were advertised on a website in the month of October 2013. All hotels in Perth offer competitive prices. Fraser Suites Perth offers moderate prices compared to its competitors.
Most five-star hotels in Perth are subsidiaries of global firms. Fraser Suites and Hyatt Regency Perth are examples of hotels with a global brand. Hotel performance may be influenced by the performance of the group. The hotel brand gives it a competitive advantage. The firm also needs intensive advertising to maintain the influence of the brand.
Reference List
Access Economics. (2010). Perth hotel economic impact study: final report. Canberra: Access Economics.
Business loan rates. (2013). Web.
Cleaners and caretakers WA award summary. (2013). Web.
Colliers International. (2013). Not enough beds? Investor demand and room supply on the increase. Canberra: Colliers International.
Fraser Suites Perth. (2013). Web.
Halpin, D., and Senior, B. (2010). Construction management (4th ed.). Hoboken: John Wiley & Sons.
Hotel and tavern workers state award summary. (2013). Web.
Hyatt Regency Perth reviews. (2013).
Megginson, W., & Smart, S. (2009). Introduction to corporate finance. Mason: South-Western Cengage Learning.
Perth hotels. (2013). Web.
Terjesen, S., & Frederick, H. (2006). Sources of funding for Australia’s entrepreneurs. Raleigh: Lulu Press.