Introduction
Marketing refers to the activities and procedures used in developing, conveying, and exchanging various offers that are valuable to the targeted population. Thus it helps in formulating strategies that facilitate sales and business development.
This paper focuses on two marketing strategies namely, blue ocean strategy and guerilla marketing. It also analyzes two marketing tools namely, the “Porter’s diamond model for competitive advantage” and BCG matrix analysis. The objectives and applications of these concepts will be illuminated in the paper.
Blue Ocean Strategy
Definition
This is a strategy “that enables firms to realize high growth and profits by creating new demand in an uncontested market space” (Kim & Mauborgne 2005, p. 4). The market that is yet to be discovered is thus referred to as the blue ocean.
The existing markets that are characterized by competition are referred to as the red oceans. There are enough growth opportunities in the blue ocean due to lack of competition. The blue ocean strategy is based on three concepts namely, “value innovation, tipping point leadership, and fair process” (Kim & Mauborgne 2005, p. 4).
Objective
The main objective of this strategy is to help firms to identify new market space. This enables them to eliminate the risk associated with cutthroat competition associated with existing markets (Kim & Mauborgne 2005, p. 5).
Implementation Steps
The implementation of this strategy is based on six principles. The first four principles deal with the development of the blue ocean strategy and can be explained as follows. Formulation of the blue ocean strategy is based on the concept of value innovation. Value innovation is “the simultaneous pursuit of differentiation and low cost” (Kim & Mauborgne 2005, p. 6).
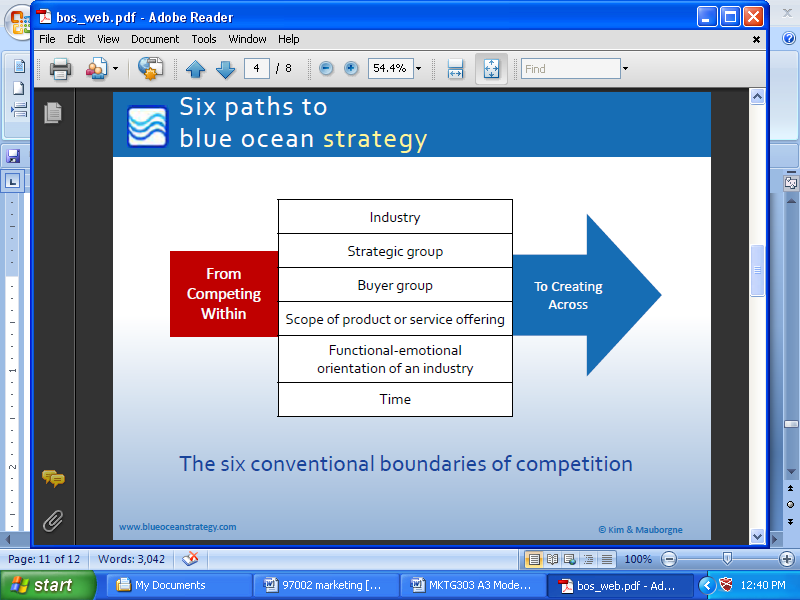
The first principle involves reconstructing the boundaries of the market (Kim & Mauborgne 2005, p. 47). This means that the firm moves from the red ocean to the blue ocean. This transition is illustrated in figure 1. It is the first stage in formulating the blue ocean idea. The transition involves considering six options referred to as the six paths.

The options include identifying new opportunities “across the industry, buyer groups, and strategic groups” (Kim & Mauborgne 2005, p. 48). For example, the firm can identify a need that has not yet been satisfied in the market. The other options involve identifying opportunities “across time, scope of product or service offering and functional-emotional orientation of the industry” (Kim & Mauborgne 2005, p. 49).
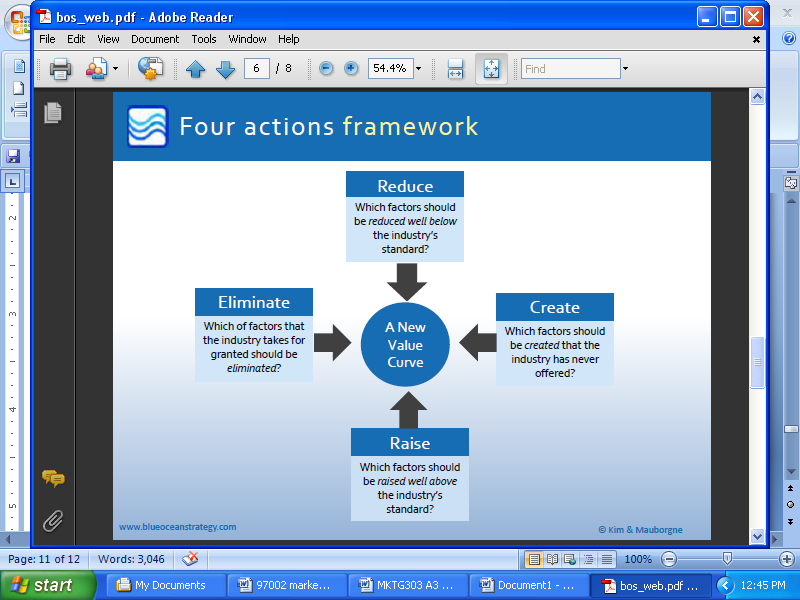
“Focusing on the big picture” (Kim & Mauborgne 2005, p. 81) is the second principle. This is the planning stage and is achieved through the four-action framework. The application of this framework is illustrated in Figure 2 and can be explained as follows. The first element involves creating new factors that do not exist in the industry. For example, a new product that satisfies an existing or an emerging need.

The second element involves identifying the most valuable needs or factors and satisfying them through superior services or products. An example of this element will involve focusing on superior products by significantly improving their quality. The third element is characterized by the identification and elimination of the factors or needs that are no longer relevant in the industry (Kim & Mauborgne 2005, p. 92).
For example, product features that are no longer useful to customers can be eliminated. Finally, the firm is expected to identify and reduce the factors that should be maintained below the industry level. For example, the price can be maintained at below the industry level in order to facilitate market penetration. These elements facilitate the process of value innovation.
The third principle involves creating new demand. This involves aggregating demand by focusing on the commonalities of noncustomers. Getting “the strategic sequence right” (Kim & Mauborgne 2005, p. 117) is the fourth principle. The strategic sequence refers to the manner in which the blue ocean idea should be executed in order to ensure stable and consistent growth.
Thus the firm must properly address the utility and cost concerns. Besides, it must formulate effective pricing policies and meet the adoption requirements in order to realize a feasible blue ocean strategy. The fifth and the six principles deal with the implementation of the blue ocean strategy. The fifth principle involves surmounting the organizational barriers.
It is based on the concept of tipping leadership which deals with the management of organizational risks. The organizational risks that should be addressed at this stage include “cognitive, motivational and resource risks” (Kim & Mauborgne 2005, p. 147). The last principle involves incorporating the execution into the strategy. It is based on the concept of fair process which addresses management risks such as attitudes. It helps in ensuring cooperation at the implementation stage.
Example
The mobile phone money transfer services in East Africa can illustrate the strategy. The low segment of the market had been taken for granted by local banks in the region. Thus Safaricom, the dominant mobile phone services provider, looked across its product line and consumer groups and identified the opportunity.
It was the first firm to launch mobile phone money transfer services (blue ocean idea) in partnership with banks in the region (Safaricom 2011). It also targeted the low-income earners who had no bank accounts. Due to the value added by the new service, the firm’s customer base tripled in one year.
Strengths and Weaknesses
The strategy has two strengths which are as follows. First, it provides consistent and reproducible procedures that can be used by all firms to formulate a blue ocean strategy (Welhrich 2010, p. 125). Second, its tools are visually oriented and this facilitates clear understanding of the concepts.
The main weakness of the strategy is that it does not emphasis the role of brand and communication. It assumes that value innovation is realized automatically (Welhrich 2010, p. 126). However, this might not be the case due to external factors such as legal requirements.
Guerilla Marketing
Definition
This is a “form of marketing which relies on the use of innovative, unexpected and quirky techniques to familiarize people with a brand” (Levinson 2005, p. 5). Thus it is an unconventional marketing strategy that depends on time, energy and creativity instead of financial capital.
Objective
The objective of guerilla marketing is to gain publicity through unconventional marketing methods (Levinson 2005, p. 10). Thus it focuses on the formulation of a unique and engaging marketing strategy. This helps in attracting and retaining customers.
Implementation Steps
Guerilla marketing is meant for the small or medium sized firms. However, the large sized firms can also use it to market their products. It can be implemented as follows. The first step involves setting the marketing objectives. Under normal circumstances, the main objective should be to get as many referrals and transactions as possible from the existing clients.
The marketer should also aim at cooperating with his competitors instead of outperforming them. The second step involves formulating the marketing strategy. The marketing strategy should be “based on human psychology” (Jay & Jannie 2007, p. 13) and informed by creative and unique ideas.
The third stage involves selecting the marketing communication channel. A number of channels should be used in order to maximize results. The marketer’s messages should target individuals in order to engage the customers effectively (Levinson 2005, p. 37). Modern technology such as the internet should be used to enhance effective communication (Baltes & Leibing 2007, vol.109, pp. 46-55).
Planning for the implementation is done in the fourth stage. The plan should focus on time, energy and creativity instead of financial resources. This is followed by the implementation of the marketing plan which involves rolling-out the marketing campaign using the chosen communication channels. The final stage involves measuring the success of the strategy. In this case, profit is the main success indicator.
Example
An example of guerilla marketing involves a video advert that does not conform to the usual procedures. For instance, the advert can be made unique by defying the recommended color choices, contrast and the balance between pictures and words. Another example involves issuing free samples to the public.
Strengths and Weakness
The main advantage of guerilla marketing is that it requires little resources but maximizes results (Levinson 2005, p. 56). It also helps companies to establish long-term relationships with their clients since it focuses on individuals.
The main weakness of the strategy is that profits might not be the best measure of success (Levinson 2005, p. 67). This is because a rise in profits could be as a result of any other factor such as improvement in efficiency instead of the effectiveness of the marketing strategy.
Porter’s Diamond of Competitive Advantage
Definition
This is a framework that illustrates the “manner in which an organization’s ability to create competitive advantages at the international level is influenced by its home base” (Walker 2003, p. 117). The base (country) is associated with the factors that enable or prevents a firm from creating competitive advantages in the global market.
Objective
The objective of this technique is to provide the information that is needed to identify the available resources and how to develop them in order to create advantages (Walker 2003, p. 120). The information also influences the innovation process.
Implementation Steps
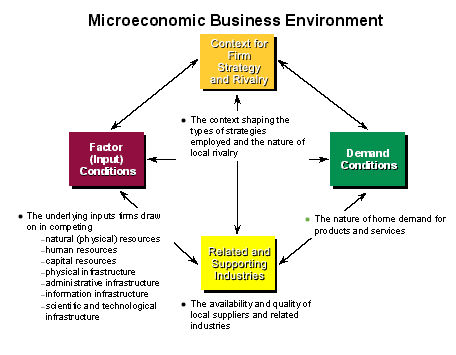
According to Porter, a country’s competitiveness is determined by four factors namely, “firm strategy, structure and rivalry, demand conditions, related and supporting industries and factor conditions” (Morschett, Schramm & Zentes 2010, p. 78). The interrelationship between these determinants is illustrated by figure 3 (the diamond) and can be explained as follows. Factor condition is the first element on the diamond.

According to this element, a nation usually generates its own factors of production. The impotence of these factors depends on the degree to which they are developed and used in a country. The shortage of the factors thus necessitates innovation (Walker 2003, p. 145). In the context of marketing, this element helps in planning for resource allocation. For example, a firm in a country with cheap internet technology will focus on e-marketing in order to reduce costs.
The demand condition is the second element. In this case, local firms will be more interested in a product than foreign firms if the demand for that product is higher in the domestic market as compared to the overseas market. Thus competitive advantages are created when the product is exported.
A “strong trend setting local market helps local firms anticipate global trends” (Walker 2003, p. 158). This is based on the fact that the local market has a greater potential to determine the ability of the firms to identify customer’s needs as compared to international markets. Thus this element helps a firm to understand the demand for its products in order to formulate the right marketing strategy.
The third element relates to the effect of the related and supporting industries. According to this element, firms will benefit from relatively cheap and innovative inputs if the supporting industries in the domestic market are competitive. This effect is reinforced if there is a strong competition among suppliers at the international level (Morschett, Schramm & Zentes 2010, p. 97).
“Firm strategy, structure and rivalry” (Walker 2003, p. 171) is the last element. It relates to the management style and the manner in which companies are organized. This determines the work morel and the operation of the firms. Thus a country whose business laws support an effective company structure will have more advantages.
Figure 3 indicates that the four factors are interdependent. For instance, innovation can not be realized due to factor disadvantages in the absence of rivalry. The role of the government is to encourage firms to be more competitive. It does this through regulation and facilitating the creation of factors of production.
Example
The Japanese motor industry illustrates the application of this technique. Car manufacturers from Japan have dominated the global car industry due to the following advantages. Factor condition is represented by the large number of highly skilled mechanical engineers in the country. The demand condition in the country is characterized by “a demanding market due to the written language” (Sally 2005, vol. 10, pp. 341-356).
There is a large number of supporting as well as related industries that supply car parts at low costs and high quality. Rivalry in the country’s car industry led to innovation as well as cost reduction. Finally, the government supports the industry through incentives such as tax holidays.
Strength and Weaknesses
The main strength of the strategy is that it provides a comprehensive analysis of the factors that determine the competitiveness of a firm at the international level (Walker 2003, p. 25). The information provided by this analysis informs the process of formulating the marketing plan.
The disadvantage of the strategy is that it focuses only on the industry. It ignores the contributions of individual firms in regard to the process of creating competitive advantages.
BCG Matrix Analysis
Definition
This is a marketing tool “that uses a chart to analyze the performance of products or business units” (Kurtz & Snow 2009, p. 65). The analysis focuses on the market share as well as the growth rate associated with a brand or a business unit.
Objective
The main objective of the BCG matrix analysis is to provide the information that is needed when allocating resources. It enables managers to identify the brands that should be funded and those that should be eliminated (Kurtz & Snow 2009, p. 71).
Implementation Steps
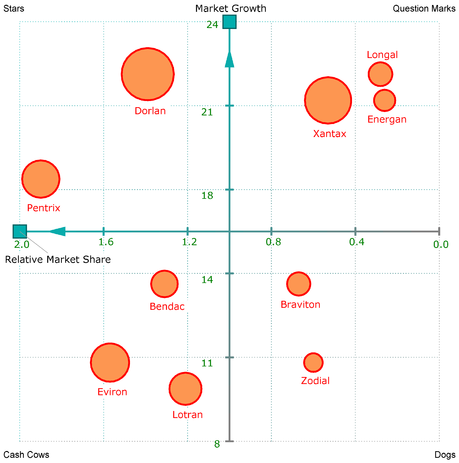
The BCG matrix is illustrated by figure 4. Drawing the graph is the first step in using the technique. The graph is then used to rank the “products or business units according to their market share and growth rates” (Grant 2005, p. 488). The circles on the graph (figure 4) represent the products. The size of the circle corresponds to the product’s market share. The graph (figure 4) is divided into four parts which can be explained as follows.

The cash cow represents the brands whose market shares are high (Grant 2005, p. 488). Besides, the industries of such brands are characterized by a slow growth rate. The revenue generated by products in this category exceeds the amount needed to sustain the firm. This means that such products are profitable and every firm strives to own them.
The dogs represent products associated with “low market share in a mature and slow-growing industry” (Grant 2005, p. 489). Products in this category are only capable of breaking-even. This means that the revenue they generate is hardly enough to sustain the firm. Thus they should be sold since they lower returns on assets.
Question marks denote the products associated with rapid growth and thus maintaining them requires a lot of financial resources. The products in this category do not generate a lot of revenue since their market share is low. They are expected to attain the “status of cash cows if the market growth rate declines” (Kurtz & Snow 2009, p. 92).
Stars denote products whose market shares are high and their industries are characterized by rapid growth. They usually attain the status of cash cows when the growth declines (Kurtz & Snow 2009, p. 93).
Example
The British Airline illustrates the application of BCG matrix analysis. The company has four product lines namely, long-haul flights, regional flights, domestic flights and mail services (British Airways 2011). Regional flights (within Europe) accounts for 70% of the firm’s revenue (British Airways 2011).
This is therefore the cash cow since the industry is also mature. The long-haul flights market (intercontinental) is mature and dominated by major airlines such as Lufthansa. British Airways’ market share is thus low (British Airways 2011). Consequently, the firm discontinued some of its long-haul flights and opted for an alliance with American airlines in order to connect its passengers to the discontinued routes.
The long-haul flights are thus classified as dogs. British Airways being the largest airline in UK has the largest market share in the domestic aviation industry. The industry is growing rapidly as more firms join it. Thus the domestic flights are classified as stars. The mail services are classified as question marks. This is because even though their market is growing rapidly, the cost of offering the services is high due to the rise in fuel prices.
Strengths and Weaknesses
The main strength of the BCG strategy is that it facilitates rational allocation of resources. Such allocations are based on the performance of a product line. However, the strategy is associated with two weaknesses which are as follows. First, it only concentrates on “market share, industry growth rate, and profitability” (Grant 2005, p. 489). Thus it ignores other aspects of the industry such as competition. Second, it is not very accurate since ranking of the products is done subjectively.
References
Baltes, G & Leibing, I 2007, ‘Guerilla marketing’, New Library World, vol. 109, no. 2, pp. 46-55.
British Airways 2011, Annual reports, <https://www.britishairways.com/travel/home/public/en_ua>.
Grant, R 2005, Contemporary strategy analysis, John Willy and Sons, New York.
Jay, L & Jannie, L 2007, Startup guide to guerrilla marketing, Entrepreneur Press, London.
Kim, C & Mauborgne, R 2005, Blue ocean strategy: how to create uncontested market space, Harvard Business School Publishing, New York.
Kurtz, D & Snow, K 2009, Contemporary marketing, Cengage Learning, New York.
Levinson, J 2005, Guerilla marketing during tough times, Morgan James Publishing, Boston.
Morschett, D, Schramm, H & Zentes, J 2010, Strategic international management, Gabler Verlag, London.
Safaricom 2011, Products, <https://www.safaricom.co.ke/>.
Sally, S 2005, ‘Does Porter’s diamond hold in the global automobile industry?’, Advances in Competitiveness Research, vol. 10, no. 3, pp. 341-356.
Walker, G 2003, Modern competitive strategy, McGraw-Hill, New York.
Welhrich, H 2010, Management, McGraw-Hill, New York.