Aim of the paper
The paper seeks to carry out a descriptive analysis of a data set. Specifically, the data will focus on estimating the measures of central tendency using SPSS.
Analysis of the result generated from SPSS
The results generated from SPSS shows that the mean age in the data set is 54.633 years while the mean marital status is 1.833. Further, the age that falls in the middle is 55 years while the median marital status is 2 (married). Also, it can be pointed out that the most occurring age in the data set is 55 years while the model marital status is 2 (married).
The modal marital status can be explained by the fact that a large percentage of the data comprises of older people. The results also show that the age deviates by 10.33 from the average age, while marital status deviates by 0.74664 from the mean. The maximum age in the data set is 78 years while the minimum age is 27 years. This generates a range of 51 years between the two extreme values.
On the other hand, the maximum measure of marital status in the data set is 3 while the minimum measure of marital status is 1. This generates a range of 2 between the two extreme values (Baltagi, 2011; Blank, 2011). A summary of the descriptive statistics is presented in exhibit 2.
Graphical representation of data
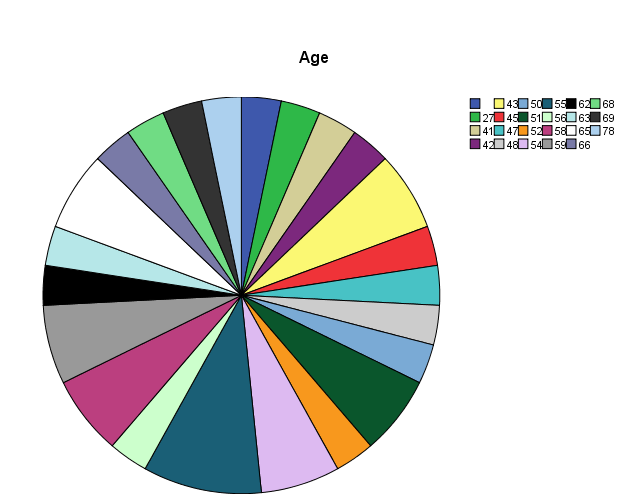
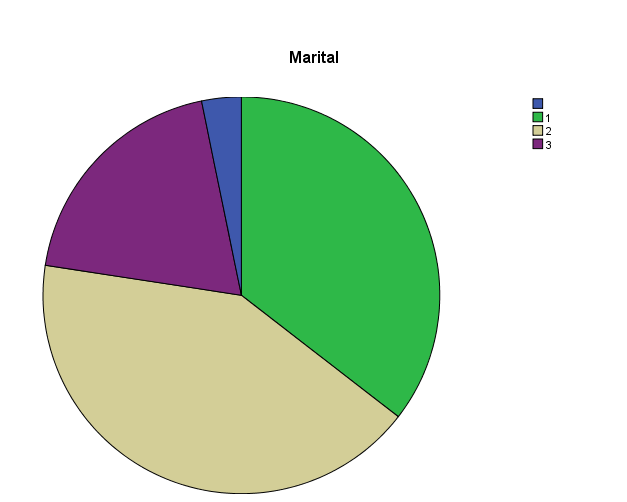
The data set can also be analyzed using graphs. In this case, a pie chart will be used to display the frequency of occurrence of the various values in the data set. The pie charts are presented in exhibit 3.
Exhibits
Exhibit 1: Data
The data set contains two variables. The first variable is age. Age is measured as a continuous variable. The second variable is marital status. The marital status is measured on a nominal scale that lies between 1 and 3, where 1 represents single, 2 represents married while 3 represents divorced people in the data set. The data were collected from a sample of thirty people (Blank, 2011). The table presented below shows the data used in the analysis.
Exhibit 2: Descriptive statistics
Exhibit 3: Pie charts
The pie chart for age shows that the most frequent age in the data set is 55 years at 9.7%, while the least percentage is 3.2%. A number of ages in the data set occur only once. The figure presented below shows the pie chart for age (Baltagi, 2011).

On the other hand, the pie chart for marital status shows that the data set contains a high percentage of married people, that is, 41.9% followed by single people at 35.5%. Divorced people take the least percentage in the data set, that is, 19.4%. The figure presented below shows the pie chart for marital status (Verbeek, 2008).

References
Baltagi, B. (2011). Econometrics. New York, United States: Springer.
Blank, K. (2011). Business statistics: For contemporary decision making. New Jersey, United States of America: John Wiley & Sons.
Verbeek, M. (2008). A guide to modern econometrics. New Jersey, United States of America: John Wiley & Sons.