Abstract
Ecological fieldwork is one of the demanding areas in ecology especially in regard to the utilization and interpretation of data obtained. Usually, the discovery of patterns in the data provides a lot of information and insights on the different aspects which affects the abundance and availability of species which constitutes biodiversity. However, most species are sparsely distributed within the community and therefore only a limited number is available for statistical analysis. The main concern of this biodiversity study is to empirically establish whether human beings have got any notable and significant impacts to the biodiversity of the seashore. A summary of the biodiversity of the seashore is important in this approach as well a baseline study on the same which will otherwise act as a key reference point.
Introduction
A habitat refers to the residence of either plants or animals. Besides, other species as well are included in a habitat whereby they exist as an assemblage contrary to living alone. It may also be used to infer both the physical and environmental condition where a community of species can exist. This practical report presents the main physical habitats and biotopes on the seashore alongside their characteristics in terms of existence and human interaction in a wider biodiversity spectrum (Marine Monitoring Handbook 2010).
Methods
The task was aimed at selecting two study sites on the coast outside Leigh Marine Laboratory. After the study, the evaluation in terms of habitat distribution was required. Besides, any possible human impact on the species courtesy of the baseline study was to be analysed. In order to perform the practical, a digital camera was necessary. Correct sampling methods of the habitat would then follow. As a result, a data recording sheet was prepared to enter all the relevant field details. The major habitats on the seashore were then selected for study and the estimate of the relative abundance of the conspicuous species. The height above sea level of the species found was also determined. Thereafter, a record of all the species sampled was put in a tabular form.
Results
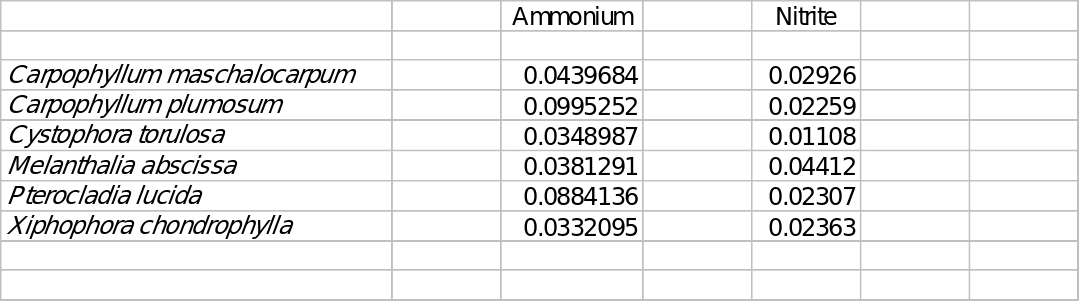
As can be observed from the baseline survey, the uptake co-efficient of both ammonia and nitrite had slight changes compared to the study carried out at he seashore. For instance, the ammonium intake for carpophyllum on the baseline survey was 0.0439683908 while the intake co-efficient for nitrite on the same species was 0.029580989 from the baseline study (Cumming 1980). However, when the same species is compared with the data taken from the seashore, it is found that the uptake co-efficient for ammonium was 0.0439684 while that for nitrite was 0.02926. On the same note, xiphophora species recorded an uptake coefficient of 0.0332095 for ammonium and 0.02363 for the nitrite. This was on the biodiversity habitat study conducted at the marine site. Nevertheless, the baseline study from Cumming (1980) showed that xiphophora chondrophylla species had an ammonium co-efficient intake of 0.0332095 whiles the intake co-efficient for nitride was 0.02363. The other species surveyed also demonstrated similar deviations in the co-efficient intake of both ammonium and nitride.
Discussions
The main aim of this study was to assess the different habitats and evaluate whether there are any significant alterations in the ecosystem since the last baseline survey was carried out. Some of the species identified in this research included Speciecarpophyllum maschalocarpum, carpophyllum plumosum, cystophora torulosa melanthalia abscissa, pterocladia lucida and xiphophora chondrophylla. The analysis from the results shows that there was a minor change in the co-efficient uptakes for both ammonium and nitrite. In some cases, the recent data collected was rather high on both uptakes. This is a vivid indication that the habitat ecosystem may have been altered with time. The most ferocious agent in these alterations is man with his associated activities that impact on the environment (Davies et al. 2001). Furthermore, the dynamic wave action of the sea might have also played a key role in this deviation. Finally, other animals which co-exist with these species may have impacted negatively on this habitat through such activities like grazing (Hiscock 2001).
Acknowledgements
I would to express my sincere and heartfelt gratitude to my fellow group members and class mates for their valuable support and enduring effort in the course of these practical studies. I wish you all the best of success in your academic endeavors.
References
Davies J., Baxter J, Bradley M, Connor D, Khan J, Murray E, Sanderson W, Turnbull C., Vincent M. (2001). Marine Monitoring Handbook, Joint Nature Conservation Committee, UK. Web.
Cumming, A. (1980). Cape Rodney to Okakari Point Marine Reserve survey 2. Rocky shores. Leigh Marine Laboratory. The University of Auckland, New Zealand. Web.
Hiscock, K. (2001). Procedural Guideline No. 3-2. In situ survey of intertidal biotopes using abundance scales and checklists at exact locations (ACE surveys). In: Davies J., Baxter J, Bradley M, Connor D, Khan J, Murray E, Sanderson W, Turnbull C., Vincent M. 2001. Marine Monitoring Handbook, Joint Nature Conservation Committee, UK. Web.