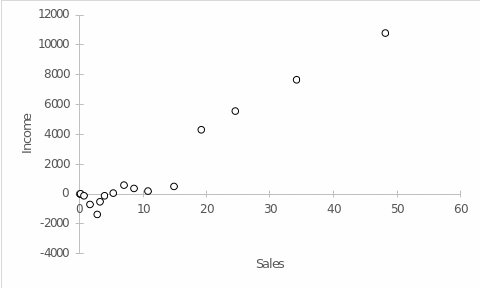
Regression analysis is an essential task for business intelligence in order to predict the future development of a company’s operational performance based on the data already available. For this analysis, we used data from two variables, namely sales and income. Sales should be understood as the total amount of goods sold, measured in hundreds of thousands or millions of dollars, depending on the company’s turnover. Income, in turn, is a measure of the amount of money received during the reporting period. Income could be negative with positive sales if the company suffered significant losses on other expense items. To flesh out the analysis, this paper uses sales and income variables for Amazon from 1995 to 2011. Figure 1 shows the scatter plot as a relationship between the company’s income and the number of sales. At first glance, it can be seen that starting from some position, the increase in income with increased sales was almost linear, but there is a high variance at the initial positions.

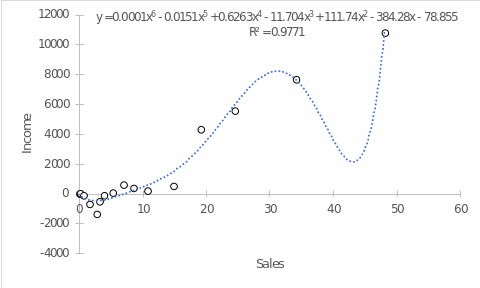
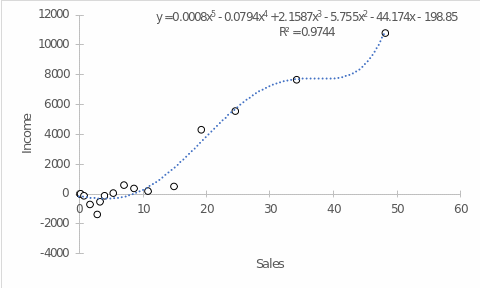
Regression analysis was applied to the current data set using a polynomial function. An indicator of the reliability of the polynomial trend was the coefficient of determination R2 – the higher it is, the greater the variance of the data from the set can be covered by the constructed model. Thus, the expectedly highest coefficient of determination (R2 =.9771) was characteristic of the sixth-order polynomial trend. In this case, the multiple regression equation was determined according to Fig. 2. Notably, using the sixth-degree polynomial in the trend function creates a dip in the region of about 35 to 43 sales units, which may imply that Amazon’s income is projected to be negative in this sales range. This may seem counterintuitive, so it is additionally recommended to consider a fifth-order polynomial regression where the coefficient of determination is not very different from Figure 2, but no serious dip in income is created (Figure 3).

