The data in the table allows for concluding that the drug typically leads to an increased number of offspring a mother mouse has.
The conclusion above can be figured out by comparing the litters of drug and control groups based on their arithmetical values. For this, it is necessary to sum up the babies in the litter and divide the obtained number by the number of the litters. On average, an ordinary mouse has five babies in the offspring, while the quantity increases to 6.9 babies when the drug is used.
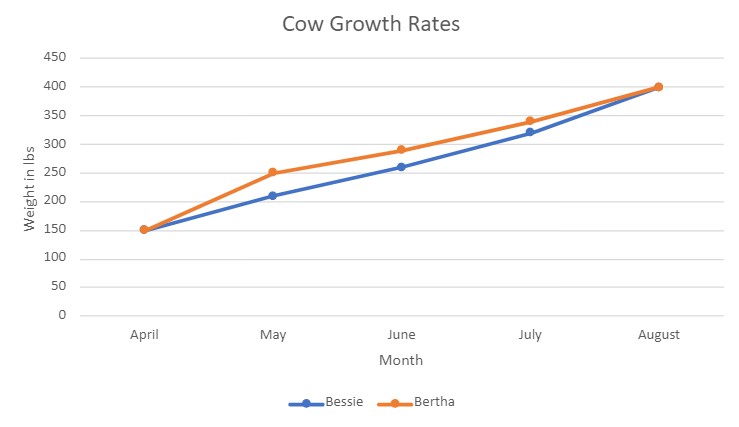
Cow Growth Rates

The graph on Excel reveals that the experimental feed slowed Bessie’s weight gain.
The conclusion above is justified because Bessie gained 40 lbs. fewer than Bertha the next month of using the experimental feed. It is important that the experiment used twin cows because this condition minimized the chances that any external factors contributed to the different weight gain results.
According to the graph, Forks grew the fastest because it had the most dramatic increase in population.
Cloverfield is the only town in the graph that declined in population.
Mystic had the slightest change in population because it only increased by less than 200 individuals.
The graph reveals that the population of Forks is 3,800 people in 2010.
According to the pie chart, the Insects group has the most number of species, which is 50%.
All invertebrates account for 75% because insects are also included in this group. As for vertebrates, the pie chart makes it challenging to state their exact percentage, but it is possible to assume that they constitute approximately 5%.