- Abstract
- Introduction
- Ratio Analysis of the Company for 4 Years and Discussion on Key Points
- Where the Company Is Not Performing Better and Areas for Improvement
- Comparative Analysis of the Financial Statement Using Common Size Tools
- Graphs of the Important Items
- DuPont System Analysis, Company’s Strengths, and Rooms for Improvement
- Conclusion
- Reference List
Abstract
The purpose of this paper is to analyze the financial ratios of Nestlé Group; therefore, it focuses on ratio calculations of the company for 4 years, and discusses on the key points. To assess the liquidity position, the paper first determines the current ratio and quick ratio, whereas its safety or vulnerability to risk is assessed through the debt to equity ratio, the cash flow to current maturity of long-term debt, and times interest earned.
Subsequently, the profitability conditions are analyzed through consideration of the net profit margin, return on investment, and return on assets, whilst the operational efficiency is determined by evaluation of accounts receivable turnover, accounts receivable collection period, etc. The paper also reviews Nestlé’s debt management capacity, and identifies the areas where the company is not performing well and areas for improvement, together with a comparative analysis of financial statements and DuPont system analysis.
Introduction
Nestlé is a Switzerland-based global giant in the food-processing industry having presence in over 191 countries; consequently, this paper attempts to analyze the key ratios of the company to get a better understanding of its strengths and weaknesses.
Ratio Analysis of the Company for 4 Years and Discussion on Key Points
Liquidity Ratios
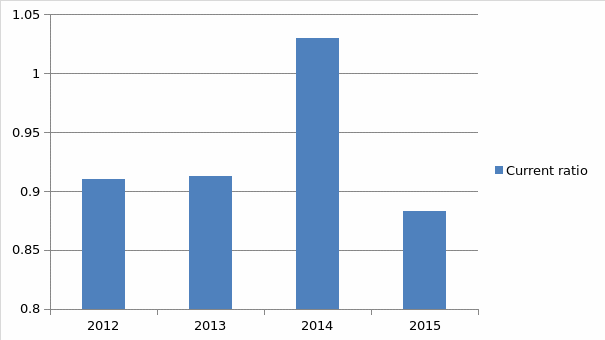
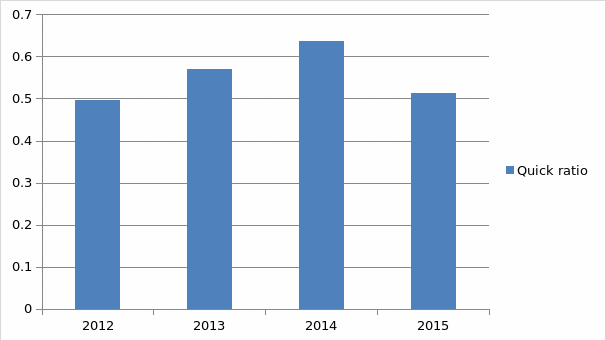
According to Nestlé Group (2012), the company’s current ratio has always remained less than one; later, from 2012 to 2015, it has declined further, indicating that the liabilities are increasing in comparison to assets; in addition, the quick ratio has also diminished in 2015, suggesting that the liquidity position of the company is not attractive:
Current ratio
Quick ratio
Safety
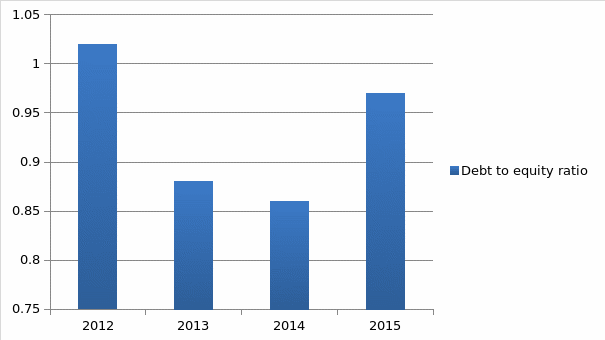
The debt to equity ratio has increased from 2012 to 2015, and the cash flow to current maturity of long-term debt has declined in 2015, as compared to 2014 (Nestlé Group, 2014); this shows that Nestlé is becoming more vulnerable to risk; however, the ‘times interest earned’ has improved slightly:
Times interest earned
Debt to equity ratio
Cash flow to current maturity of long-term debt
Profitability
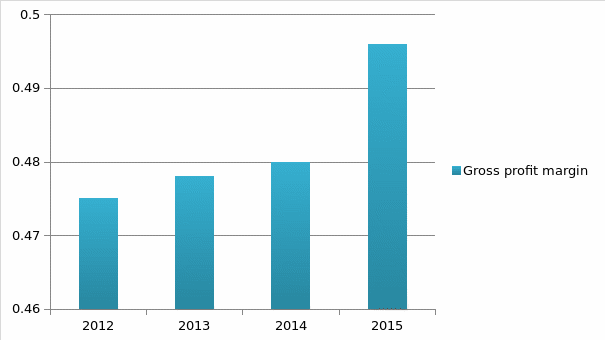
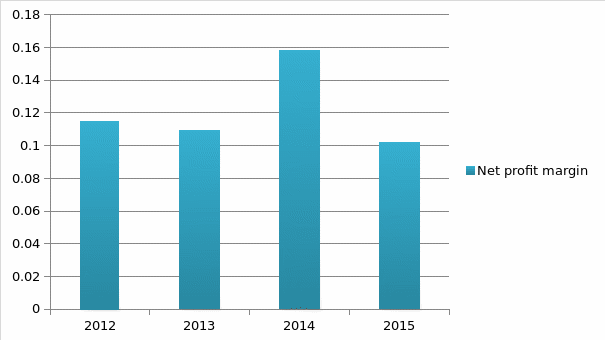
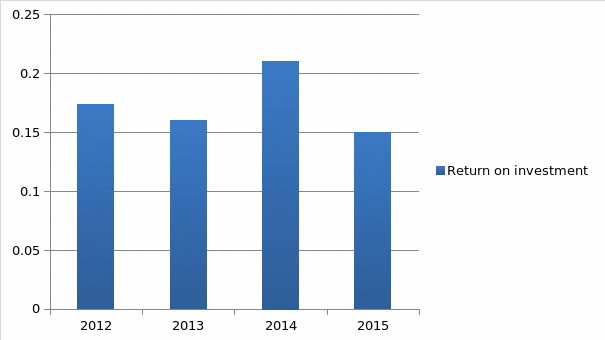
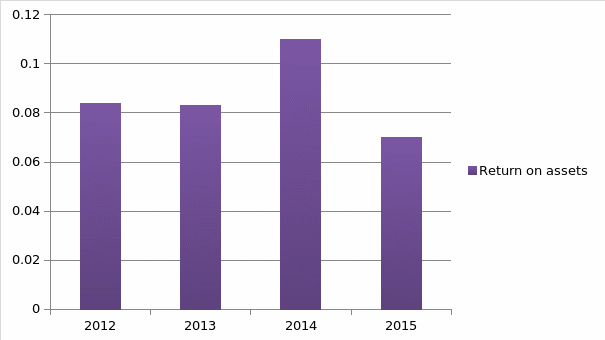
The profitability ratios of the company have fluctuated over the four years (Nestlé Group, 2015); however, the net profit margin has lowered, as well as the return on investment and return on assets:
Gross profit margin
Net profit margin
Return on investment (ROI)
Return on assets (ROA)
Operational Efficiency
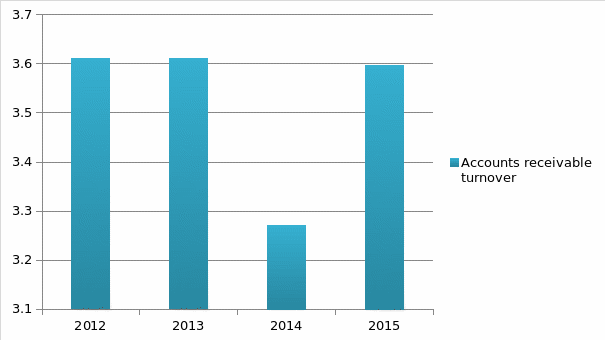
The operational efficiency of the company has remained quite stable over the period, whilst the accounts receivable turnover and accounts receivable collection period improved slightly in 2015 – however, the inventory turnover remained the highest in 2013 (Nestlé Group, 2013):
Accounts receivable turnover
Accounts receivable collection period
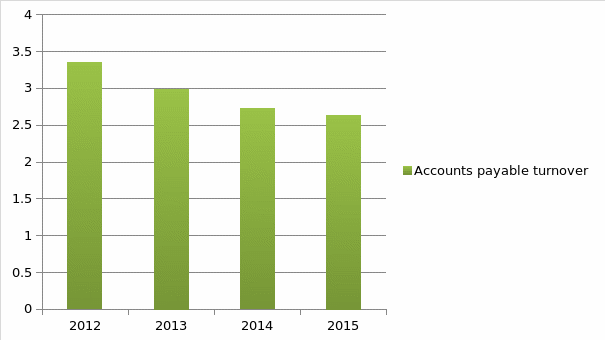
Accounts payable turnover
Inventory turnover
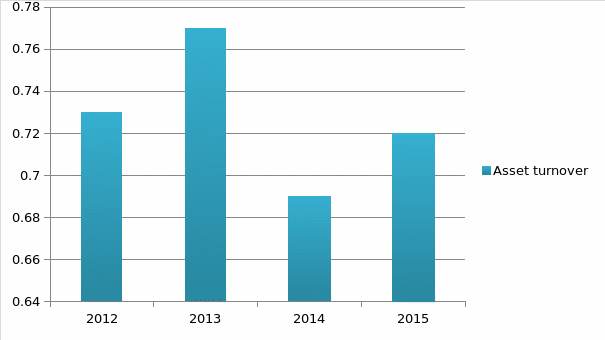
Asset turnover
Debt Management
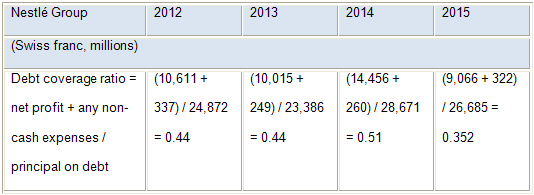
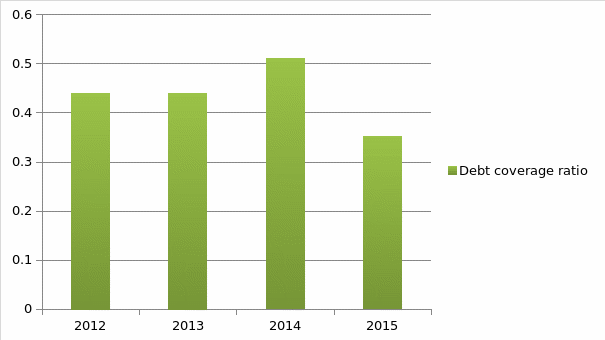
The company’s debt coverage capacity persistently remained less than one, and then lowered significantly in 2015 indicating poor debt management:
Debt coverage ratio
Where the Company Is Not Performing Better and Areas for Improvement
The company is not performing well in liquidity, safety, profitability, and debt management ratios; consequently, a number of areas need improvement, such as current ratio, debt to equity ratio, gross profit margin, return on investment, return on assets, and debt coverage ratio.
Comparative Analysis of the Financial Statement Using Common Size Tools
According to National Council of Educational Research & Training (2015), comparative and common size statements are frequently used to conduct financial analysis of firms. The income statements show that the net profit margin of Nestlé has dropped from 0,115 in 2012 to 0,109 in 2013 and from 0,158 in 2014 to 0,102 in 2015. Balance sheets show that compared to previous year, the current ratio has dropped by 14, 3% in 2015, which denotes another major weakness.
Graphs of the Important Items
The graphs of the most important items for 4 years are appended below for the ease of managerial decision-making:
DuPont System Analysis, Company’s Strengths, and Rooms for Improvement
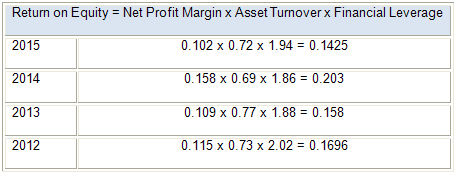
DuPont analysis is crucial to assess a company’s strengths (Lan, 2012), and Nestlé’s return on equity was the lowest in 2015. Although its net profit margin was a little stronger in 2015 than in 2014, it should improve its asset turnover and financial-leverage:
Conclusion
The key advices for the company should be to develop its liquidity position by lowering the overhead expenses; moreover, it should also consider relocating the funds to interest-bearing accounts, eradicating unproductive assets, and examining ‘accounts receivables’ efficiently to ascertain timely payments.
There are certain areas the management of the company should improve immediately; these includes augmentation of the ‘debt to equity’ position to reduce its vulnerability to risk, enhancement of the overall profitability of the business, and the lessening of the production costs.
On the other hand, the operational efficiency of the business is quite stable, and Nestlé should try to maintain this over the longer period by concentrating on the inventory turnover, for example.
The management must proactively participate in decision-making process to improve the company’s financial health by formulating succession planning, creating cash reserves, ensuring secured financing, and building smart objectives.
Reference List
Lan, Z. (2012). Breaking down ROE using the DuPont formula. Web.
National Council of Educational Research & Training. (2015). Analysis of financial statements. Web.
Nestlé Group. (2012). Consolidated financial statements of the Nestlé Group 2012. Web.
Nestlé Group. (2013). Consolidated financial statements of the Nestlé Group 2013. Web.
Nestlé Group. (2014). Financial statements 2014. Web.
Nestlé Group. (2015). Financial statements 2015. Web.