Introduction
Aveva Group is an information technology company based in the United Kingdom (UK). The organisation developed from a 1967 government initiative to start a computer-aided centre in Cambridge. Since its inception, the Cambridge-based firm has grown from having a local presence in the UK to enjoy a global appeal in more than 37 countries around the world. These markets host more than 55 business locations where the company has offices (AVEVA 2017). Its regional headquarters are in Houston – Texas (for the Americas market), Kuala Lumpur-Malaysia (for the Asia-Pacific markets) and Sulzbach – Germany (for Europe, Middle East and African markets) (AVEVA 2017).
Aveva Group provides information technology (IT) services to different types of clients around the world (AVEVA 2017). Some of the key services provided by the holding company include engineering design, software development and IT consultancy services (Bloomberg 2017). Other services include information management, product support and human resource training (AVEVA 2017). The company offers these services under three product categories: enterprise solutions, marine solutions, and plant solutions (Annual Reports 2017). Aveva’s services are aimed at giving its clients the chance to innovate, visualise and manage their assets through the deployment of digital management tools. Its services are beneficial to its clients because they allow them to lower their total ownership costs in the management of corporate assets and boost revenues as a result. Today, Aveva Group is listed on the London Stock exchange and is a constituent of the FTSE 250 Index.
This paper is a report on the financial performance of the UK Company within the last five years – 2013, 2014, 2015, 2016, and 2017. This report is divided into two parts. The first one will review the company’s profitability, liquidity, key performance indicators (KPI), net asset value, share price performance, investment returns and risk management processes. The second part contains a review of the firm’s corporate governance compliance standards and outlines a roadmap for becoming a FTSE 100 organisation. The first part of the report appears below.
Profitability
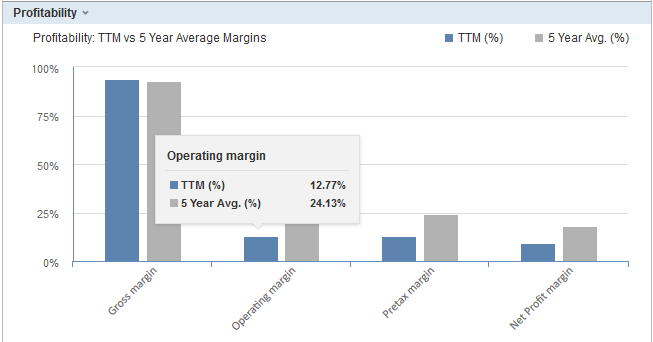
According to AJ Bell Holdings Limited (2017), Aveva Group makes about £29.4 million in operating income (annually) and £20.5 million in net income in the same duration. Table 1 below shows a review of the company’s profitability within the last five years.

According to the graph above, the current operating profit margin for Aveva Group seems to be lower than its 5-year average, considering the latter is 24.13%, while the current estimate is 12.77% (FML 2017). In 2017, the IT company ended the year with a strong financial performance buoyed by a return to growth in revenue. Within the past five years, the firm has enjoyed a significant increase in its cash flow. However, this index has been largely moderated by the net profit margin, which has remained relatively unchanged within the period in assessment.
In 2013, 2014, 2015, 2016, and 2017, the company reported a net margin of 20.67%, 21.49%, 19.91%, 10.16%, and 17.64% respectively (FML 2017). Granted, the last three years have shown a relatively marginal decline in net margins, but considering the highest percentage was 21.49% (reported in 2014), the 2017 net margin only shows a small decline in this index. The moderate performance in profitability is also demonstrated in a review of the company’s asset turnover numbers because, in 2013, 2014, 2015, 2016, and 2017, it reported figures of 0.66, 0.75, 0.73, 0.68, and 0.70 respectively (AJ Bell Holdings Limited 2017). These figures show that the firm has been operating efficiently and this is why it has generated enough revenues through the deployment and redeployment of its assets. The asset turnover ratios highlighted above are all less than “1.” This is common for IT-based and telecommunication companies because they often have large asset bases (FML 2017). Therefore, they commonly take a long time to convert their assets into revenue.
Liquidity
A review of Aveva’s liquidity position is hinged on an analysis of its quick ratio, current ratio, and financial leverage numbers. A focus on the quick ratio alone (within the stipulated period under review) shows that the organisation has enjoyed sufficient liquidity to pay off its short-term debts (Collier 2015). In 2013, 2014, 2015, 2016, and 2017, the company reported quick ratios of 3.16, 2.39, 2.19, 2.27, and 2.40 respectively (Reuters 2017). The general rule of thumb in the analysis of these figures reveals that companies, which have quick ratios of more than “1”, are in good financial health. The same ratios also imply that Aveva Group does not rely on its assets to meet short-term financial obligations. Instead, it relies on its revenues to do the same. However, Collier (2015) cautions people from giving such companies a “clean bill of health” because a high quick ratio could mean that the company lacks innovation in the use of excess cash.
A review of the company’s current ratio also shows that it enjoys a good liquidity position because, in the years 2013, 2014, 2015, 2016, and 2017, the organisation reported ratios of 3.25, 2.48, 2.31, 2.40, and 2.54 respectively (MSN Worldwide 2017). Possibly, we could assume that the company can effectively pay off its long-term liabilities without having to sell its assets because, throughout the five years under analysis, it has not reported ratios of less than “1.” An analysis of the company’s financial leverage ratio also shows that the Cambridge-based organisation has a strong liquidity position. In the years 2013, 2014, 2015, 2016, and 2017, it reported figures of 1.41, 1.50, 1.54, 1.47, and 1.44 respectively (MSN Worldwide 2017). Since all the numbers are higher than 1.1, it is safe to assume that Aveva Group does not need to take loans to finance its short-term and long-term operations. At the same time, the same ratios show that the company does not need to sell its assets to pay off its debts. Generally, the financial leverage ratios highlighted above contribute to the company’s strong liquidity position.
KPIs
Aveva’s KPIs indicate the strength of its financial performance. They include revenue, adjusted profit before tax, cash conversion rate, employee numbers (a measure of how the business is changing), owner-operator revenue (a key strategic and market growth objective), and adjusted basic earnings per share (EPS). A review of the cash conversion rates within the last five years shows an average of 122%, which means that the company has a strong cash collection potential (AVEVA 2017). A review of the average adjusted EPS within the same period shows a figure of 67.0P, meaning that the company has enjoyed high profitability during the years reviewed (AVEVA 2017). This figure was derived after adjusting for specific non-cash and exceptional items. An assessment of the adjusted profit before tax margin within the same period shows an average percentage of 25.5% (Annual Reports 2017). This percentage shows that Aveva has remained highly profitable in the last five years. An average of the profit before tax during the same period was £55.0 million (because of increased revenues).
Net Asset Value (NAV)
A comprehensive overview of Aveva’s net asset value within the five years under analysis shows that it has remained relatively stable. Calculations of the average net asset value during the period mentioned above appear below.
(252 + 185 + 190 + 201 + 221)/5 = 209.8
(NB: the above figures are in £ million)
An average net asset value of £209.8 million deduced from the company’s annual statements throughout the period in review shows that Aveva Group has a high capital base, relative to its peers because the average NAV within the industry is £150 million (MSN Worldwide 2017). This ratio could mean the company has succeeded on the platform of good management skills directed at value creation because, since 2014, its asset value has been steadily increasing. However, an important link that could be made in this analysis is the correlation between the increased NAV and the number of acquisitions within the stated period. Notably, Aveva’s NAV has surged because of an increase in the number of acquisitions. It is possible to deduce this relationship because “acquisition” is a key part of the firm’s strategic focus.
Within the last decade, the company has participated in more than a dozen acquisitions. For example, in 2004, it acquired Tribon Solutions, in 2005, it acquired Realitywave Inc, while in 2009, it announced the acquisition of iDesignOffice Pty Ltd. Similar acquisitions have been made in 2010, 2011, 2012, and 2015 (Newenham 2015). Since the period when these acquisitions were made coincide with an increase in the NAV of the company, we could deduce that the acquisitions are largely responsible for the increase in NAV within the period in review.
Share Price
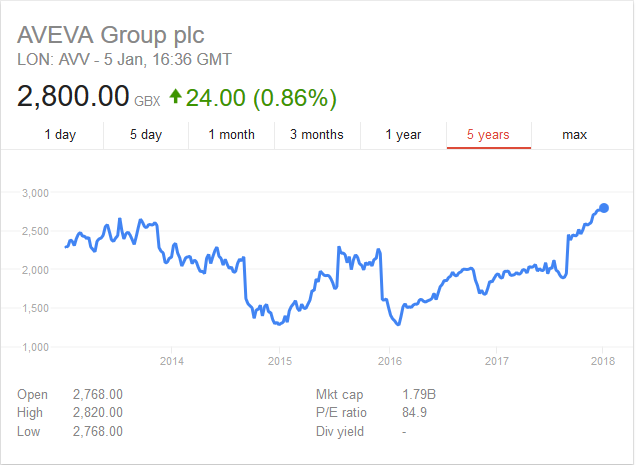
According to Figure 2 below, Aveva’s share price has remained relatively stable within the last five years.

The company has also issued dividends within the last three years because in 2015, 2016, and 2017, paid 34.44, 36.67, and 43 for every share owned (MSN Worldwide 2017). The stable share price is largely attributed to the company’s strong management policies and vigilance in business operations.
Investment Returns
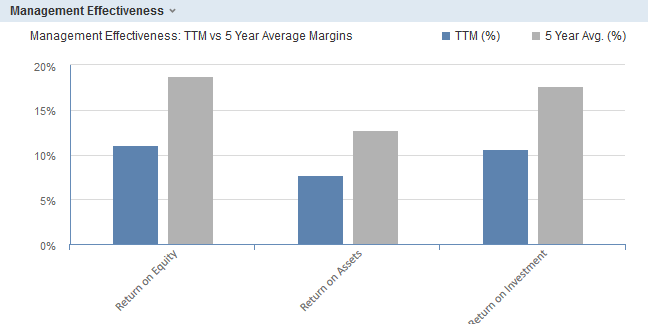
An analysis of the returns that investors get from Aveva Group is best explained through a review of the company’s management effectiveness. Figure 3 below shows a graphical representation of key ratios indicating the firm’s investment returns.

As shown in the graph above, a review of Aveva’s investment returns is undertaken through an analysis of three key ratios: return on assets, return on investments and return on equity. Two of these ratios show that investors are getting good returns, relative to industry performance. For example, an assessment of the returns on assets (ROA) supports this view because the company’s five-year average is 12.79%, while the industry’s average is 8.83% (FML 2017). An examination of the company’s return on investment ratio also supports the same narrative because the 5-year average for return on investments (ROI) is 17.67% (for the company), while the industry has posted an average ROI of 12.91% (Macro Axis 2017). The positive news for investors is partly dampened by a poor performance of the company’s return on equity within the past five years. According to the Woods (2017), Aveva Group reported a figure of 18.74%, while the industry reported an average estimate of 84.51% within the same period. This finding shows that Aveva Group yields fewer returns for its investors compared to what other firms in the industry are giving. Considering the ROE is the only poorly performing financial ratio for the analysis of Aveva’s investment returns, safely, we could assume that the organisation has a moderate investment return.
Risk
Aveva’s Board of Directors has the ultimate responsibility of making sure the company’s internal controls for risk management work (AVEVA 2017). However, it is pertinent to understand that these internal controls are not aimed at eliminating risks, but rather to minimise them. From this understanding, the internal controls can only provide reasonable assurances against material misstatements and financial losses, but not an absolute prevention of the same risks. The monitoring processes undertaken by the Board of Directors covers all material controls involved in financial processing (the controls are both for financial and non-financial risks). Operational and compliance controls are also instituted in the same way. The process is mainly based on a review of management reports to find out whether any risks are identifiable.
A review of the company’s annual reports throughout the five years under assessment (2013, 2014, 2015, 2016 and 2017) showed that no significant control failures were reported (Annual Reports 2017). A consistent examination of the company’s internal control processes by the Board of Directors also reveals that within the period in assessment, the company’s risk management systems have complied with the provisions of the Financial Reporting Council (AVEVA 2017). The same guidelines cover internal control processes associated with financial and business reporting.
Corporate Governance
The corporate governance framework of Aveva Group aligns with the principles set out in the UK Corporate Governance Code. Woods (2017) supports this statement by saying that Aveva Group has strong corporate governance principles that comply with the UK rules on the same. For example, the company observes a strict independence of executive and non-executive board members and it makes sure the Board of Directors review all aspects of the business’s operations, as is expected of them in their job descriptions (AVEVA 2017). The board is comprised of the chairperson and three non-executive members. It also has two executive directors who are independent of the non-executive members (AVEVA 2017). As mentioned above, the independence of the executive and non-executive members is a key hallmark of the company’s compliance standards because the UK Financial Reporting Council demands that both sets of directors should be independent.
Regarding the relationship between companies and their shareholders, as outlined in the fifth section of the Corporate Governance Code, the managers of Aveva Group annually have a dialogue with their shareholders to discuss key management issues. Particularly, the Chief Executive Officer (CEO), the Chief Financial Officer (CFO), and the Head of Investor Relations have given priority to the need to communicate with shareholders about the operations of the company with the goal of making sure the shareholder input adds to their corporate strategies (AVEVA 2017). Throughout the five years under review, these officers have also held analyst briefings with the same shareholders at least twice a year.
Regarding accountability, which is highlighted in the third section of the Corporate Governance Code, it is pertinent to point out that in 2013, 2014, 2015, 2016, and 2017 Aveva Group has published fair, balanced, and understandable reviews of the company’s financial positions in its annual publications (Annual Reports 2017). The reports are also freely available to the public, relative to the stipulations governing the financial reporting standards of publicly listed companies. Generally, the steps taken by managers and directors of Aveva Group to comply with the provisions set out in the UK Corporate Governance Code have had a positive impact on the company’s reputation and image. Evidence of this fact emerges in the positive share price increase, which has occurred in the period under analysis. Different analysts, such as Woods (2017) and Newenham (2015), support the same view.
Medium-term Financial Strategies to become a FTSE 100 Company
Lastly, Aveva Group should expand its market outreach beyond its traditional European operations. Particularly, it needs to shift its business strategy towards the provision of essential IT services in emerging markets such as Asia, Middle East and Africa. These markets are critical to the company’s growth because they provide new opportunities for industry development, especially in the marine and energy sectors, which Aveva specialises in. Support for this view is visible in the nature of many FTSE 100 companies, which have a broader market outreach than what Aveva Group boasts of today (London Stock Exchange PLC 2017).
Reference List
AJ Bell Holdings Limited 2017, AVEVA Group PLC AVV. Web.
Annual Reports 2017, Aveva Group PLC. Web.
AVEVA 2017, Corporate governance. Web.
Bloomberg 2017, Company overview of AVEVA Group PLC. Web.
Collier, P 2015, Accounting for managers: interpreting accounting information for decision-making, 5th edn, John Wiley & Sons, New York, NY.
FML 2017, Aveva Group (AVV). Web.
London Stock Exchange PLC 2017, FTSE 100. Web.
Macro Axis 2017, AVEVA Group (UK) financial ratios. Web.
MSN Worldwide 2017, AVEVA Group PLC. Web.
Newenham, P 2015, ‘Aveva acquires Derry software firm 8over8 for £26.9m’, Irish Times. Web.
Reuters 2017, AVEVA Group PLC (AVV.L). Web.
Woods, J 2017, ‘AVEVA Group PLC’, Financial Times. Web.