Introduction
- This presentation aims to:
- Assess the current and prospective performance;
- Present a road map for significant activities;
- Discuss revenue, net assets, and sales;
- Elaborate on quality, dependability, and costs;
- Offer changes to the current strategy.
The bike manufacturing industry in the UK is a highly competitive business. It is evident that the changes introduce here will affect the market, and thus this strategy assesses the environment of the current bike manufacturing industry and consumer preferences to develop an appropriate plan. In order to remain competitive, the efficiency of Road Bike’s construction, as well as production costs, should be altered. This presentation aims to provide performance objectives relevant to Road Bike, describe the process map, and compare set targets for the five-year performance to the actual outcomes.
Performance Objectives
- Quality – the perception of the product
- Dependability – timely delivery
- Cost – the value of production
- Flexibility –ability to alter manufacturing
- Speed – the time of bike delivery (Heizer et al., 2017)
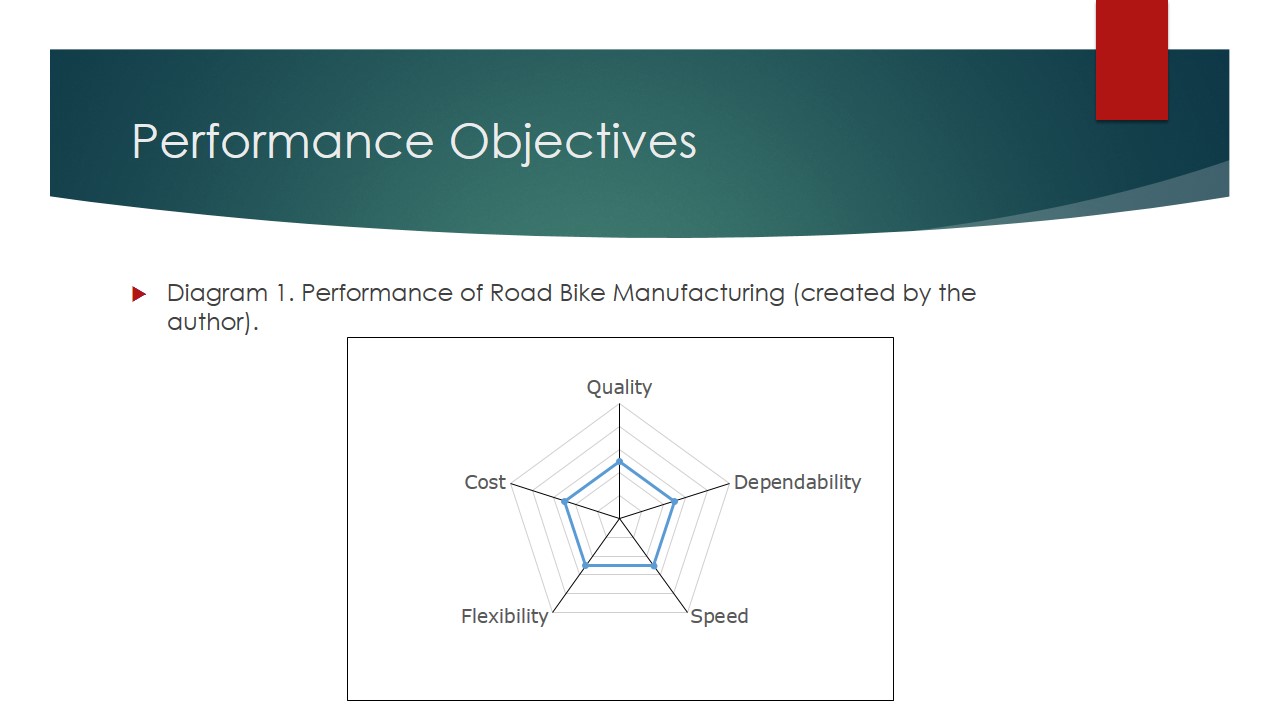
Diagram 1 presents an evaluation of the primary performance indicators that the management of Road Bike uses to evaluate the efficiency of operations in each of the five domains in the initial stage. The maximum value for each element of this polar diagram is 100, and all components are estimated at 50. This provides an understanding of the growth possibilities that can be explored by Road Bike within the next five years. Quality is critical for Road Bike because it reflects both the expectation of customers in the road-commuting segment and the performance of Road Bike. Flexibility is especially vital in the current environment since according to Childers (2018) the competitors work on developing new bike designs. Speed indicates the time it takes to manufacture and deliver a product after a client places an order, which correlates with dependability that accounts for reliable delivery of goods.
Finally, a critical element of evaluation is cost because it is the primary objective of the operation’s management. It is evident that while in general Road Bike has sufficient performance in the initial year although several changes need to be made to archive success in years 4 and 5. Firstly, the research and development unit should focus on developing bikes that target a specific segment of potential customers – commuting, racing, leisure, fitness, or touring and introduce new products due to increasing competition (UK bike makers: a community riding high 2017). One issue here is that the strategies developed for this department can be updated only once each quarter. Thus, an analysis of future consumer demand is necessary.
Process Map
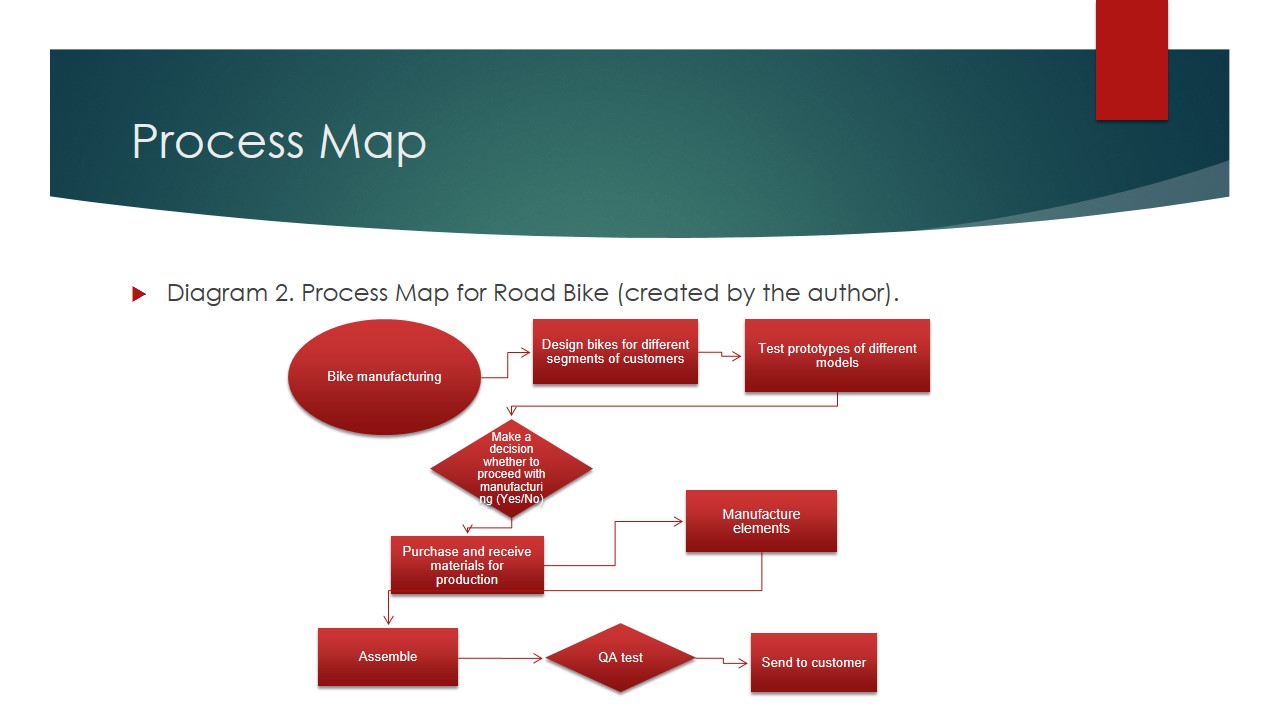
The impact on operations during year 4 and five is facilitated through the development of new products and testing of designs. Next, the approved prototypes can be sent for assembler, tested for quality and sold to customers. The purpose of the process map is in outlining the vital elements of operational management that should be considered when planning for future development. The process map displayed above emphasises the importance of research and development for Road Bike since initially all activities begin with developing new models of product, which is crucial for year five because the competitors start to introduce new products to the market (SlimVenture n.d.). Thus, the use of the process map for the improvement of Road Bike is in the ability to point out elements of manufacturing that can be improved for enhanced efficiency.
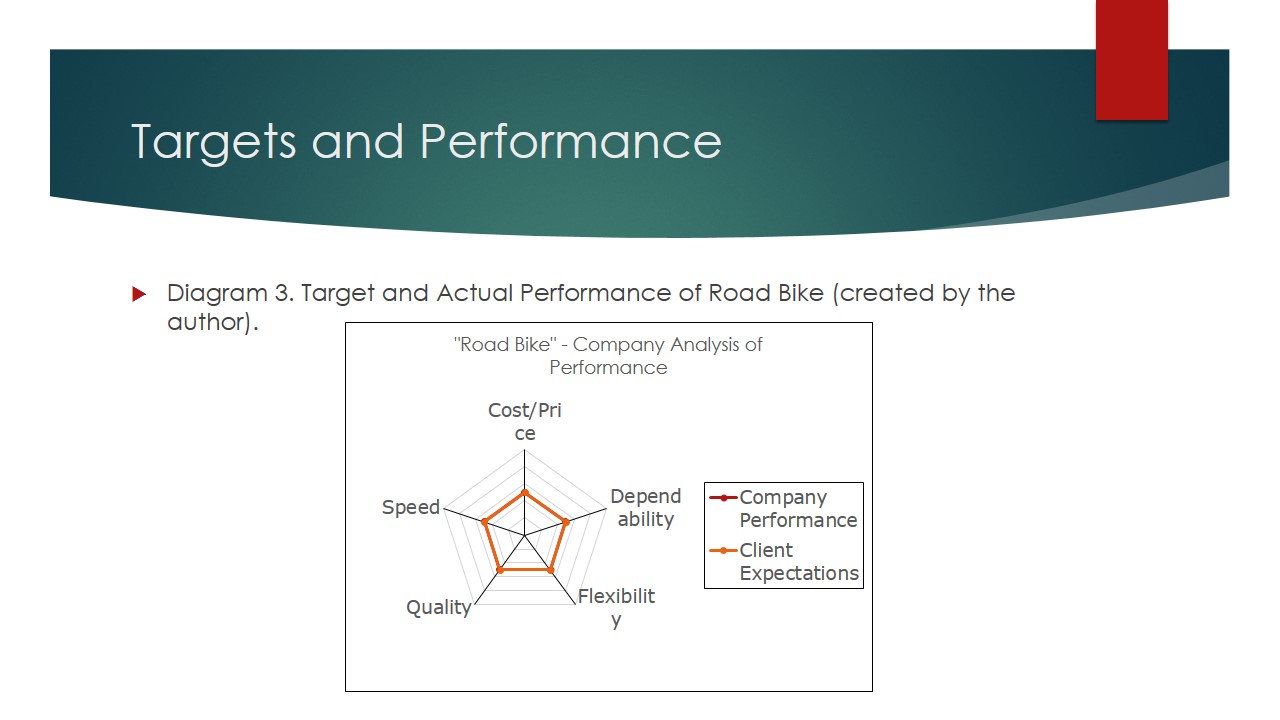
This section assesses the actual performance of Road Bike Manufacturing and compares it to the targets set by the company’s owners. Diagram 3 demonstrates this evaluation and represents an excellent performance of the company because it met all the anticipated goals. In general, the market in which Road Bike operates has approximately 2000 potential clients. The potential revenue from this segment is estimated at £2.5 million a year. According to data collected from Slim venture, the current profit indicators provide an understanding of the stability within the company’s operations.
Targets and Performance
- PDSA for costs:
- Plan – evaluate current spending;
- Do – negotiate with suppliers;
- Study – assess the new costs;
- Act – implement the change.
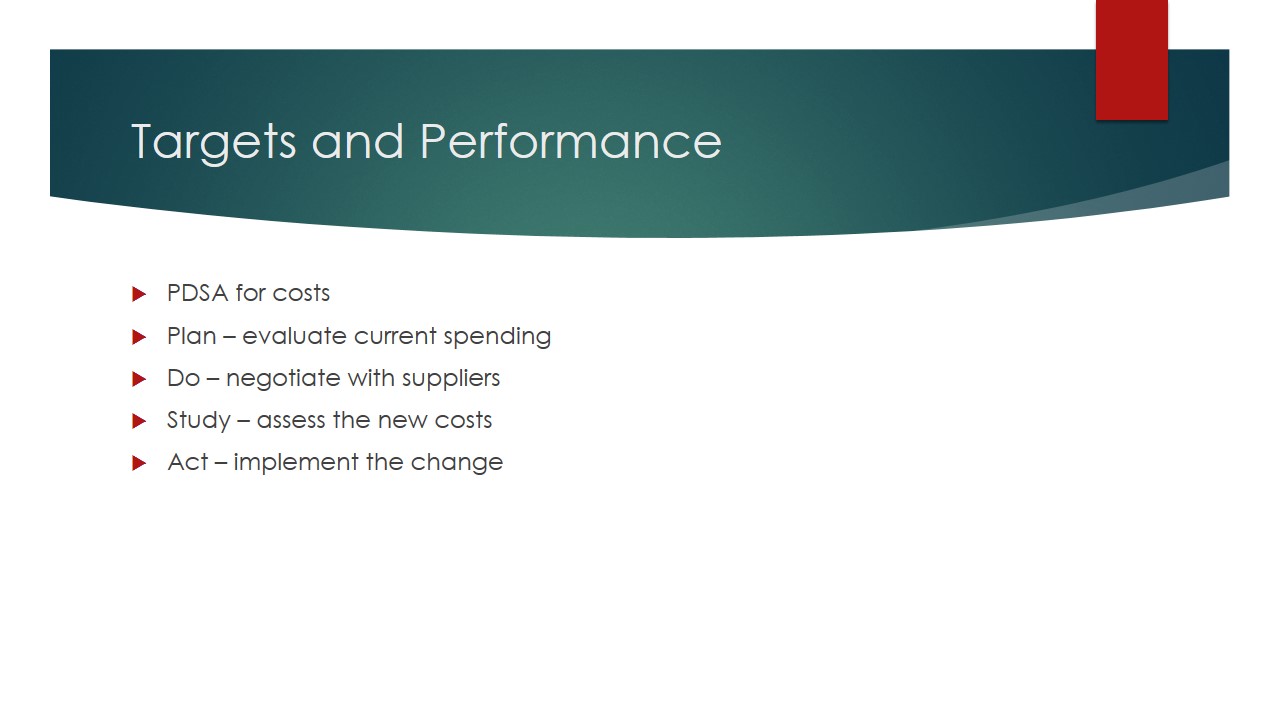
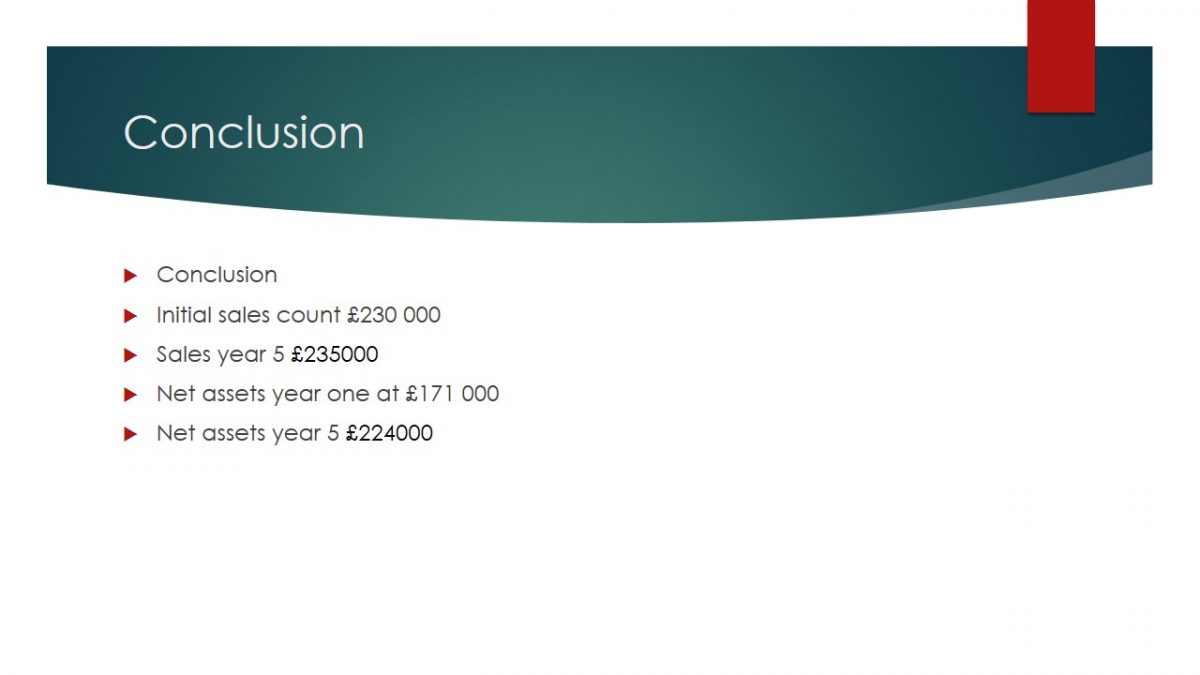
For an adequate evaluation, the financial indicators should be assessed. In the beginning, sales count was estimated at £230 000 (SlimVenture n.d.). Net assets were evaluated at £171 000 while in year five they account for £235000 and sales count is £224000. Thus, net assets did not meet the anticipated target of £300,000. This provides an understanding of the company growth and indicates that Road Bike operates efficiently. The PDSA cycle for the cost element was successful. Thus the improvement process consisted of evaluating the current costs of manufacturing bikes. The lowering of costs allows Road Bike to enhance its financial performance. However, the quality and delivery time should remain unchanged. The next stage involves evaluating the proposed model and implementing it if it is viable. An essential element of the five-year development plan is the competition, which remained unchanged until year 5.
- Reducing costs by increasing volume;
- Increasing sales volume through distribution;
- Increasing revenues;
- Improving efficiency;
- Amending the product offering through material and design alteration.
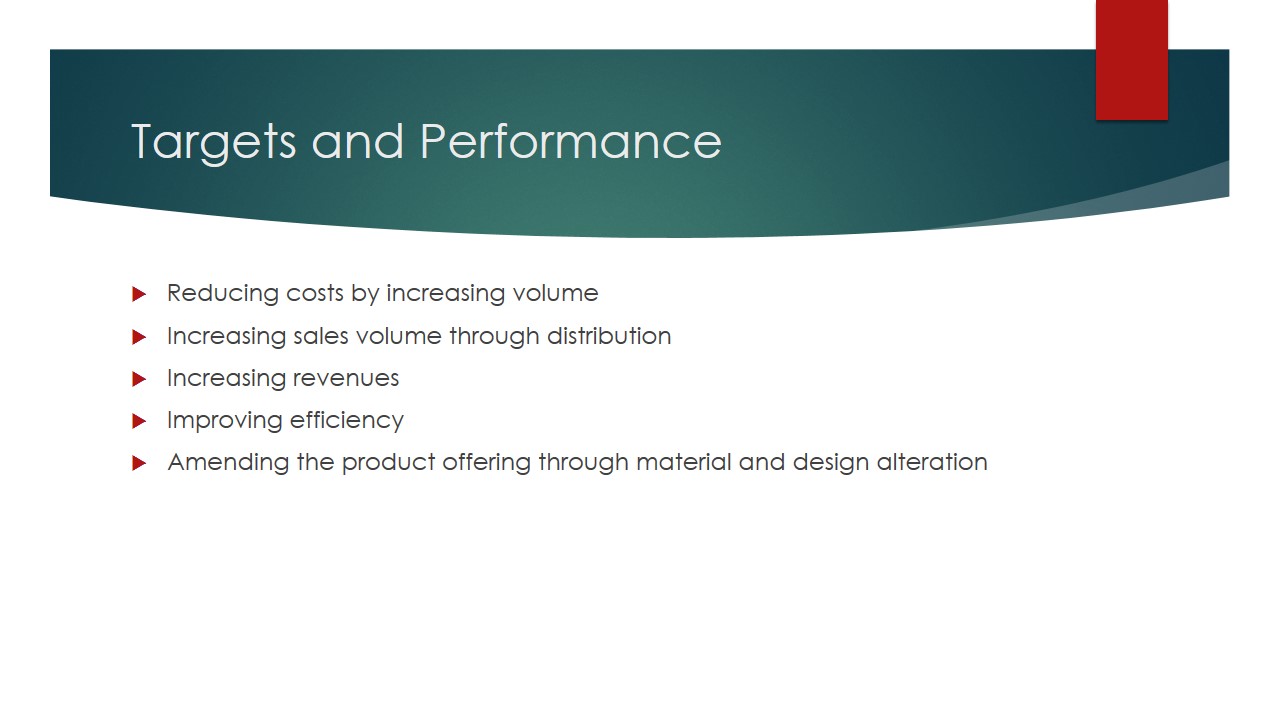
By looking at the competitors, Road Bike will be able to assess the necessary changes in its performance. Childers (2017) reports that new strategies of bike manufacturing were developed by a US startup, which uses 3D printers to manufacture bikes. This allows the company to cut costs significantly without impairing the quality of their product. Long (2017) states that the most commonly applied approach to lowering the costs of manufacturing is increasing the production volume. However, Road Bike may not have the financial and physical capability to enact this strategy and thus, altering the design and re-negotiating with suppliers is a viable strategy for reducing spending in this domain. By changing the materials and the structure of elements that Road Bike uses in its products the company will be able to improve its efficiency.
Conclusion
- Initial sales count £230 000.
- Sales year 5 £235000.
- Net assets year one at £171 000.
- Net assets year 5 £224000.
Overall, this presentation demonstrates that both the current and anticipated performance of Road Bike is meeting the set targets. The revenue and net assets altered over the years, indicating the growth of the company. Improvements in the processes are suggested in regards to the research and development unit to ensure that production costs are lowered. The developed process map helps to understand the elements of production that can be enhanced to reduce the costs of manufacturing and improve revenue. The PDSA model was described in this paper using the example of the cost element of operational management.
Reference List
- Childers, J 2018, Startup uses 3D printing for low-cost carbon fiber bike frames. Web.
- Heizer, J, Render, B, Munson, C, & Sachan, A 2017, Operations management: sustainability and supply chain management, Pearson Education, London.
- Long, L 2017, Three ways to lower your manufacturing costs. Web.
- SimVenture n.d. Web.
- UK bike makers: a community riding high. 2017. Web.