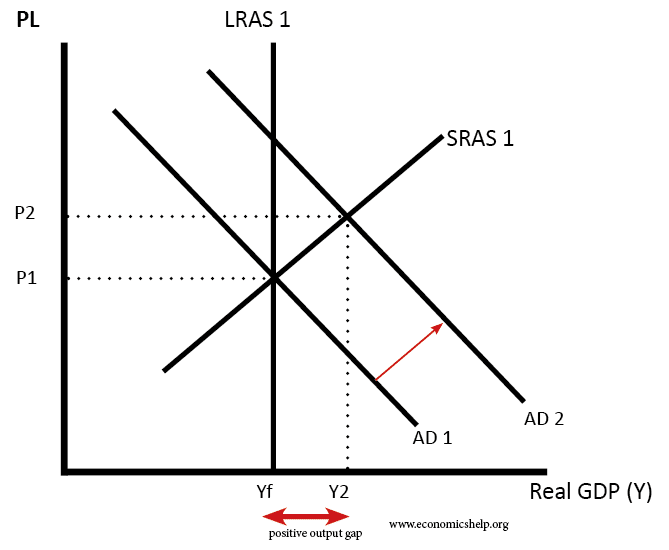
Output gap represents the difference of actual and potential GDP of an economy and is expressed in percentage. The output gap can be negative or positive, and it is significant in determining policies to use in an economy (Pettinger, 2021). A positive output gap depicts that the economy has a high demand for goods and services, benefiting an economy. However, this output gap can spur inflation because the labor and cost of goods increase to respond to demand rise.
Fiscal policy is the most suitable government policy during a positive output gap. It includes influencing aggregate demand through having changes in taxation and government spending. There are two types of fiscal policy that is contractionary and expansionary. Contractionary policy is used when there is inflation, that is, an economy that produces too much. At the same time, expansionary fiscal policy is employed when there is a recession in an economy. The government can reduce inflationary pressure through a tax increase and a reduction in spending by the government (Afonso, 2019). A fiscal policy expansion, for instance, increases aggregate demand in the following methods. The first is that an increase in purchases and keeping taxes constant helps directly increase demand. The second is that a rise in transfer payment or tax cuts results in a increase in disposable household income, increasing the consumption rate. The aggregate demand thus is increased by higher consumption in the economy.
In conclusion, policymakers have to be keen on selecting the right policy to stabilize the economy. Once the policy is decided, the appropriate tool, for instance, changes government spending or tax changes. Besides, it is essential to implement output gap closing with care and know the right stimulus to use as too much stimulus can result in another gap.
Reference
Afonso, A., Alves, J., & Balhote, R. (2019). Interactions between monetary and fiscal policies. Journal of Applied Economics, 22(1), 132-151.
Pettinger, T. (2021). Output Gap Definition – Economics Help. Economics Help.