NICE Technology Appraisal
- The technology:
- Botulinum toxin A used in the prophylaxis of adult chronic migraine.
- Chronic migraines:
- Refers to headaches that persist for more than two weeks in a month.
- Not responded to at least three prior prophylaxis interventions.
- The technology (Botox, Allergan) is priced at £276.40 for a 200 ml vial.
- Administration cost is £73 per treatment.
- Total treatment cost for 12 weeks estimated at £349.40.
This presentation outlines the economic model in the determination of the cost-effectiveness of a health technology based on NICE’s appraisal guidance. The appraisal of the technology, Botulinum toxin A, was issued in September 2012. Botulinum toxin A is extracted from a bacterium (C. Botulinum), which is prophylactic compound for headaches and migraines in adults. It has been approved in the UK as a preventive medication for chronic migraines in adult patients. Chronic migraines are defined as headaches experienced for at least fifteen days per month. The dose level is 155 ml administered intravenously twice a month.
The NICE appraisal evaluated whether botulinum toxin A is cost-effective and clinically effective for use by adult patients with persistent migraines, who have used more than three (medications) prophylactic therapies with no positive response. The manufacturer conducted a sensitivity and economic evaluation to respond to the decision problem raised by NICE.
The estimated cost of a 200 unit bottle of this medication (Botox) was £276.40, with £73 the estimated administration cost for each treatment. The total expected cost was estimated at £349.40 for treatment per patient over a 12-week cycle.

Markov Model
- No relevant literature existed on economic evaluations of the technology.
- The Markov Model was used; it was based on data from two trials.
- Compared the technology and placebo group over time.
- Only 35% of study population met the NICE criteria.
- Used 64% of trial subjects to achieve higher statistical power.
- The model defined six diseases (Markov) states:
- Based on the number of headaches experienced per month.
- Time proceeded in equal Markov cycles.
- Subjects were included in the model based on the disease states.
- Transitions between states (six) based on probability of improvement.
- Two treatment rules were applied in the model:
- A negative stopping rule (applied at week 24) for subjects with insufficient response.
- This group moved to other health states based on transition probabilities.
- Each health state associated with a specific cost.
- A positive stopping rule ( applied at week 48) for subjects with episodic migraines.
- The model assumed that this group stopped treatment after one year.
- Patients placed in each state based on the number of headaches per month:
- Six cycles identified (health state 1 to 6).
- Sensitivity analysis done to determine the effects on the final outcome:
- Calculated as Incremental cost (£) per QALY gained.
- Data sources for the model:
- Probability (Extrapolation of clinical trial observations).
- Cost and outcome values of two studies.
The economic model used to evaluate the cost-effectiveness of the intervention was the Markov model. The Markov model evaluates the costs of changing disease states over time. The patients were placed into six health (Markov) states based on the number of headaches experienced per month: state 1 (0-3), state 2 (4-9), state 3 (10-14), state 4 (15-19), state 5 (20-23) and state 6 (24 or more). Each cycle lasted for three months (12 weeks), which represented the frequency of administration in PREEMPT trials. The model used PREEMPT (clinical trials) data, with 64% of patients who met the NICE criteria entering the health state 4, 5 and 6 (chronic health state).
Transition probabilities (probabilities of improvement) used were derived from the PREEMPT trials and encompassed transition between the different states (six disease states) and a transition to termination of medication. For botulinum toxin A group, a uniform transition probability matrix was used for chronic health states (4, 5 and 6), while for placebo group, the same transition probability was repeated after the second cycle. The model used a time horizon of 2 years based on clinical data with the first year extrapolation data used for the year 2. In addition, two discontinuation rules were used; the negative stopping rule applied at week 24 and a positive stopping rule applied at week 48.
The elements of the model included the six health groups. After discontinuation, the patients moved from one state to another but with no extra cost incurred. The source of data was based on probabilistic extrapolation of PREEMPT data. The cost and outcome values of two prior studies (Bloudek et al., and Blumenfeld et al., studies) were also used as sources of data. Sensitivity analysis was then conducted to determine the data on the final outcomes.

Mapping Equations & Utility
- Two mapping methods were used to convert MSQ data to EQ-5D utility.
- The reason for mapping was to link utilities to each health state using two equations:
- One predicted utilities for chronic migraines;
- The other predicted utilities episodic migraines.
- EQ-5D utilities differed:
- For each disease state;
- For each treatment.
- Utility predicted based on clinical trial data:
- Utility values ranged from 0.479 to 0.746.
Two mapping equations were used in this model to convert the data (MSQ data) gathered during PREEMPT trials to utility values (EQ-5D utility) and associate each utility to a particular disease state. The first equation predicted the utilities for patients under health states 4, 5 and 6 (chronic health groups) while the second predicted utilities in states 1, 2 and 3 (episodic migraines). Each health state was associated with a specific health state. Patient data from the trials were used to predict utility, obtained by calculating the mean for patients in each health state. Using the equations utility values of 0.479 to 0.746 were obtained. The model used discontinuation rates to account for adverse events.

Basic Assumptions
- Adverse events had no effect on the cost and Quality of Life.
- Management of chronic migraines would involve a specialist with additional (consultant) costs.
- Administration time would be 30 minutes at a total cost of £73.
- The treatment costs were based on 200ml vial, no sharing of vial among patients.
- Cost assumed to be £349.40 per a three-month cycle.
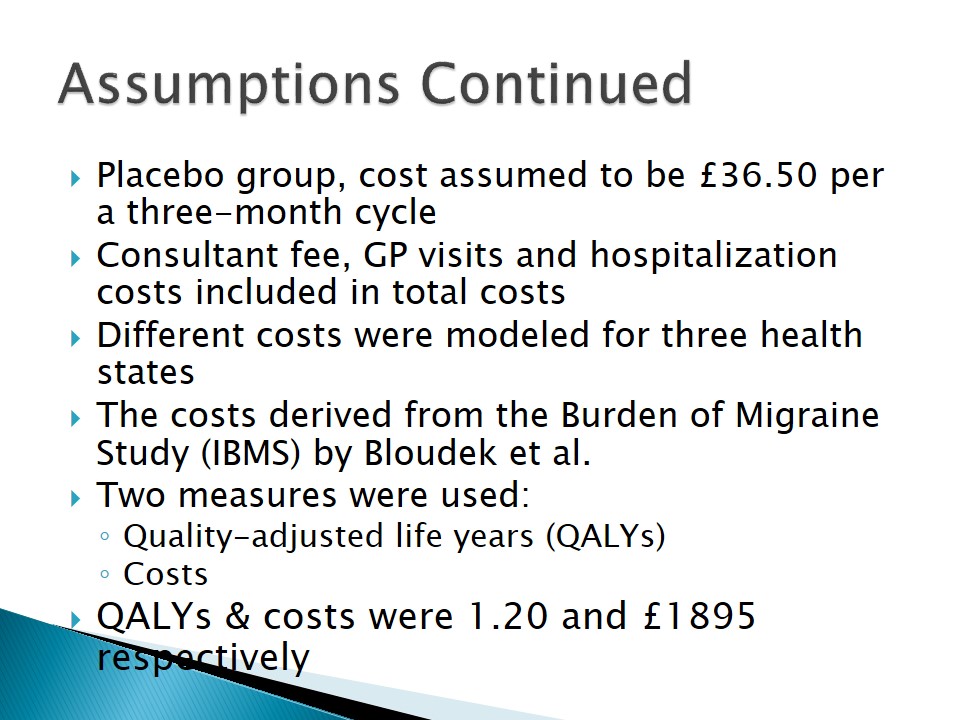
- Placebo group, cost assumed to be £36.50 per a three-month cycle.
- Consultant fee, GP visits and hospitalization costs included in total costs.
- Different costs were modeled for three health states.
- The costs derived from the Burden of Migraine Study (IBMS) by Bloudek et al.
- Two measures were used:
- Quality-adjusted life years (QALYs);
- Costs.
- QALYs & costs were 1.20 and £1895 respectively.
In this model three assumptions were made. First, the manufacturer assumed that specialized care would be required for health states 4, 5 and 6 (chronic migraines) and thus included consultant charges in the costs. Second, it was assumed that administration time would be thirty minutes at a total cost of £73. It was also assumed that no two patients would share one 200ml vial resulting in a total administration cost of £349.40 for each Markov cycle (12 week period).
For the placebo group, the administration cost was assumed to be £36.50 per cycle. Different (hospitalization, physician visits and emergency) costs were modeled and used for states 4-6 (chronic), states 2-3 and state 1 (episodic). The costs were derived from quality-adjusted life years (QALYs) and costs, discounted at 3.4% per annum from Bloudek et al. (2011) publication based on International Burden of Migraine Study (IBMS) of resource use.
Cost-effectiveness of Botulinum Toxin A
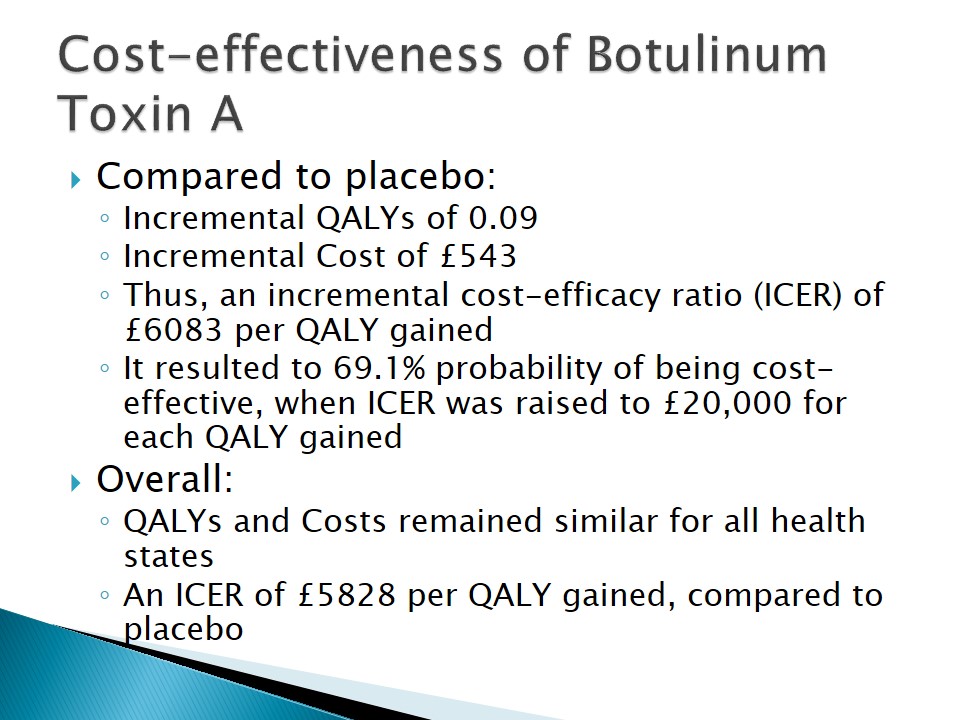
- Compared to placebo:
- Incremental QALYs of 0.09.
- Incremental Cost of £543.
- Thus, an incremental cost-efficacy ratio (ICER) of £6083 per QALY gained.
- It resulted to 69.1% probability of being cost-effective, when ICER was raised to £20,000 for each QALY gained.
- Overall:
- QALYs and Costs remained similar for all health states.
- An ICER of £5828 per QALY gained, compared to placebo.
The type of economic evaluation used in this model cost-effectiveness analysis. It relied on variations in specific measures; the costs and quality-adjusted life years (QALY’s) gained. The QALY’s and cost for botulinum toxin A were higher (£2438 and £1.20 respectively) than the QALY’s and cost of a placebo arm (£1895 and £1.20 respectively). Thus, an incremental cost of £543 and £543 QALY’s was realized. It also resulted in an incremental cost efficiency ratio (ICER) of £6083 for every LY’s gained compared with the placebo arm. By increasing ICER to the £20,000 threshold, it was found that botulinum toxin A had a 69% probability of being cost-effective.
Sensitivity Analysis
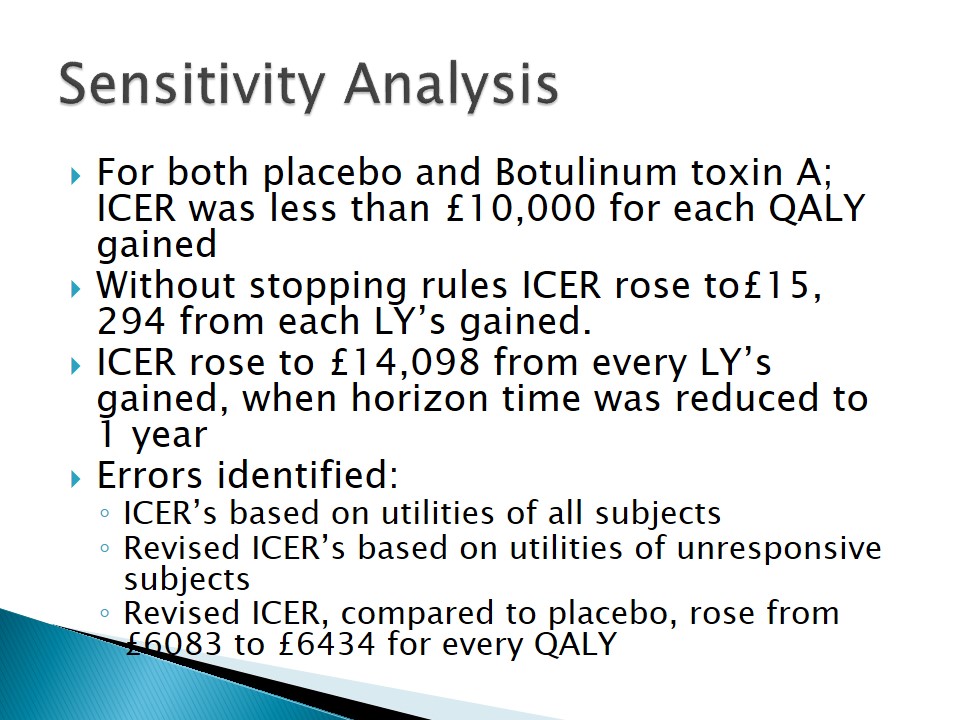
- For both placebo and Botulinum toxin A; ICER was less than £10,000 for each QALY gained.
- Without stopping rules ICER rose to£15, 294 from each LY’s gained.
- ICER rose to £14,098 from every LY’s gained, when horizon time was reduced to 1 year.
- Errors identified:
- ICER’s based on utilities of all subjects.
- Revised ICER’s based on utilities of unresponsive subjects.
- Revised ICER, compared to placebo, rose from £6083 to £6434 for every QALY.
Sensitivity analysis is one way of dealing with uncertainty. It entailed estimation of the impact of uncertainties and assumption on the results. The manufacturer considered variations in the cost value for both placebo arm and botulinum toxin A arm (treatment group). In both cases, the ICER for the treatment group remained under £10,000 QALY’s threshold. Stopping when the rules were excluded, ICER increased to £15,294 for each LY’s gained. Also, when the time horizon was reduced from 2 years to 1 year, the ICER rose to £15,294 from each LY’s gained. The further sensitivity analysis involved subgroup analyses.
Challenges in Encountered
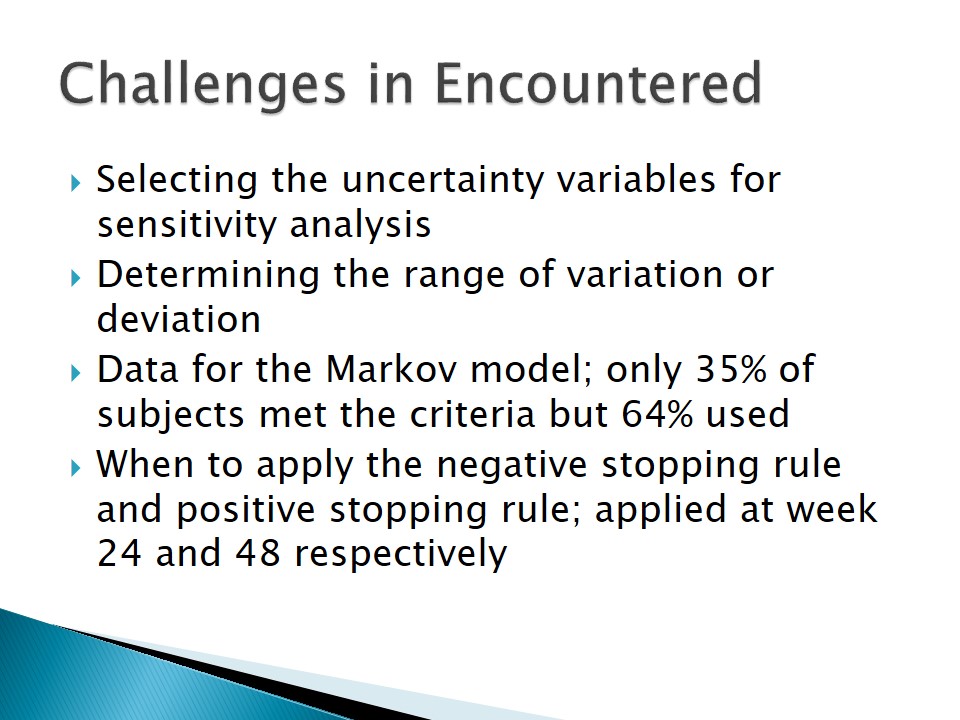
- Selecting the uncertainty variables for sensitivity analysis.
- Determining the range of variation or deviation.
- Data for the Markov model; only 35% of subjects met the criteria but 64% used.
- When to apply the negative stopping rule and positive stopping rule; applied at week 24 and 48 respectively.
- The costs to use to model the three health states; remained under the £10,000 threshold.
- The design of the trial; Baseline data changed in headache days.
- No patients at week 24 in disease states 5&6.
- Determination of the relationship between cost and outcome.
- Determination of the cost differences between placebo arm and botulinum toxin A group.
The challenges encountered when using this model involved how to identify the variables for sensitivity analysis; all the variables met the inclusion criteria. The manufacturer used QALY’s and cost as variables to compare the placebo arm and the botulinum toxin A group of three states: states 4-6 (chronic), states 2-3 and state 1 (episodic). Variations of time horizon (reduced) and stopping rules (avoided) were examined to determine the impact on ICER per LY’s gained. Only 34% (unresponsive to more than three therapies) of PREEMPT population met NICE criteria, but 64% of this population (those unresponsive to more than one therapies) was used. The manufacturer gave a reason for the inclusion: to improve the statistical power of significance. The discontinuation and continuation rules were applied at week 24 and 48 respectively, based on the Markov cycle (12 week cycle).
The cost (ICER) has to be maintained within a plausible range. The manufacturer modeled the cost based on the confidence interval for the average. This ensured that ICER per QL’s gained for botulinum toxin A remained under the £10,000 threshold. The baseline data was also a challenge; botulinum toxin A group experienced a lower rate of migraine episodes compared to the placebo group (11.5 vs. 12.7) but had higher cumulative headache hours than the placebo arm (295.7 vs. 274.9). The manufacturer had to change migraine episode frequency to headache days to account for chronic migraines and for the decision problem.
Removing the Stopping Rules
- Lack of data to support the application of the negative stopping rule.
- Other challenges:
- When to apply the negative stopping rule;
- Distribution between the health groups for discontinuing patients;
- The duration discontinued patients will take before re-treatment.
- Implementation of the positive stopping rule.
- Removing the positive stopping rule resulted to 100% increase in ICER to £12,542 from £6083 per LY’s gained.
The manufacturer relied on two previous studies to determine when to apply the discontinuation rules. The negative stopping rule was applied at week 24 while the positive stopping rule was applied at week 48. This was based on extrapolation data from two studies. Based on PREEMPT trial data as baseline data, patients were assigned to each of the six health status based on migraine episode frequency. It was assumed that, on average, it will take two years for discontinued patients to re-enter treatment. Applying the positive stopping rule resulted in a 100 % increase of ICER to £12,542 from £6083 for every LY’s gained.
Resource Utilization
- Sources of Data; was based on Bloudek et al. Study & Blumenfeld et al. (2011) et al.
- The two articles reported results from similar international study:
- Costs derived from the Scottish intervention program;
- The high health costs attribute to hospitalization costs;
- The studies contained detailed data that could be applied.
- Calculation of the utility values:
- Involved MSQ estimations, 6 months after trial;
- Assigning the utility values.
The sources of data (costs and outcomes) were two; Bloudek et al. Study & Blumenfeld et al. (2011) et al. This supplemented the data obtained through extrapolation of the PREEMPT probabilistic results. The costs used in this study including the hospitalization costs, administration costs and specialist consultancy costs were based on data from the two studies. The manufacturer used mapping equations to compute utility values from the MSQ estimations six months after the trials and assigned specific utility values to each health state.
Cost of administration
- Estimated based on 15 and 30 minutes for placebo and botulinum toxin A respectively;
- The cost estimation based on 30 min may be too optimistic;
- Follow-up cost for outpatients should not exceed £140.00;
- Based on the estimation, the intervention was cost-saving:
- Fewer GP visits;
- Less hospital admissions and readmissions;
- Less emergency attendance.
The cost-effectiveness of the treatment is based on calculated ICER values not estimates. The manufacturer described and interpreted the results of the PREEMPT trials and revealed possible bias and revised the values and results of sensitivity analysis in detecting errors. The resource implications of this treatment based on 30 minute neurologist time were determined as: less follow-up cost (£140.00), fewer GP visits, reduced admissions (for chronic migraines) and less emergency attendance. The treatment was found to be cost-effective compared to other pharmacological treatments based on its lower ICER value. Thus, this economic model was found to be appropriate for the decision problem.
Adjustments to this model
- Adjustments included:
- Computation of utility values;
- Resource usage.
- Addressing the discrepancies between probabilistic ICER and deterministic ICER values.
- Resource estimates based on Blumenfeld et al., that involved UK subjects.
- Bloudek et al., resource use data based on Scottish subjects not used.
- The manufacturer used data from Blumenfeld et al. (2011).
- The data were more relevant to the UK’s case.
NICE noted disparities in the economic model with regard to resource use, which was based on Bloudek et al., and Blumenfeld et al. (2011) data. Bloudek et al. Only provided information based on Scottish model and failed to give information on the gender and ages of participants, emergency costs, medication use, hospitalizations or GP visits. The manufacturer revised this, where emergency and accident costs were estimated at £90.94. When these adjustments were applied, cost-effectiveness increased to 67%.

Addressing the Challenges
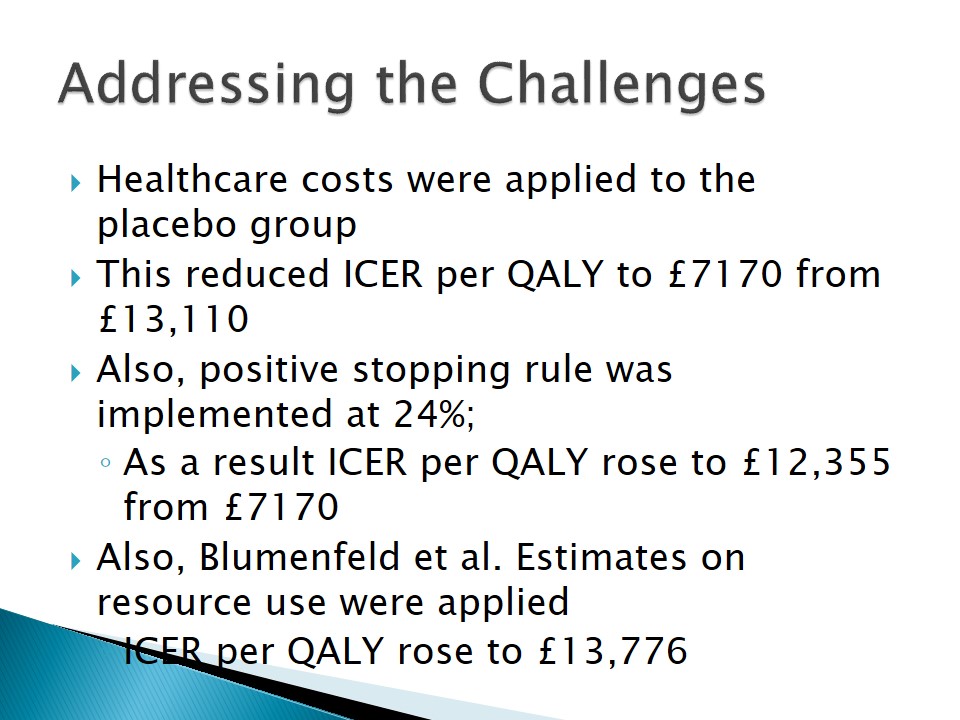
- Healthcare costs were applied to the placebo group.
- This reduced ICER per QALY to £7170 from £13,110.
- Also, positive stopping rule was implemented at 24%;
- As a result ICER per QALY rose to £12,355 from £7170.
- Also, Blumenfeld et al. Estimates on resource use were applied
- ICER per QALY rose to £13,776.
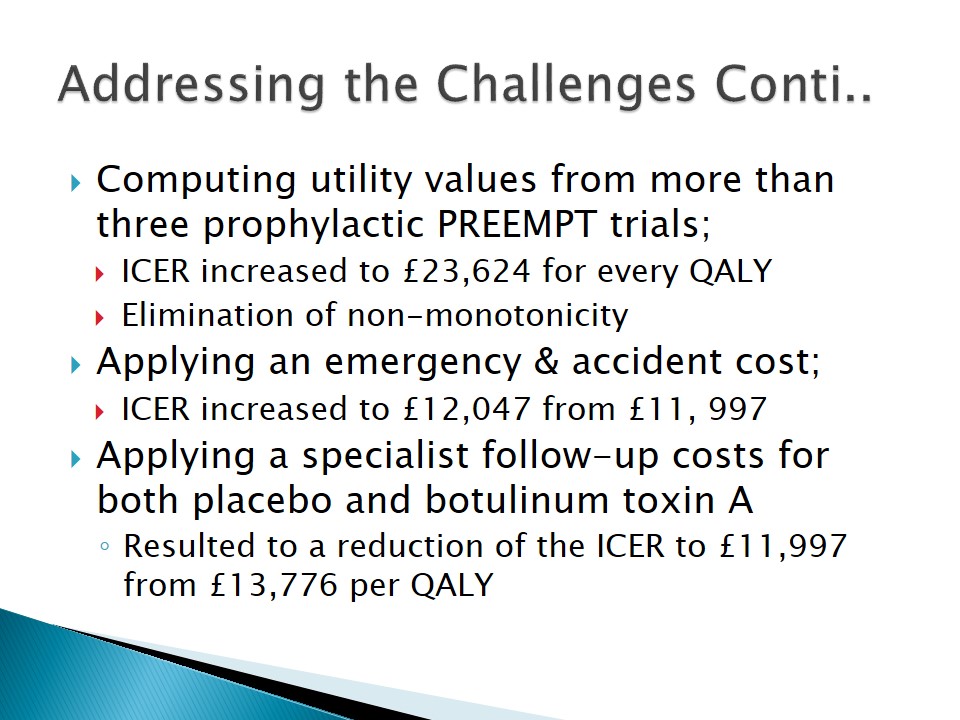
- Computing utility values from more than three prophylactic PREEMPT trials;
- ICER increased to £23,624 for every QALY.
- Elimination of non-monotonicity.
- Applying an emergency & accident cost;
- ICER increased to £12,047 from £11, 997;
- Applying a specialist follow-up costs for both placebo and botulinum toxin A:
- Resulted to a reduction of the ICER to £11,997 from £13,776 per QALY.
To address some of these challenges, the manufacturer used data from a relevant source, Blumenfeld et al. (2011) that involved UK patients and costs. The manufacturer also included routine care costs in the placebo group, where initially no routine costs were applied. Based on Blumenfeld et al., costs, new utility values were computed and applied to specific health states. These changes lowered the ICER from £13,110 to £7170 per LY’s gained. Also, by varying the application of the discontinuation rules, it was possible to determine the plausible range of the variables. As a result, the ICER increased to £12,355 from £7170 per LY’s gained. By using the resource use data of Blumenfeld et al. LY’s rose from £12,355 to £13,776.
To handle uncertainty associated with sensitivity analysis, the manufacturer computed utility values based on three prophylactic clinical trials. As a result, the ICER increased to £23,624 per LY’s gained. This also eliminated non-monotonicity encountered in earlier sensitivity analyses. The manufacturer also included the accident and emergency costs in the calculation of ICER; this increased the ICER to £12,047 from £11, 997 per LY’s gained. Additionally, specialist follow-up costs were included in both groups (botulinum toxin A and placebo). This reduced the ICER per LY’s gained from £13,776 to £11,997, which is still under NICE’s £20,000 threshold.
The Impact of the Revisions
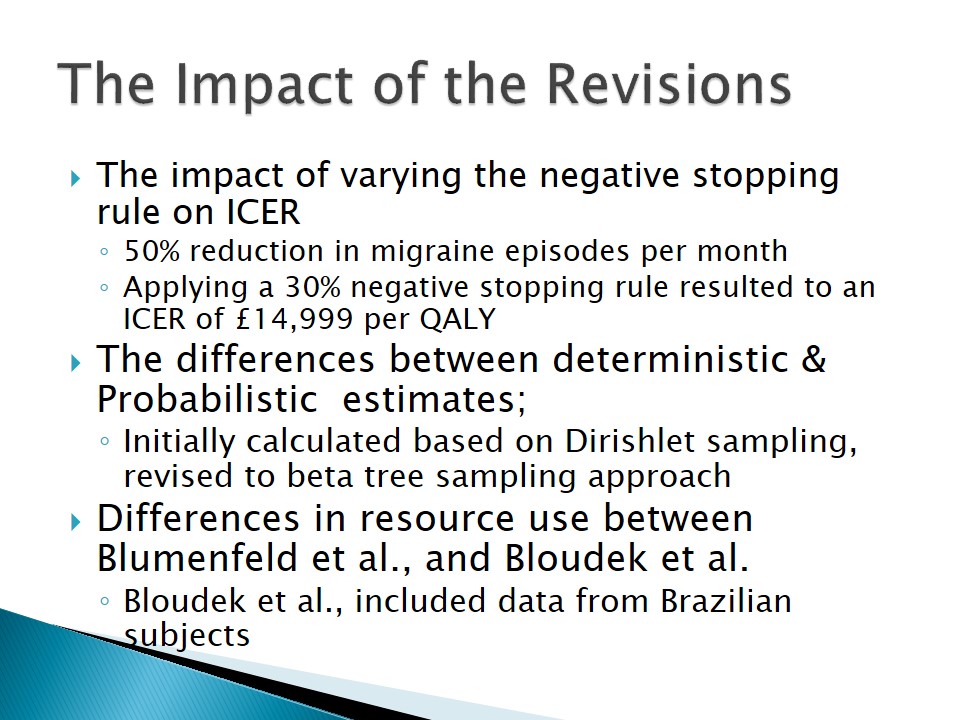
- The impact of varying the negative stopping rule on ICER:
- 50% reduction in migraine episodes per month;
- Applying a 30% negative stopping rule resulted to an ICER of £14,999 per QALY.
- The differences between deterministic & Probabilistic estimates;
- Initially calculated based on Dirishlet sampling, revised to beta tree sampling approach.
- Differences in resource use between Blumenfeld et al., and Bloudek et al.
- Bloudek et al., included data from Brazilian subjects.
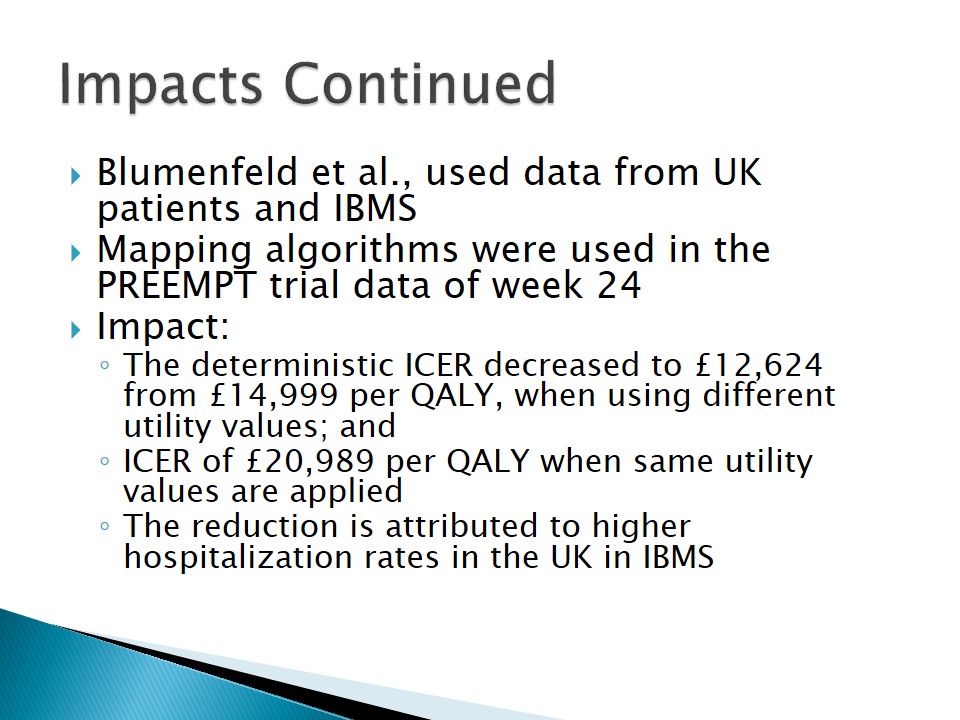
- Blumenfeld et al., used data from UK patients and IBMS.
- Mapping algorithms were used in the PREEMPT trial data of week 24.
- Impact:
- The deterministic ICER decreased to £12,624 from £14,999 per QALY, when using different utility values;
- ICER of £20,989 per QALY when same utility values are applied;
- The reduction is attributed to higher hospitalization rates in the UK in IBMS.
The negative stopping rule, which initially was applied on week 24, was varied over a range of values to determine the impact on ICER. This resulted in a 50% decrease in the number of headache episodes per month. When a 30% negative stopping rule was applied, the ICER increased to £14,999 per LY’s gained. The challenge of using either deterministic or probabilistic estimates from PREEMPT data was also addressed; the Dirishlet sampling method used initially was changed to the beta tree sampling method.
When the deterministic estimates were used in place of probabilistic estimates, ICER decreased to £12,624 from £14,999 per LY’s gained when applied to different utility values. The same deterministic values when applied to same utility values (from probability estimations) resulted to an increase in ICER of £20,989 per LY’s gained. The lower deterministic ICER when different utility values are used is attributed to high hospitalization rates in the UK and the use of IBMS data in Blumenfeld et al., publication.
Final Comments
- The neurologist time was well-adjusted:
- A cost of £140 for 1 hour instead of a cost of £70 for 30 minutes;
- As neurologist time included consultation costs.
- Lower neurologist time was applied to the placebo group;
- The revised economic model included appropriate assumptions and inputs;
- The revised economic model included follow-up cost of £140.
The economic model was adjusted to reflect relevant data on resource use and costs making it appropriate for decision-making. Also, the neurologist time was adjusted and various assumptions included in the sensitivity analysis. The deterministic estimation of utility values and inclusion of a range of costs resulted to reliable ICER per QALY values below £30,000 that can be used as a basis for decision-making.
