Plasmonic Gold Nanosensor: Preparation and Application Coursework

Exclusively available on IvyPanda Available only on IvyPanda

Synthesis of Plasmonic Gold Nanoparticles

  • How does the solution visibly change? Record your observations in the table 1 (5 points)

Table 1.

We will write a custom essay on your topic a custom Coursework on Plasmonic Gold Nanosensor: Preparation and Application
808 writers online
Colour of HAuCl4solution before reactionColour immediately after the addition of sodium citrateColour change during the reactionColour of final solution
Light yellowClear to light greyDark grey, dark purpleWine red
  • Why do you think during the reaction some intermediate colours are seen? (10 points)
Intermediate colours are seen during the reaction to signify the various stages of growth of the AuNPs. During the formation of gold nanoparticles, Au3+ions are reduced sequentially to atomic Au0. The transition from Au3+ions to atomic Au0 is what is seen as intermediate colours. The resultant Au0 is what appears wine red in colour. Citrate anions originating from the reducing agent adsorb onto the surface of each nanoparticle to create an electrostatic repulsion, which ensures that the nanoparticles are separated and stabilized in solution. Adding smaller anions facilitates a further aggregation of the particles, which leads to the development of a different colour.

For instance, adding a strong electrolyte such as NaCl to a solution containing negatively charged AuNP solution increases the ionic concentration. Consequently, the repulsive forces between nanoparticles are buffered. The ensuing reduction in electrostatic repulsion causes the gold nanoparticles to aggregate, which further reduces the space between the nanoparticles. The solution takes in light at longer wavelengths and changes to purple or blue.

The visualisation of the transition colours occurs due to localized surface plasmon resonance (LSPR), which happens when incident light electrifies free conductive electrons of the metallic nanoparticles. The excited electrons then oscillate with the same frequency as the incident photon frequency. Excitation may cause the selective absorption and scattering of incident radiation by the metallic nanoparticles. Therefore, the nanoparticles can exhibit various colours including red, purple or blue. The precise colour that is visualised is determined by the size, shape, distance between particles and media surrounding the nanoparticles.

Characterization and Property of the Synthesized Plasmonic Gold Nanoparticles

You are provided with 3 ruby-red samples containing: red wine, food colourant, and AuNP solution. These three samples are labelled as A, B, and C. Based on the Tyndall light scattering effect, salt-induced aggregation LSPR properties, which sample contain AuNPs? Present the evidences that help you identify the AuNP solution. Please explain in detail (25 points)

To identify the AuNP solution based on Tyndall light scattering effect, a laser pointer was shone through the solutions to detect any particles. AuNP solution contains gold nanoparticles. Therefore, when a laser pointer was shone on it, the laser light was scattered leading to the visualisation of the scattered light. The light scattering was seen in solution A. The other two solutions (B and C) did not exhibit light scattering effects upon illumination with the laser light.
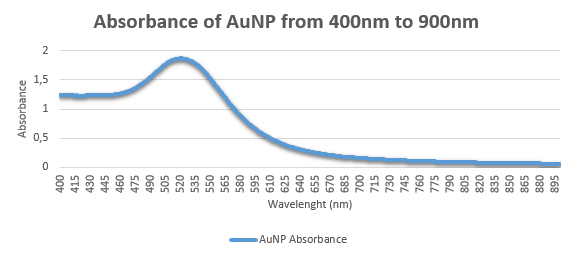
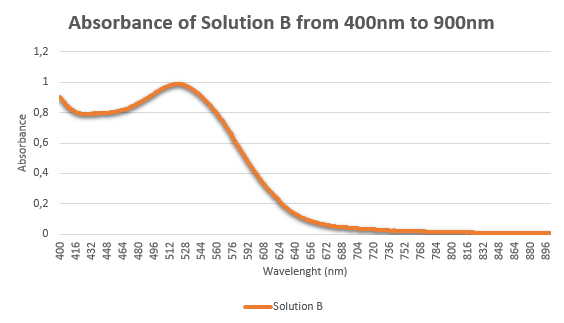
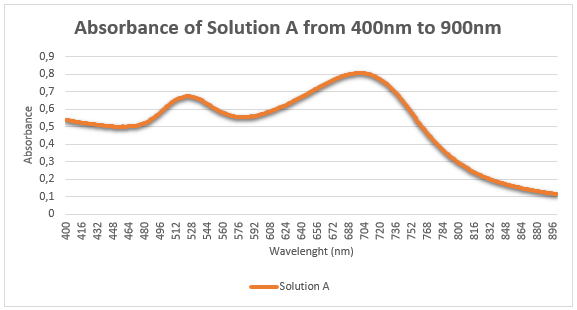
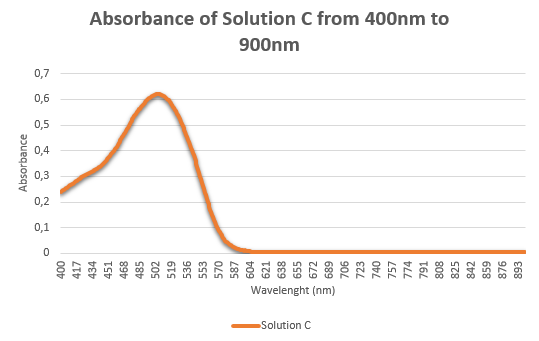
Based on LSPR properties, AuNP demonstrates strong absorbance at 520 nm when the sample is analysed UV-Vis spectrophotometer at a scanning mode of 400 to 900 nm. This was determined by creating the absorbance spectra of the three solutions from 400 to 900 nm.
In the following absorption spectra for solutions A, B and C, only solution A shows a strong peak absorbance at 520 nm.

Absorbance spectrum of solution A/B

Absorbance spectrum of solution C

Based on salt-induced aggregation properties, the addition of a strong electrolyte such as NaCl to a negatively charged AuNP solution introduces a high concentration of ions that reduce the repulsive electrostatic forces between nanoparticles. Aggregation finally occurs due to the reduction in repulsion forces. The solution absorbs light at longer wavelengths and changes from blue to purple and ultimately clear if more electrolyte is added. The absorbance spectra of mixtures of solutions A, B and C with NaCl are shown below. The absorbance spectrum for solution A with NaCl shows a peak absorbance at a longer wavelength, which is line with the observation that the addition of a strong electrolyte to AuNP causes a colour change and absorbance at a longer wavelength (approximately 720 nm). This spectrum proves that solution A is AuNP.

Solution A/B + Nacl

Solution C + Nacl

  • You are provided with three colourless samples containing: casein, sugar, and salt. These samples are labelled as A, B, and C. Using the negative charged citrate-stabilized AuNPs that you have synthesized, identify what the sample A, B, or C contains about. Present the evidences that help you identify the samples A, B, and C. Please explain in detail (25 points)
How do the solutions visibly change? Record your observations in the table 2.

Table 2.

Sample
ABC
Citrate-stabilised AuNPsDark redDark redDark red
10 min after adding the sample A, B, or CDark redDark blue, greyDark red
After adding 10% NaClDark redLight greyDark blue, grey

The sample A is: Casein

Your explanation:

Casein is a protein consisting of molecules with a high molecular weight. When a protein solution is added to citrate-stabilised AuNPs, the protein molecules affix to the exterior of the AuNPs through different mechanisms, for instance, covalent binding, hydrophobic interactions or any other and other weak interactions. As a result, the aggregation of the nanoparticles cannot take place even if the salt concentration is increased. Therefore, the colloidal solution remains red. The colour of citrate-stabilised AuNPs was dark red and remained so even after adding the sample and increasing the salt concentration, which confirmed the presence of a high molecular weight compound.

The sample B is: Salt

Your explanation:

Salts are strong electrolytes that dissociate completely to give ions. The addition of a strong electrolyte to a stabilised, negatively charged AuNP solution introduces a high concentration of ions that buffer the repulsive electrostatic forces between nanoparticles. The overall outcome is a decline in repulsive force is diminished, which prompts the gold nanoparticles to aggregate. Aggregation reduces the spacing between the nanoparticles and enhances the absorption of light at longer wavelengths. Therefore, the solution changes to purple or blue. Adding a larger quantity of the electrolyte leads to the precipitation of large nanoparticle collections, which causes the solution to become light grey and finally clear.

The sample C is: Sugar

Your explanation:

Sugar may be considered a nonelectrolyte or a weak electrolyte. The addition of such a solution to AuNPs does not interfere with the repulsive forces between the gold and citrate particles. Therefore, the solution remains red. However, the subsequent addition of a strong electrolyte such as NaCl introduces a high concentration of negative ions that in turn screen the repulsive electrostatic forces between nanoparticles. There is a reduction in repulsion forces, thereby leading to the aggregation of the gold nanoparticles, minimal spacing between nanoparticles and the absorption of light at longer wavelengths. The colour of the solution then changes to blue or grey.

Development of Colorimetric Nanosensor for Detection of Ascorbic Acid (Vitamin C)

  • Record the measured absorbance values into Table 3 (10 points)

Table 3.

SampleAbsorbance (λ550 nm)Mean (λ550 nm)STDEV
0-0.0020.001-0.006-0.0010.002
10.0920.064-0.0030.0780.020
1.10.0140.211-0.0050.1130.139
1.20.1010.2030.0460.1520.072
1.30.3510.0580.0340.2050.207
1.40.8820.3810.0900.6320.354
1.50.8991.1191.3431.2310.158
1.61.4901.3521.7041.4210.098
1.71.0951.4981.7881.6430.205
1.81.6631.9561.0831.8100.207
unknown1.8111.1151.1031.1090.008
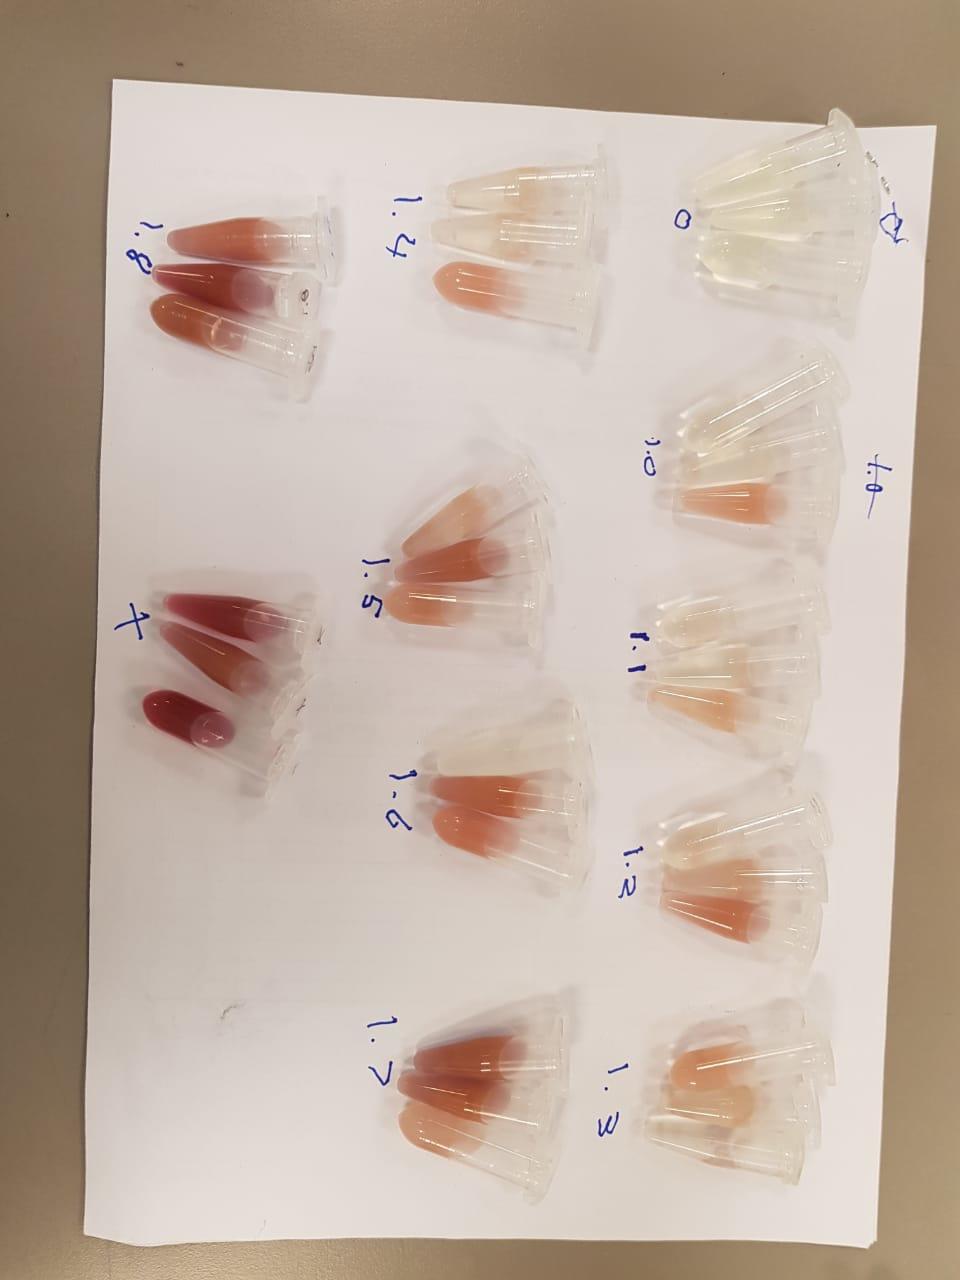
  • What is the estimated concentration of the blind sample based on the colour tonality of the diluted concentrations? Present with a colour photograph taken by your group. (5 points)

Colour tonality of the diluted concentrations

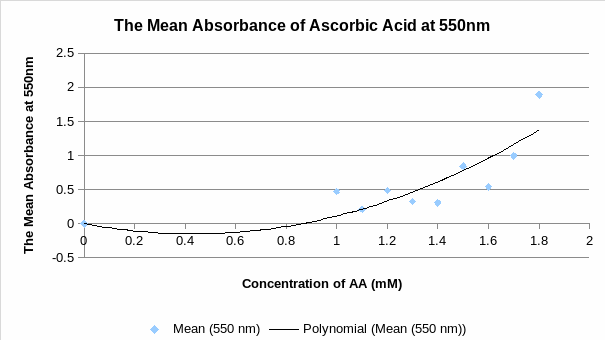
  • Plot a calibration curve between mean values A550 nm and AA concentrations that you recorded in Table 3. The value of STDEV (standard deviation) should be presented in the curve. Is the calibration curve linear within this concentration range? (10 points)
A graph of mean absorbance xersus concentration

The calibration curve is not linear within this concentration range.

  • A linear relationship between mean values A550 nm and AA concentrations could be obtained if your results are good enough. Plot your linear fitted curve. Based on the linear regression, what is the detection limit of the assay? (5 points); and what is the AA concentration of the blind sample? (5 points)
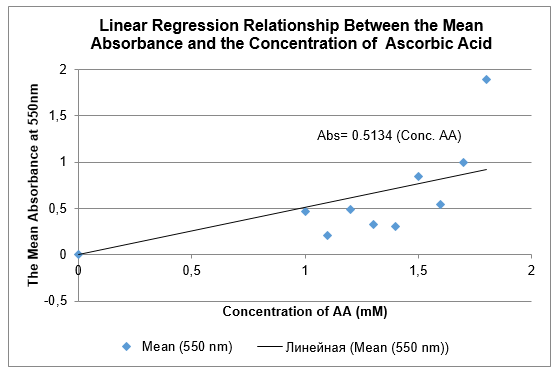
Linear fitted curve of mean absorbance versus concentration

The detection limit of the assay can be defined as the sum of the analyte concentration of the blank and 3 standard deviations (Allegrini & Olivieri 2014), which is 0+0.002 mM. Therefore, the limit of detection is 0.002mM.

The AA concentration of the blind sample can be obtained from the equation of the standard curve y= 1.0699x-0.6197. The mean absorbance of the blind sample is 1.109. Substituting this value into the equation gives 1.109=1.0699(x)-0.6197.
1.109+0.6197=1.0699x
1.7287=1.0699
1.6157=x

The AA concentration of the blind sample is 1.616 mM.

Reference List

Allegrini, F & Olivieri, AC 2014, ‘IUPAC-consistent approach to the limit of detection in partial least-squares calibration’, Analytical Chemistry, vol. 86, no. 15, pp. 7858-7866.

Print
Need an custom research paper on Plasmonic Gold Nanosensor: Preparation and Application written from scratch by a professional specifically for you?
808 writers online
Cite This paper
Select a referencing style:

Reference

IvyPanda. (2021, April 29). Plasmonic Gold Nanosensor: Preparation and Application. https://ivypanda.com/essays/plasmonic-gold-nanosensor-preparation-and-application/

Work Cited

"Plasmonic Gold Nanosensor: Preparation and Application." IvyPanda, 29 Apr. 2021, ivypanda.com/essays/plasmonic-gold-nanosensor-preparation-and-application/.

References

IvyPanda. (2021) 'Plasmonic Gold Nanosensor: Preparation and Application'. 29 April.

References

IvyPanda. 2021. "Plasmonic Gold Nanosensor: Preparation and Application." April 29, 2021. https://ivypanda.com/essays/plasmonic-gold-nanosensor-preparation-and-application/.

1. IvyPanda. "Plasmonic Gold Nanosensor: Preparation and Application." April 29, 2021. https://ivypanda.com/essays/plasmonic-gold-nanosensor-preparation-and-application/.


Bibliography


IvyPanda. "Plasmonic Gold Nanosensor: Preparation and Application." April 29, 2021. https://ivypanda.com/essays/plasmonic-gold-nanosensor-preparation-and-application/.

Powered by CiteTotal, essay referencing tool
If you are the copyright owner of this paper and no longer wish to have your work published on IvyPanda. Request the removal
More related papers
Cite
Print
1 / 1