Plasmonic Gold Nanosensor: Preparation and Characterizations Report

Exclusively available on IvyPanda Available only on IvyPanda

Synthesis of Plasmonic Gold Nanoparticles

  • How does the solution visibly change? Record your observations in the table 1 (5 points)

Table 1.

We will write a custom essay on your topic a custom Report on Plasmonic Gold Nanosensor: Preparation and Characterizations
808 writers online
Colour of HAuCl4solution before reactionColour immediately after the addition of sodium citrateColour change during the reactionColour of final solution
YellowColourless
  1. Grey.
  2. Change to Black.
  3. Purple
Wine red
  • Why do you think during the reaction some intermediate colors are seen? (10 points)
Intermediate colour changes are visible because the reduction of gold nanoparticles occurs gradually. Before the addition of sodium citrate, which is a weak reducing agent, gold nanoparticles appear yellow in solution. The addition of sodium citrate reduces gold nanoparticles, making them aggregate and form colourless solution. Reduction gradually increases the repulsive forces between gold nanoparticles; hence prevent them from aggregating (Tyagi et al. 2016).

As the surface charge of gold nanoparticles increases, the colour changes from grey, black, purpose, and eventually wine red. The final colour of wine red indicates that the reduction process has reached maximum where all gold nanoparticles have optimum repulsive forces that inhibit aggregation.

Characterization and Property of the Synthesized Plasmonic Gold Nanoparticles

  • You are provided with 3 ruby-red samples containing: red wine, food colorant, and AuNP solution. These three samples are labelled as A, B, and C. Based on the Tyndall light scattering effect, salt-induced aggregation LSPR properties, which sample contain AuNPs? Present the evidences that help you identify the AuNP solution. Please explain in detail (25 points)
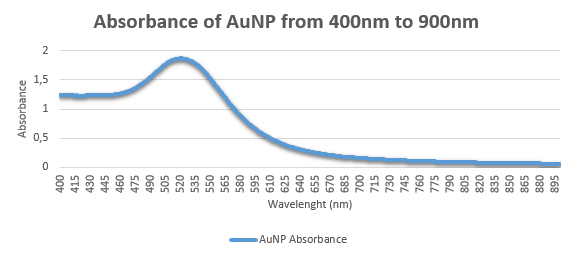
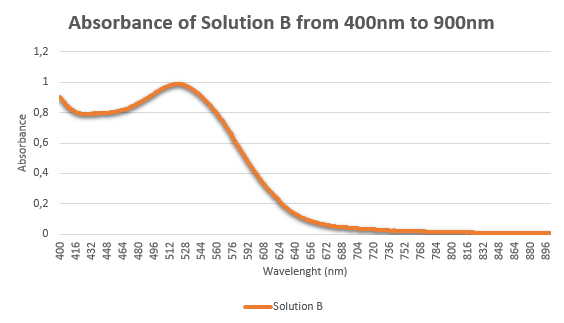
Gold nanoparticles exhibit localized surface plasmon resonance (LSPR) at the wavelength of 520nm, where scattering and optimum absorption of light happens. The comparison of LSPR modes of solutions A, B, and C shows that sample B contains AuNPs. The absorbance curve depicts that solution B has a peak absorbance at 520nm (figure 2), which is identical to the absorbance of AuNPs (figure 1).
Absorbance Curve of AuNP Solution.
Figure 1. Absorbance Curve of AuNP Solution.
Absorbance Curve of Solution B.
Figure 2. Absorbance Curve of Solution B.

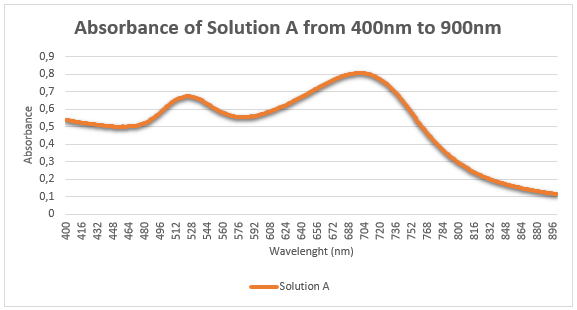
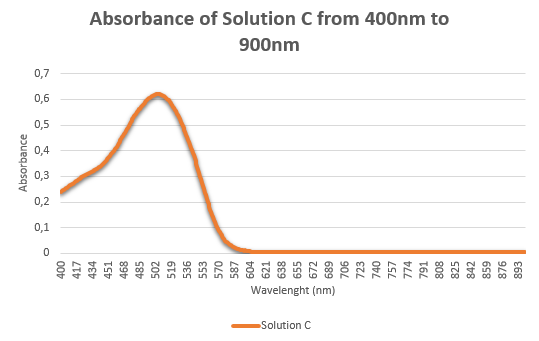
The absorbance curve (figure 3) indicates that solution A has double peaks of absorbance at about 520nm and 700nm, which contrast the single peak of AuNPs at 520nm. Moreover, the absorbance curve of solution C contrasts that of AuNPs because it depicts a peak absorbance at 500nm (figure 4).

Absorbance Curve of Solution A.
Figure 3. Absorbance Curve of Solution A.
Absorbance Curve of Solution C.
Figure 4. Absorbance Curve of Solution C.
  • You are provided with three colourless samples containing: casein, sugar, and salt. These samples are labelled as A, B, and C. Using the negative charged citrate-stabilized AuNPs that you have synthesized, identify what the sample A, B, or C contains about. Present the evidences that help you identify the samples A, B, and C. Please explain in detail (25 points)
How do the solutions visibly change? Record your observations in the table 2

Table 2.

Sample
ABC
Citrate-stabilized AuNPsRedRedRed
10 min after adding the sample A, B, or CRedGreyRed
After adding 10% NaClRedLight greyGrey

The sample A is: Casein

Your explanation: As the colour of reduced AuNPs remains constant, it implies that the added solution does not affect its stability. Usually, molecules with high molecular weight, such as proteins, antibodies, antigens, and nucleic acids, do not affect the stability of gold nanoparticles since they interact and inhibit aggregations. In this case, casein is a protein molecule that stabilizes reduced gold nanoparticles because it maintains red coloration, irrespective of the duration of reduction or addition of a strong electrolyte (10% NaCl).

The sample B is: Salt

Your explanation: The addition of a strong electrolyte into reduced gold nanoparticles decreases the repulsive forces, which are integral in preventing aggregation and causing colour changes. Since salt is a strong electrolyte, it tends to neutralize negative surface charges on gold nanoparticles and allow them to coalesce (Stoker 2015). Further addition of 10% NaCl weakens repulsive forces between gold nanoparticles. Colour changes from red to grey and light grey indicates diminishing repulsive forces and aggregation of gold nanoparticles. Thus, the ability of solution B to cause colour changes in citrate-stabilized AuNPs shows that the solution is an electrolyte (salt).

The sample C is: Sugar

Your explanation: The addition of a non-electrolyte into reduced gold nanoparticles does not affect the surface charge. Stoker (2015) explains that sugar is a non-electrolyte because it does not form ions in the aqueous state. Hence, the addition of sugar into citrate-stabilized AuNPs does not cause changes in coloration because non-electrolytes do not affect reduced gold nanoparticles. However, the addition of a strong electrolyte (10% NaCl) caused the colour to change from red to grey due to the reduction of repulsive forces and enhanced interaction of gold nanoparticles.

Development of Colorimetric Nanosensor for Detection of Ascorbic Acid (Vitamin C)

Record the measured absorbance values into Table 3 (10 points)

Table 3.

SampleAbsorbance (λ550 nm)Mean (λ550 nm)STDEV
0-0.001-0.0000.0000.0000.001
10.813-0.0030.6080.4730.425
1.10.1140.1160.3930.2080.161
1.20.0980.2251.1340.4860.565
1.30.7190.2140.0500.3280.349
1.40.0920.7750.0560.3080.405
1.50.3001.5720.6600.8440.656
1.60.0070.4341.1810.5410.594
1.70.7270.6881.5680.9940.497
1.81.3502.5901.7301.8900.635
unknown1.9901.8551.9091.9180.068
  • What is the estimated concentration of the blind sample based on the colour tonality of the diluted concentrations? Present with a colour photograph taken by your group. (5 points) 1.8mM
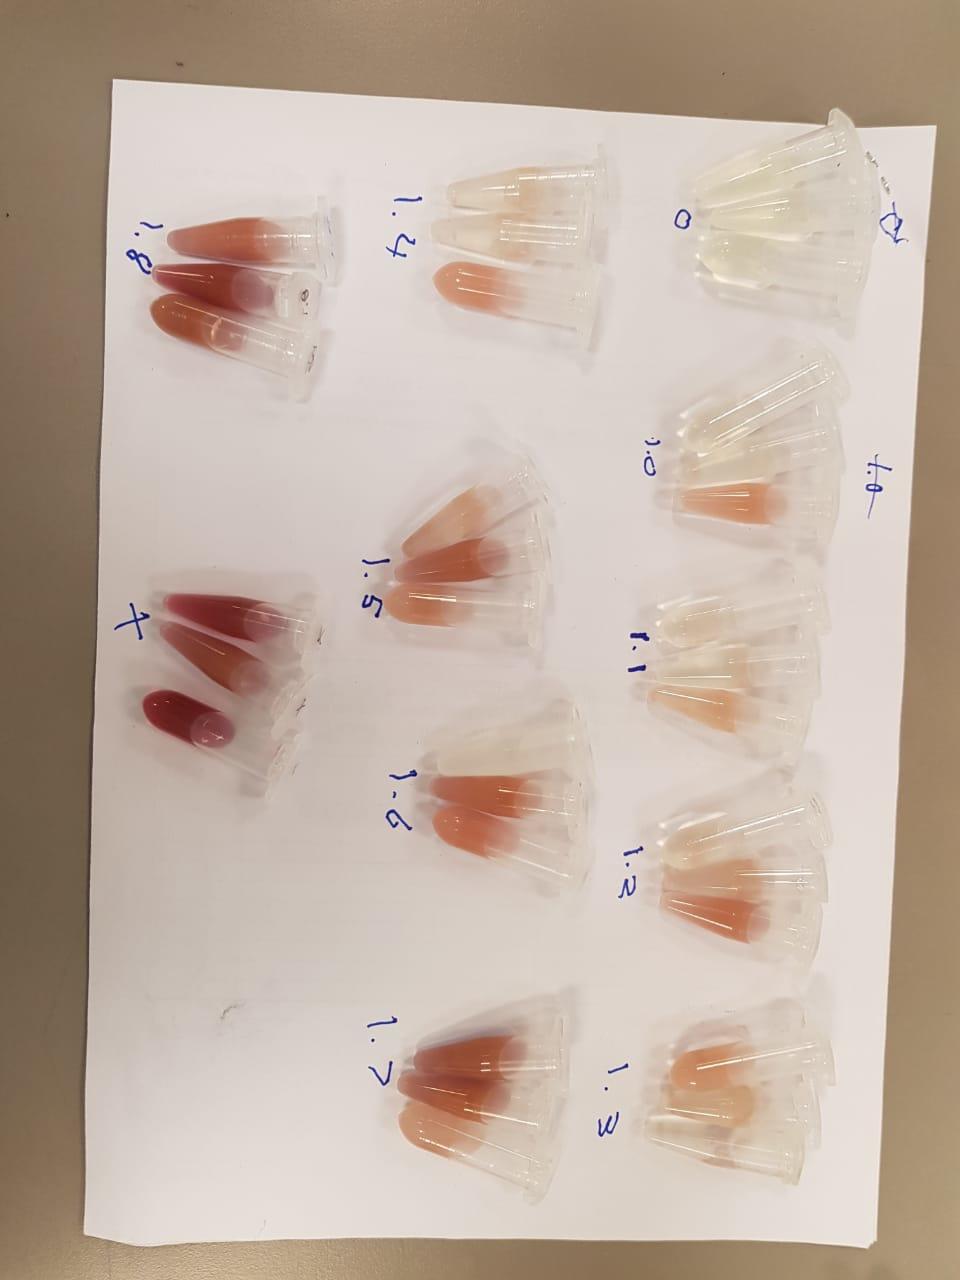
Colour tonality of the diluted concentrations

  • Plot a calibration curve between mean values A550 nm and AA concentrations that you recorded in Table 3. The value of STDEV (standard deviation) should be presented in the curve. Is the calibration curve linear within this concentration range? (10 points)

The calibration curve does not appear linear within the range of concentration of 0 to 2mM because logarithmic scale fit the data points more than a linear scale.
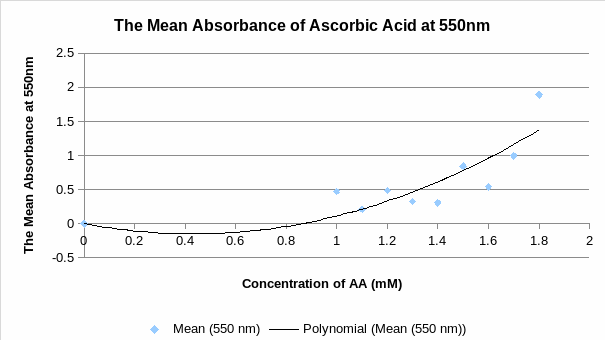
The mean absorbance of ascorbic acid at 550nm
  • A linear relationship between mean values A550 nm and AA concentrations could be obtained if your results are good enough. Plot your linear fitted curve. Based on the linear regression, what is the detection limit of the assay? (5 points); and what is the AA concentration of the blind sample? (5 points)
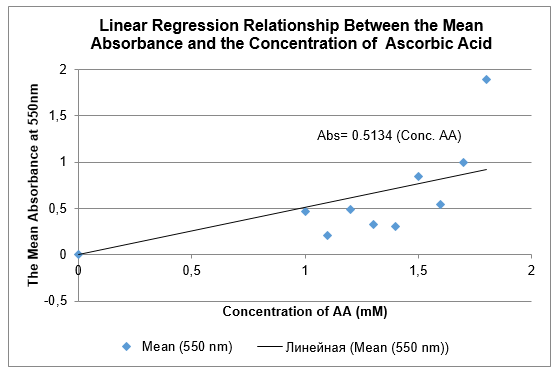
Linear regression relationship between the mean absorbance and the concentration of ascorbic acid

Absorbance = 0.5134(Conc. AA)The detection limit of AA, which is triple the standard deviation of the blank solution with background noices (Workman 2016), is 0.003 (0.001*3).

1 hour!
The minimum time our certified writers need to deliver a 100% original paper

Unknown sample absorbance = 1.918

Therefore, the concentration of the unknown sample of AA = 1.918/0.5134 = 3.736nM

References

Stoker, S 2015, General, organic, and biological chemistry, Cengage Learning, Mason, OH.

Tyagi, H, Kushwaha, A, Kumar, A, & Aslam, M 2016, ‘A facile pH controlled citrate-based reduction method for gold nanoparticle synthesis at room temperature’, Nanoscale Research Letters, vol. 11, no. 1, pp. 1-11.

Workman, J 2016, The concise handbook of analytical spectroscopy: theory, applications, and reference materials, World Scientific, New Jersey, NJ.
Print
Need an custom research paper on Plasmonic Gold Nanosensor: Preparation and Characterizations written from scratch by a professional specifically for you?
808 writers online
Cite This paper
Select a referencing style:

Reference

IvyPanda. (2021, April 29). Plasmonic Gold Nanosensor: Preparation and Characterizations. https://ivypanda.com/essays/plasmonic-gold-nanosensor-preparation-and-characterizations/

Work Cited

"Plasmonic Gold Nanosensor: Preparation and Characterizations." IvyPanda, 29 Apr. 2021, ivypanda.com/essays/plasmonic-gold-nanosensor-preparation-and-characterizations/.

References

IvyPanda. (2021) 'Plasmonic Gold Nanosensor: Preparation and Characterizations'. 29 April.

References

IvyPanda. 2021. "Plasmonic Gold Nanosensor: Preparation and Characterizations." April 29, 2021. https://ivypanda.com/essays/plasmonic-gold-nanosensor-preparation-and-characterizations/.

1. IvyPanda. "Plasmonic Gold Nanosensor: Preparation and Characterizations." April 29, 2021. https://ivypanda.com/essays/plasmonic-gold-nanosensor-preparation-and-characterizations/.


Bibliography


IvyPanda. "Plasmonic Gold Nanosensor: Preparation and Characterizations." April 29, 2021. https://ivypanda.com/essays/plasmonic-gold-nanosensor-preparation-and-characterizations/.

Powered by CiteTotal, essay referencing tool
If you are the copyright owner of this paper and no longer wish to have your work published on IvyPanda. Request the removal
More related papers
Cite
Print
1 / 1