Introduction
Absorption spectroscopy is a powerful research tool that allows one to evaluate the molecular structure of a substance or mixture of substances by post hoc measurement of their vibrational dynamics when exposed to electromagnetic radiation. As a rule, ultraviolet radiation (from 10 nm to 400 nm) is used to study organic molecules, the use of which at wavelengths greater than 180 nm is appropriate for the identification of chromophores.
With this radiation, the relatively low-cost electron transition![]() is noticeable, reflected in the appearance of characteristic peaks in the spectrogram.
is noticeable, reflected in the appearance of characteristic peaks in the spectrogram.
Aspirin (acetylsalicylic acid), C9H8O4, used in this laboratory work, has a cyclic aromatic structure, which means that several output peaks characterize it. From this data, it is possible to calculate the analyte’s unknown concentration using the formula expression of the Beer-Lambert law: Equations 1 and 2.

To find the concentration of an unknown substance, the principle of constructing a calibration curve was used to estimate the desired value. This point was the basic idea for performing this study, in which acetylsalicylic acid, which is the main component of analgesics, was actively hydrolyzed to salicylic acid: the reaction is shown in Figure 1. Thus, the purpose of this laboratory work was to identify the concentration of acetylsalicylic acid in Aspirin tablets using concentrations of substances of known compositions.

Experimental
Reagents
- Sodium hydroxide, NaOH, high purity.
- Salicylic acid, C7H6O3, high purity.
- Five Bayer aspirin tablets, high purity (×3).
Solutions
- Sodium hydroxide, 0.49 M. 9.9880 g of sodium hydroxide substance was weighed by the difference method on a scale; then dissolved in 400 mL of distilled water and thoroughly mixed. The resulting solution was placed in a 500 mL flask for storage and later use.
- Stock salicylic acid, 3.57×10⁻³ M. Salicylic acid weighing 0.1234 g was dissolved successively in 25 mL of 0.50 M sodium hydroxide solution and 25 mL of distilled water. Subsequently, this solution was moved to a 250 mL flask for storage and dissolved in the amount of water to the mark on the container.
Instrumentation
Perkin Elmer Lambda35 double beam spectrophotometer.
Procedure
This laboratory work was performed as described in the Instrumental Methods of Analysis Chem 447 Winter 2020 manual experiment titled Quantitative Analysis of Aspirin Tablets by Ultraviolet Absorption Spectrophotometry written by Judith Bazzi. Five analytically clean volumetric flasks were prepared in advance to create a series of samples.
Various amounts of stock salicylic acid solution were placed in them and mixed with 10 mL of 0.50 M NaOH solution. To construct a calibration curve, a spectrum was taken from the calibration solution with the mean amount of salicylic acid (3.00 mL) at maximum light absorption. Three samples of ground Aspirin tablets (5 in each set) were dissolved in sodium hydroxide, after which their optical densities were measured at the wavelength determined by calibration. From the data obtained, the concentration of the substance in the three unknown solutions was calculated.
Results and Discussion
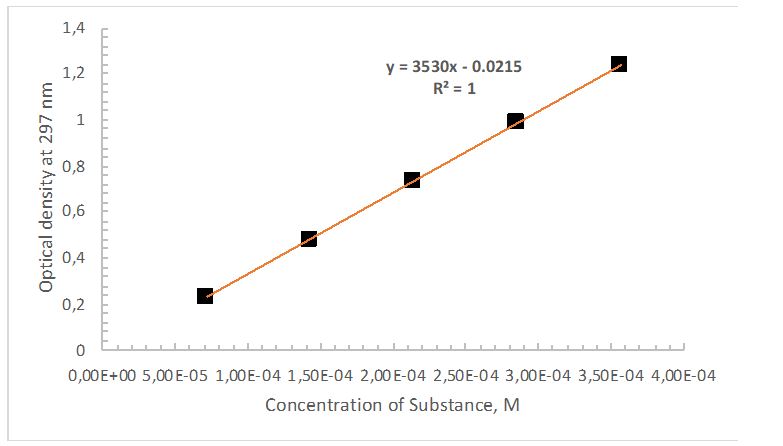
An analytical solution containing 3 mL of salicylic acid was utilized to calibrate the spectrophotometer. The recorded wavelength showing an intense peak for the solution was 297 nm. Measured at this wavelength, the optical densities of all five solutions, whose concentrations are given in Table 1, allowed the calibration curve shown in Figure 2 to be plotted. Using this graph’s slope and the Beer-Lambert law, it was possible to find the molar absorptivity (Equations 1, 3).
The calculated value coincided perfectly with the known literature value, and the calculation error was no more than 0.6%. It is worth noting that both in this study and in the scientific work cited, a similar analyte composition was used.


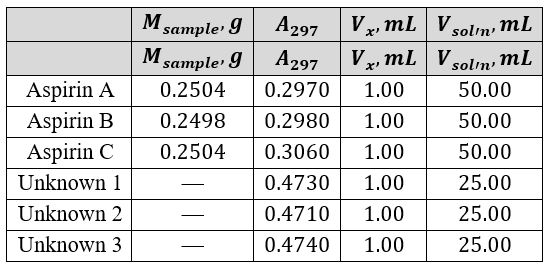
The linear regression equation was used to calculate the triplet concentration from Aspirin tablets and a series of three unknowns (Equations 5 and 6). It was taken into account that tablets A, B, and C were dissolved in 50 mL of NaOH solution, whereas the three unknown samples were dissolved in only 25 mL. Table 2 provides a summary of the mass of ASA in the three samples and the three unknowns and their light absorption.


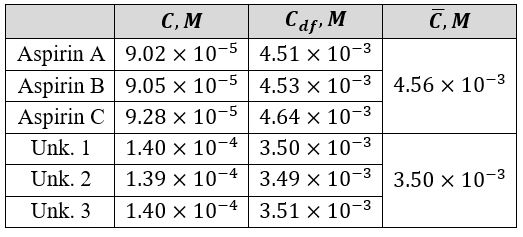
Table 3 illustrates the calculated concentrations, including the dissolution factor (df) of the active ingredient. The accuracy of the obtained mean was checked using the statistical tool %RSD, as shown in equations 7 and 8.


Summary
In this laboratory work, the possibility of using optical UV spectrometry to determine the active substance concentration was investigated. By constructing a calibration curve using known solutions, the concentration of Salicylic Acid (![]() ) in the unknown drugs was determined with an error of average %RSD = 0.31%. Additionally, the amount of substance in three Aspirin tablets was calculated, and this number was
) in the unknown drugs was determined with an error of average %RSD = 0.31%. Additionally, the amount of substance in three Aspirin tablets was calculated, and this number was ![]() with an error of 1.53%.
with an error of 1.53%.
References
- Fernandez, L. T. H.; Klappmeier, F. H.; Experiment for instrumental analysis: the determination of aspirin by ultraviolet absorption. J. Chem. Educ. 1978, 55(4), 266.
- Kim, C.; Ji, T.; Eom, J. B. Determination of organic compounds in water using ultraviolet LED. MST 2018, 29(4), 1-6.